Journal of the Statistical and Social Inquiry Society of Ireland, Vol. XXIV, Part 1,197 8/7 9, pp 149-177.
SYMPOSIUM ON FUTURE DEMANDS FOR AND SUPPLIES OF ENERGY
Dublin Meeting
(Read before the Society, 5 April 1979)
ENERGY FORECASTS - SOME ISSUES
S. Scott*
A realistic set of energy forecasts is fundamental to the formulation of energy policy, yet it would be hard for forecasters in this field to feel anything but massive uncertainty about theii projections. In the foreword to the Department's Energy Forecasts1
1978-1990 is stated: "the enclosed forecasts ... will need to be reviewed from time to time in the light of new information and changing circumstances". These changing circumstances relate not only to GDP, population, indigenous energy supplies and energy price, but also to changing technology and social behaviour. Many forecasters feel that they are on shifting ground and at the moment this is particularly true of the energy forecaster. It would, therefore, be a step in the right direction if we can simply get a feel for some orders of magnitude and establish the existence or otherwise of some important relation-ships.
This papers starts with a brief analysis of the official forecasts for 1990 and finds some indications that these are on the high side. There follows a report on some independent time-series studies which yield projections ranging below the official best estimate and, perhaps more important, throw some light on the responsiveness of energy demand to price.
The Official Forecasts for 1990
The discussion document2, Energy-Ireland, states in the chapter on energy forecasting:
"The best estimates available at present indicate that total energy consumption is likely to increase from 7.51 MTOE in 1977 ... to 18 MTOE by 1990".
This rise of 140 per cent accompanies an assumed GNP rise of about 100 per cent. It goes without saying that there are divided opinions as to whether this 100 per cent GNP increase, or 5.46 per cent average annual increase, is likely to materialise over the 13-year period, 1977—1990. However, since a range of GNP forecasts and associated energy demands are presented, it will be more constructive to confine our comments to
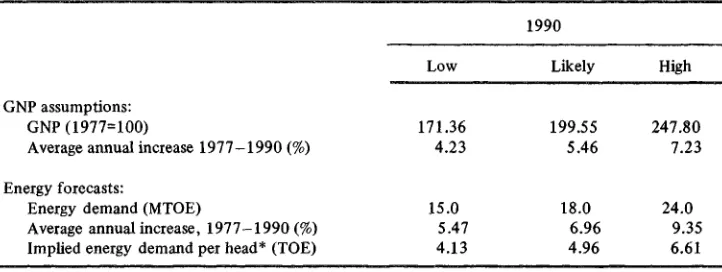
TABLE 1: Official forecasts of energy demand, and assumptions 1990
Low
171.36 4.23
15.0 5.47 4.13
Likely
199.55 5.46
18.0 6.96 4.96
High
247.80 7.23
24.0 9.35 6.61 1990
GNP assumptions: GNP (1977=100)
Average annual increase 1977-1990 (%)
Energy forecasts:
Energy demand (MTOE)
Average annual increase, 1977-1990 (%) Implied energy demand per head* (TOE)
* Assuming population in 1990 to be 3.63 millions, that is adding 1 per cent per annum to the 1986 Projection (2) by W. Keating "An analysis of recent demographic trends with population projections for the years 1981 and 1986". Dublin: Journal of the Statistical and Social Inquiry Society of Ireland, Vol. XXIII, Part IV, 1976/77.
Source: Energy Forecasts 1978-1990. op. cit.
the relationship between energy and GNP which is being assumed. A synopsis of the official forecasts and assumptions is given in Table 1 above.
The most striking aspect of these forecasts is that they appear to have taken no account of price. Projections for different price assumptions are not given, indeed Energy-Ireland's forecasting chapter does not mention price (except to state that the projections do not take account of the possibility of a catastrophic disruption in supply or price).
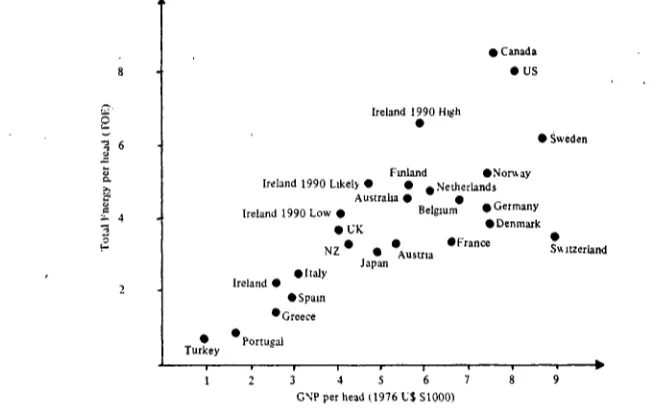
Turning to the figures, we note Energy-Ireland's statement that if one included "a number of energy-intensive industries such as smelters the result would be a far higher usage of energy". From this we can infer that the projections assume that there will be no significant swing to energy intensive production. Yet when we superimpose these forecasts on to a graph which plots energy per head against GNP per head for 1976 (Figure 1) this assumption must be questioned. The "likely" forecasts put our energy consumption per head on a par with energy consumption per head in the Netherlands in 1976 and above that of Germany, Denmark, France and Japan to name but a few. These are quite high per capita forecasts though not inconceivable. What is harder to explain is why Irish people should exceed the consumption level of the average German before reaching two-thirds of the German's income level. Of course, such international comparisons present many problems especially over time. For example, adjusting for purchasing power parities using the GDP measures by Kravis3 reduces the horizontal
discrepancies considerably. However, the likely' forecast still puts Ireland's energy con-sumption per head at a level surpassed only by Canada, USA, Sweden and Norway.
Leaving aside these problems one should ask what are the trends experienced by these various countries in the past and what do they expect in the future. It emerges that the energy intensity of GDP (represented by the slope of the line joining the origin to a country's plot) has declined in other European countries, barring the Netherlands, during 1970—1976. This is understandable. However, even during the period of declining real energy prices, 1963—1973, energy intensity for the six, for example, rose only slightly. For the future, only a rough indication can be obtained from the stated intentions of International Energy Agency members4, summarised in the OECD Observer July 1978.
Figure 1: Total Energy per Head and GNP per Head in OECD Countries 1976 and Official Projections for Ireland 1990 (Low, Likely and High)
—> 4
# Canada • US
Ireland 1990 High 0
• Sweden
Ireland 1990 Likely
Finland
• Netherlands •Norway
• UK
N Z *
Turkey
Australia • w
Ireland 1990 Low • Belgium •G e r m^ • Denmark
' • 'AM* # F r a n C e ^'«"«* Japan
• Italy Ireland •
• Spain • Greece
Portugal
1 2 3 4 5 6 7 8 9
GNTP per head (1976 U$ S1000)
Sources: 1976 Energy per head from OECD Observer, March 1978
1976 GNP per head from World Development Report 1978, World Bank, August 1978 1990 Energy consumption and GNP growth for Ireland from Energy Forecasts 1978-1990 1990 Population in Ireland: 1 per cent per annum added to the average 1986 population in W. Keating op. cit.
Figure 2: Energy Intensiveness of GDP, Actual 1976 and Projected Offical 1990 for Some IE A Countries, Plotted against 1976 GNP per Head
2 0 I
1.5
1 0
-0 5
i
Ireland • •Spain
UK
Greece 1 ^taly
• 1976 Actual intensi
[image:3.490.93.356.385.560.2]Netherlands | N Zealand t
| i *•»»
B J L J
Austria <
German}
\eness
Key}
• 1990 Projected intensiveness
• Canada
USA
J Norway 1 Sweden
ltzerland
1 2 3 4 5 6 7 8 9 '
GNP per head (1976, U$ SI000)
Sources: Energy Intensiveness (in TOE per US fllOOO of GDP at 1970 prices and exchange rates) from
OECD Observer, July 1978 with figure for Ireland in 1990 revised to 18 MTOE (top arrow) or 16.5 MTOE (bottom arrow), the latter allowing for conservation as outlined in Energy-Ireland.
and 1990 energy intensity implied by each country's energy and GDP projections to 1990. The figures for Ireland have been altered to reflect the Energy Forecasts 1978— 1990 which are lower than the original. A second projection is shown for Ireland which takes account of the "further or enhanced" conservation measures referred to in Energy-Ireland. These bring consumption in 1990 down to 16.5 MTOE. The plot shows Ireland and New Zealand at one extreme and Germany, Denmark, Norway, Sweden and Switzer-land at the other. The problems of international comparisons arise again and there is probably an element of wishful thinking in many cases. It is also likely that the com-position of output in some countries will include more products with a high labour-skill content. One still remains to be convinced, however, that Ireland's official forecasts are realistic.
An Independent Time-Series Analysis
It is interesting to see what projections emerge from a study of the time-series which is available. Obviously, such a study is only a small part of the analysis required to forecast energy demand, about which, more later.
In fact, we find that a simple time-series analysis, incorporating the 'likely' assumption of 100 per cent GDP growth and what might be termed a moderate real energy price rise6
of 20 per cent, gives projections which are almost identical to the offical forecasts. The constant elasticity formulation, which performs fairly satisfactorily on statistical grounds, is given in equation (1). This expresses energy per head as a function of GDP per head and energy's real price, all in log form (In = natural logarithm).
(1) In E = 3.05+1.41 In G D P - 0 . 3 0 In P
(5.06) (26.88) (2.29) (t values in brackets)
Adj. R2 = 0.9 8 GDP elasticity =1.41
DW =1.52 Price elasticity = -0.30
Price emerges as significant but the price elasticity is quite small. The projections from this model are given in Column (1) of Table 2. Four combinations of GDP and energy price are presented. The first combination, row 1, with 100 per cent GDP and 20 per cent price would be closest to the official assumptions. Some people would consider the third to be realistic assumptions: 70 per cent GDP and 20 per cent price rise.
It is, however, highly probable that the response to price takes time to materialise. Habits take time to adjust. Decisions to buy new equipment and the scrapping of old equipment take time. If we allow for this time-lag7, the model shows an improvement (as
measured by the Durbin-Watson statistic). The result is given here as equation (2). The subscript t refers to the year.
(2) In Et = 4.95+ 1.50 In G D Pt- 0 . 7 0 £ 0.4 ( l - 0 . 4 )k In Pt_k - 1
(6.20) (21.00) (4.10)~
Adj. R2 = .98 GDP elasticity = 1.50
DW = 1.82 Price elasticity = -0.28 (short-run) Mean lag = 1.50 Price elasticity = —0.70 (long-run)
The official projections assume a declining GDP elasticity, though averaging at 1.27 for the whole period. The constant GDP elasticity of 1.4 or 1.5 derived from our two equations above is not plausible over an extended period, since it implies an ever increasing share of energy in GDP. A formulation with declining GDP elasticity has a near acceptable DW which was not the case before the price lag was introduced. Our model then becomes equation (3).
(3) Et = 5.46+ 2.86 In G D Pt- 0 . 0 1 5 £ 0.295 (l-0.295)k Pt_k_x
k=0
(3.46)
GDP elasticity (1977) =1.21
Price elasticity (1977) = -0.20 (short-run) Price elasticity (1977) = -0.69 (long-run) The projections from these last two equations are given in columns (2) and (3) of Table 2.
(11.69) (16.71) Adj R2 = .97
DW = 1.47 Mean lag = 2.39
TABLE 2: Projections to 1990 using the above three equations (MTOE)
GDP elasticity: (1)
Constant
(2)
Constant
(3)
Declining*
Growth assumptions 1977-1990 (%)
GDP
100 70 70 70
Price
20 0 20
* 50
Simple time-series
18.4 15.6 14.8 13.8
Time series with lagged price response
17.65 15.44 13.93 12.28
13.21 12.43 11.57 10.34
* This formulation produces a GDP elasticity in 1990 ranging from about 0.8 to 1.0. Note that the European Community objective for 1985 is 0.8, and that for 1963-73 and 1970-76 in the Nine it was 1.0 and 0.66 respectively.
We now have a wide range of projections within each set of GDP and price assumptions. Note that if we had merely assumed constant energy intensiveness of GDP, we would have 15 MTOE for 100 per cent GDP growth and just under 13 MTOE for 70 per cent GDP growth, both of which are within the ranges. A constant energy intensity is by no means impossible since Ireland is already close to the top in the OECD league table of energy intensities (or in the middle if one adjusts for purchasing power parity). Com-paring Table 2 with the official projections, we note that the latter are at the top of our range, which assumes a constant GDP elasticity in excess of 1. It is undoubtedly more realistic to assume a declining GDP elasticity and a time lag in the response to price. This gives markedly lower projections.
Conclusion
they enhance the need for a study of energy demand in some detail, particularly of industry. The official forecasts give an industrial demand of 10.4 MTOE in 1990 which is more than all the energy consumed in Ireland at present. This implies a 4 per cent rise in the energy intensiveness of Irish industry, yet we know that existing industries could realise at least some energy savings per unit of output. Furthermore the introduction of a significant number of energy intensive industries was ruled out in the assumptions8
The evidence that energy price has a reasonable effect is encouraging. A long-run price elasticity of —0.7 is not insignificant, and while we might not hail price manipulation as a bright new option, it should certainly be given more consideration than at present. The Government's existing conservation measures are being hampered by a series of price distortions. Turfs price is pegged artiflcally low, this indirectly lowers electricity's price. The indirect costs of private motoring were recently reduced. VAT on various oils was removed in 1975. Fuel grants are available to some sections of the community. The aims of these measures might be fulfilled in a different way, a way which did not constitute an anti-conservation policy.
Footnotes
1. Energy Forecasts 1978-1990. Department of Industry, Commerce and Energy, Dublin, 1978. 2. Energy-Ireland. Discussion document on some current problems and options, Department of
Industry, Commerce and Energy, July 1978.
3. Kravis, I. B. et al, 1978. "Real GDP per capita for more than one hundred countries". Economic
Journal, June.
4. International Energy Agency, 1977 IEA Reviews of National Energy Programmes, Paris, 1978. 5. Data, such as it is, runs from 1958-1977 and is available on request. All regressions presented
here are part of a set of time-series studies by the author. E = total energy demand per head (TOE)
GDP = GDP by sector of origin per head (£'000 1970)
P = Fuel and light price index deflated by all items price index (both August 1953 = 100). 6. Note that by our measure the real price rise during 1973/74 for fuel and light was 31 per cent. 7. A geometric or Koyck type lag was specified, using the maximum likelihood search routine in the
EAS package.