Changes in the Levels of Selected Organic Acids and Sugars
in Apple Juice after Cold Storage
Ján MEZEY1 and Ivana MEZEYOVÁ2
1Department of Fruit growing and 2Department of Vegetable Production, Viticulture
and Enology, Slovak University of Agriculture in Nitra, Nitra, Slovak Republic *Corresponding author: [email protected]
Abstract
Mezey J., Mezeyová I. (2018): Changes in the levels of selected organic acids and sugars in apple juice after cold storage. Czech J. Food Sci., 36: 175–180.
Apples are a source of sugars, acids, and various biologically active compounds, such as phenolic compounds, which are responsible for most of the antioxidant activities of the fruit. The aim of this study was to evaluate how the cold storage of apple fruits affects the nutritional composition of selected organic acid and sugar content in juice in com-parison to juice from fresh fruits. Statistical differences were confirmed between the content of citric acid, malic acid, total acid, pH, sucrose, fructose and glucose in juice from fresh fruits and from juice stored for 140 days. No statistical differences were observed between juice from fresh fruit and juice from fruits stored for 140 days in the content of acetic acid, tartaric acid, total sugar and sweetness index.
Keywords: fructose; glucose; malic acid; pH value; total acid; total sugar
Supported by AgroBioTech Research Centre, Grant No. ITMS 26220220180.
Apples constitute an important part of the human diet, as they are a source of sugars, acids and vari-ous biologically active compounds, such as phenolic compounds, which are responsible for most of the antioxidant activities of the fruit (Wu et al. 2007). Fruits and vegetables are often most attractive and nutritious when harvested at their peak maturity. At retail stores, fruits and vegetables may spend one to three days on display prior to being purchased by the consumer, who may store them for up to seven days prior to consumption (Barrett 2007). Cold storage involves controlling the temperature in a storage room using mechanical refrigeration. Usu-ally, apples are stored in refrigerated (from –1°C to –3°C) warehouses from about one to two days after harvest and the temperature of the apples is low-ered to between –1 to 5°C after three to five days. (Giupu & Duo 2008). The quality of apples changes rapidly during storage and thus, substantially af-fects their acceptability for consumers (Vieira et
al. 2009). Quality cannot be improved, but it can be largely maintained during storage. (Giupu & Duo 2008). Most perishable commodities, however, are stored under refrigerated conditions, and storage life may range from eight to ten days for highly per-ishable fruits like berries to eight to ten weeks for less-perishable commodities like squash, pumpkin, apples, grapes and pears (Barrett 2007). Soluble sugars in fruits are mainly represented by sucrose, fructose and glucose, whilst malic, citric, and tartaric acids are the primary organic acids (Mahmood
et al. 2012). The right proportion of these sugars determines the quality of the fruits. (Wang et al. 2008); similarly, malic, citric, and tartaric acids are not equally acidic (Bordonaba & Terry 2010). Apple fruits are rich in fructose, which accounts for 44–75% of the total sugars (Wu et al. 2007). Roth
during respiration is sugar (Chen et al. 2006). Or-ganic acids are generally recognised as safe (GRAS) for use as food ingredients. Some organic acids have been evaluated as sanitisers on fruits and vegetables (Park et al. 2011). Malic acid is the dominant acid in apple fruits, accounting for up to 90% of the total organic acids (Wu et al. 2007; Zhang et al. 2010) and has an important influence on the sour taste of apples. In cultivars with low amounts of malic acid, the sweet taste becomes predominant (Verberic et al. 2009). Therefore, its content decreases during storage, particularly in conditions of high oxygen concentration (Roth et al. 2007). Most fresh fruits are acidic with a pH range from 3 to 5. (Barrett 2007). Citric acid (CA) is extensively used in the food, dairy, pharmaceutical, cosmetics, agricultural, and biochemical industries, among others (Dhillon et al. 2010). As an antioxidant synergist with ascorbic or erythorbic acid and as a pH regulator (Barrett 2007), citric acid is present in greater than trace amounts in a variety of fruits and vegetables, most notably citrus fruits (Penniston 2008). Tartaric acid has a strong, tart taste and augments natural and synthetic fruit flavours, especially grape and cranberry; it is a natural component of numerous fruits including currants, raspberries, cranberries and grapes (Barrett 2007). The aim of this study was to evaluate the impact of cold storage of apple fruits on the nutritional composition of juice.
MATERIAL AND METHODS
Fresh apple fruits (M. domestica) were purchased from the botanical garden of Slovak Agriculture University in Nitra, Slovakia on 15.10.2016. Apples were washed with running tap water, dried with paper towels and then cut into four pieces using a stainless-steel knife. For evaluation, approx. 1000 g of apples were used. Stalk and seeds were removed. Apple juice was extracted using a household table top juice extractor (Le Duo Plus; Magimix, France) and filtered through sterilised double-layered muslin cloth to remove impurities and coarse particles. The resulting juice was mixed and divided into three different parts as working samples for spectropho-tometric measurement. The same procedures were carried out after 140 days of cold storage at 1–2°C with a relative air humidity of 90–95%.
The following 26 late ripening varieties were evalu-ated: Angold, Bohemia, Boikovo, Boskoopské, Dalila,
Darina, Denár, Doris, Elstar, Florina, Gloster, Golden Delicious, Goldspur, Granny Smith, Hontianske, Idared, Jonathan, Karmína, Lord Lambourne, Luna, McIntosh Red, Melodie, Melrose, Mutsu, Nabela, and Ontario. Trees were trained in spindle form with a support system and drip irrigation, were planted in 2008 on rootstock (M9-T337) with 4.0 × 1.0 m spac-ing of and were grown as organic apples.
Chemical quality parameters. An FT-IR spectro-photometer (Alpha Wine Analyser; Bruker Optics, USA) was used to analyse the following parameters: sucrose, glucose, fructose, total sugar, citric acid (CA), malic acid (MA), acetic acid (AA), tartaric acid (TA), total acid and pH. Three replicates were tested for each sample. Total sugar content and total acid content was estimated as the arithmeti-cal average of total sugar and acid content of all 26 apple varieties.
Sweetness index (SI). SI was estimated for each apple according to a modified method previously described by Keutgen and Pawelzik (2007). The contribution of each major sugar found in apple fruits was calculated, considering that fructose and glucose are 1.7 and 0.75 times sweeter than sucrose, respectively. As a result, the SI is the sum of 0.75 (glucose), 1.0 (sucrose) and 1.7 (fructose) (Baiquan 2015).
Statistical evaluation. Analysis was performed using Statgraphic Centurion XVII (StatPoint Inc., USA). Obtained results were evaluated using analysis of variance (ANOVA), the multifactor analysis of variance and the multiple range test. Correlation analyses were done in Excel by testing the interde-pendencies of the selected parameters.
Plus and minus points. This evaluation meas-ures the overall characteristics of a variety based on maximum and minimum parameter values in fresh juice, in juice from fruits stored for 140 days, and varieties with the biggest increase or decrease in the measured parameters are assigned plus or minus points, respectively.
Plus points were assigned if a variety reached the maximum value of total sugar, glucose, fructose, sucrose, SI, total acid, CA, MA, TA, and minimum value of pH in fresh juice and in juice after 140 days of cold storage.
RESULTS AND DISCUSSION
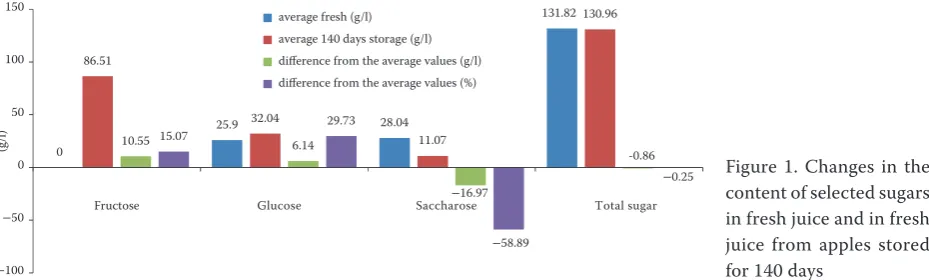
The results showed significant qualitative differ-ences in the composition of apple cultivars, par-ticularly in their acid and sugar contents. Fructose was the most dominant sugar in the different apple cultivars, followed by glucose and sucrose, while MA was the principal organic acid.
Fresh juice. The sugar with the biggest average share in the measured apples was fructose with 58.51%, followed by sucrose with 21.56% and glucose with 19.94%. The variety with the highest total sugar content was cv. Nabela (166 ± 15 g/l), while the low-est total sugar content was measured in cv. Ontario (99 ± 15 g/l). The average total sugar content was 132 ± 15 g/l. Baiquan (2015) reported that total sugar content ranged from 29.9 g/l to 205.4 g/l with an average of 92.7 g/l.
The highest fructose content of 98 ± 10 g/l was measured in cv. Nabela, which is 58.7% of total sugar content; the lowest fructose content of 58 ± 10 g/l was measured in cv. Florina. The average fructose content was 76 ± 10 g/l. Wu et al. (2007) reported that average fructose content in eight apple cultivars was 53.9 g/l; the highest value was 64.5 g/l, and the lowest was 42.6 g/l.
The highest glucose content of 43.3 ± 7.8 g/l was measured in cv. Boikovo; the lowest glucose content of 13.4 ± 7.8 g/l was measured in cv. Florina. The average glucose content was 25.9 ± 7.8 g/l. The high-est sucrose content of 48.4 ± 9.3 g/l was measured in cv. Bohemia; the lowest sucrose content of 12.3 ± 9.3 g/l was measured in cv. Karmina. The average sucrose content was 28 ± 9.3 g/l. In study of Wu et al. (2007), the average glucose content was 33.8 g/l, while the highest content was 38.7 g/l, and the low-est content was 24.7 g/l.
The highest SI was measured in cv. Nabella and came to 202 ± 19; the lowest SI value of 120 ± 19
was measured in cv. Granny Smith. The average sweetness index was 157 ± 19.
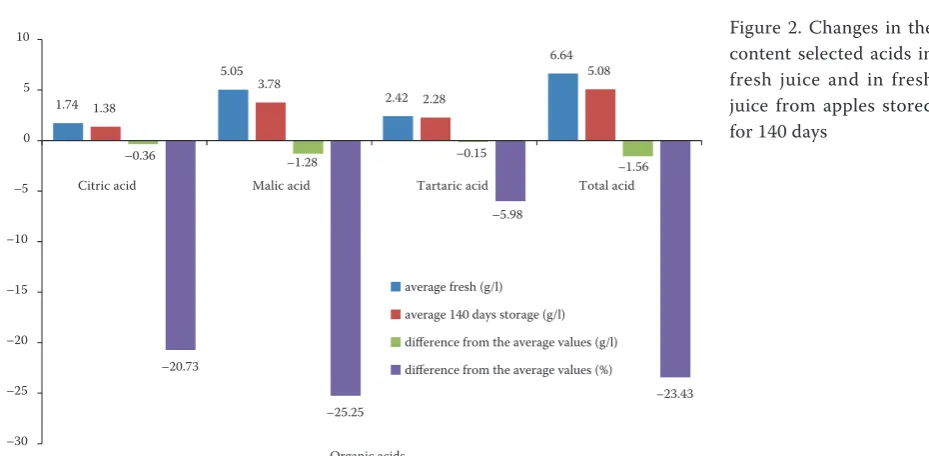
The organic acid with the biggest average share in the measured apples was MA with 55.19%, followed by TA with 25.97% and CA with 18.83%.
The highest total acid content was in cv. Boskoop (13.8 ± 2.0 g/l); the lowest total acid content was measured in cv. Luna (6.1 ± 2.0 g/l). The average total acid content was 9.7 ± 2.0 g/l. The acid con-centration in apple juices ranged between 3.73 and 6.58 g/l (Dobrowolska et al. 2015). The highest CA content of 2.66 ± 0.55 g/l was measured in cv. Darina; the lowest CA content of 0.82 ± 0.55 g/l was measured in cv. McIntosh Red. The average CA content was 1.74 ± 0.55 g/l. The highest MA content was measured in cv. Boskoop (8.9 ± 1.9 g/l); the lowest MA content was measured in cv. Florina (1.4 ± 1.9 g/l). The average MA content was 5.1 ± 1.9 g/l. The highest TA content was measured in cvs Boikovo and Angold (both 4.4 ± 0.72 g/l); the low-est TA content of 1.5 ± 0.72 g/l was measured in cv. Elstar. The average TA content was 2.4 ± 0.72 g/l. The highest pH of 3.51 ± 0.21was measured in cvs Denár and Bohemia; the lowest pH of 2.71 ± 0.21
was measured in cv. Angold. The average pH was 3.25 ± 0.21. In study of Baiquan (2015), average malic acid content was 4.83 g/l. In the study of Wu
et al. (2007), average malic acid content was 4.61g/l; the highest content was 7.07g/l and the lowest was 2.73g/l. The average pH level was 3.87, with a highest value of 4.16 and a lowest value of 3.40.
Apple juices after cold storage for 140 days. In comparison to fresh juice, the share of fructose was increased by 13.8%, sucrose was decreased by 60.5% and glucose content was increased by 23.7%. Sucrose decrease is due to the conversion to the monosaccha-rides glucose and fructose. In general, the total sugar content in apples stored for 140 days in cold storage decreased by 0.3 g/l, which is 0.2%. The SI in stored
0
25.9 28.04
131.82
86.51
32.04
11.07
130.96
10.55 6.14
–16.97
-0.86
15.07 29.73
–58.89
–0.25
–100 –50 0 50 100 150
Fructose Glucose Saccharose Total sugar
(g/
l)
[image:3.595.66.531.626.766.2]average fresh (g/l) average 140 days storage (g/l) difference from the average values (g/l) difference from the average values (%)
apples was 158.13, which is an increase of 0.6% in comparison to fresh apple juice. A decline in sucrose content was also observed in pears during storage, while the levels of fructose and glucose increased over five months of storage at 0°C (Chen et al. 2006).
The biggest rise in total sugar content was ob-served in the cv. Ontario, the increase was 17.18%; the biggest decrease was observed in the cv. Angold (–23.13%). Average selected sugar content change can be seen in Figure 2. The biggest increase in SI was observed in the cv. Granny Smith (21.91%); the biggest decrease in the SI was observed in the cv. Angold (–23.59%). Despite the increases/decreases of the measured parameters (total sugar content and SI), differences were not statistically significant (Table 1). The increase in sugar content can be explained by
water loss during storage, which consequently leads to a higher concentration of sugars inside the cells. This is also a basis for juice concentrate production with the use of a rotary vacuum evaporator.
The Mutsu variety was the only variety with a total acid increase, which came to 6.67%. The big-gest decrease in total acid content was observed in the cv. Angold (–50%). The biggest increase in MA was observed in the Luna variety; the increase was 66.67%. The biggest decrease in MA was observed in cv. McIntosh Red and came to –53.61%. The big-gest increase in TA was observed in the cv. Elstar and came to 55.33%. The biggest decrease in TA was observed in the cv. Boikovo, with a decrease of 56.82%. Average selected acids content change can be seen in Figure 2.
1.74 5.05 2.42 6.64 1.38 3.78 2.28 5.08
–0.36 –1.28 –0.15
–1.56 –20.73 –25.25 –5.98 –23.43 –30 –25 –20 –15 –10 –5 0 5 10
Citric acid Malic acid Tartaric acid Total acid
Organic acids
[image:4.595.64.529.98.326.2]average fresh (g/l) average 140 days storage (g/l) difference from the average values (g/l) difference from the average values (%)
Figure 2. Changes in the content selected acids in fresh juice and in fresh juice from apples stored for 140 days
6 5
2 2 2 1 1 1 1 1 1 1 1 1 3 1 1
1 – 1 – 1 – 1 – 1 – 1 - –2
–6 –3 –5 –8 6
5
2 2 1
1 1 1 1
–1 –1 –3 -3 –4 –7 –20 –15 –10 –5 0 5 10 15 Bo sk oo p N ab ela Bo hem ia D ar in a Bo ik ov o De ná r D al ila Ho nt ia ns ke M ut su O nt ar io G ra nny S m ith Lu na M el od ie K ar m in a M cI nt os h Re d Flo rin a Melro se El st ar A ng ol d Po sitive /ne ga tive po int s Varieties
plus points minus points difference plus/minus
[image:4.595.71.520.565.770.2]In comparison to the pH of fresh apple juice, an increase of 0.13 was observed in apples stored in the cold, a difference of 4.24%. The biggest increase in pH was observed in the Florina variety (20.29%). The biggest decrease in pH was observed in the Melrose variety (–8.93%). Decrease of pH level was also re-ported by Blažek et al. (2003), and which was very closely related to the total acid content.
Statistical evaluation. In apple juice from fresh fruits, positive correlations between fructose and total sugar content (r2 = 0.6955), fructose and density (r2 = 0.7032), density and total sugar (r2 = 0.9183) and MA and total acid (r2 = 0.861) were observed. In stored fruit, the same correlations between fructose and total sugar content (r2 = 0.7632), fructose and density (r2 = 0.6693), density and total sugar (r2 = 0.9304) and between MA and total acid (r2 = 0.8534) were observed.
A correlation between glucose and fructose con-tent was not confirmed in line with the findings of Baiquan (2015).
Some statistically significant differences were found between juice from fresh fruit and juice from fruits stored for 140 days, namely, in the content of CA, MA, total acid, pH, sucrose, fructose, and glucose. No statistically significant differences were found in the content of AA, TA, total sugar and SI (Table 1).
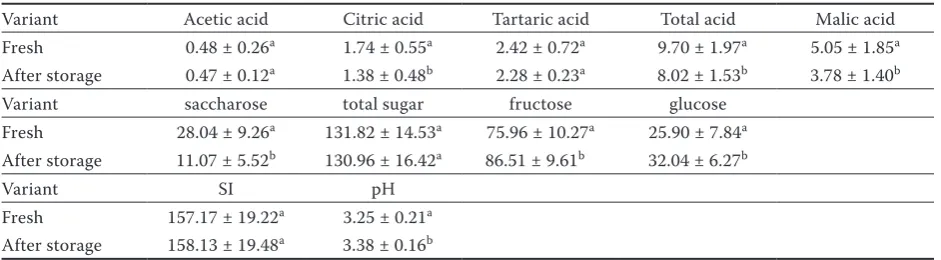
Positive and negative points. In this evaluation, the best variety was Boskoop, as it reached the maximum values of total acid and MA in fresh juice and maxi-mum values in total sugar, glucose, total acid, and MA (6 plus points) in juice from stored fruits. The variety with the highest minus points was Angold; this variety reached the highest value of pH in fresh juice, lowest values of fructose and CA in juice from stored fruits and the biggest decrease of total sugar, fructose, SI, total acid, and CA content (8 minus points).
CONCLUSIONS
We could confirm statistically significant differences in content of CA, MA, total acid, pH, sucrose, fructose and glucose between juice from fresh fruits and from juice stored for 140 days. No statistically significant differences between juice from fresh fruit and juice from fruits stored for 140 days were observed for AA, TA, and total sugar content as well as for SI.
From a practical point of view, the three varieties with the highest total sugar content in fresh juice were Nabela, Rajka and Boskoop, and the three va-rieties with the highest total acid content in fresh juice were Boskoop, Boikovo and Ontario. Blends of
Table 2. Total acid and total sugar content in the juice of the studied apples after 140 days of cold storage
Under average sugar and acid content Elstar, Doris, Florina, Luna, Angold, Melrose, Jonathan, Denár, Melodie Over average sugar content,
under average acid content Golden Delicious, MacIntosh, Idared, Bohemia, Goldspur, Mutsu, Darina, Lord Lambourne Under average sugar content,
over average acid content Hontianske, Ontario
[image:5.595.63.534.123.253.2]Over average sugar and acid content Dalila, Gloster, Nabella, Boikovo, Karmina, Granny Smith, Boskoop
Table 1. Statistically significant differences between juice from fresh fruit and juice from fruits stored for 140 days
Variant Acetic acid Citric acid Tartaric acid Total acid Malic acid Fresh 0.48 ± 0.26a 1.74 ± 0.55a 2.42 ± 0.72a 9.70 ± 1.97a 5.05 ± 1.85a After storage 0.47 ± 0.12a 1.38 ± 0.48b 2.28 ± 0.23a 8.02 ± 1.53b 3.78 ± 1.40b
Variant saccharose total sugar fructose glucose
Fresh 28.04 ± 9.26a 131.82 ± 14.53a 75.96 ± 10.27a 25.90 ± 7.84a After storage 11.07 ± 5.52b 130.96 ± 16.42a 86.51 ± 9.61b 32.04 ± 6.27b
Variant SI pH
Fresh 157.17 ± 19.22a 3.25 ± 0.21a After storage 158.13 ± 19.48a 3.38 ± 0.16b
these varieties, especially including Boskoop, are very suitable for the production of juice or cider because of their high content of sugar and also acids.
After 140 days in cold storage, the highest total sugar content was measured in the Boskoop, Nabela, and Dalila varieties; the highest content of organic acids was measured in the Boskoop, Granny Smith, and Ontario varieties. It can be assumed that these varieties are also highly suitable for juice and cider processing after 140 days of cold storage. Angold, Elstar and Melrose varieties appear to be rather un-suitable for juice and cider processing after 140 days of cold storage because of their sharp decreases in sugar and acid content. Total acid and total sugar content in the juice of the analysed apple varieties after 140 days of cold storage is shown in Table 2.
References
Baiquan M., Jie Ch., Hongyu Z., Ting F., Collins O., Shaohua L., Yuepeng H., Benhong W. (2015): Comparative assess-ment of sugar and malic acid composition in cultivated and wild apples. Food Chemistry, 172: 86–91.
Barrett D.M. (2007): Maximizing the nutritional value of fruits and vegetables. Food Technology, 61: 40–44. Blažek J., Hlušičková I., Varga A. (2003): Changes in quality
characteristics of Golden Delicious apples under differ-ent storage conditions and correlations between them. Horticultural Science, 30: 81–89.
Bordonaba K., Terry L.A. (2010): Manipulating the taste-related composition of strawberry fruits (F. ananassa) from different cultivars using deficit irrigation. Food Chemistry, 122: 1020–1026.
Chen J.L., Yan S., Feng Z., Lixia X., Song Hu X. (2006): Changes in the volatile compounds and chemical and physical properties of Yali pear (Pyrus bertschneideri
Reld) during storage. Food Chemistry, 97: 248–255.
Dhillon G.S., Brar S.K., Verma M., Tyagi R.D. (2010): Recent advances in citric acid bio-production and recovery. Food and Bioprocess Technology, 4: 505–529.
Dobrowolska-Iwanek J., Gąstoł M., Adamska A., Krośniak M., Zagrodzki P. (2015): Traditional versus modern ap-ple cultivars a comparison of juice composition. Folia Horticulturae, 27: 33–41.
Giupu L., Duo L. (2008): Postharvest storage of apples in China: a case study. In: Robertson G.L., Lupien, J.R. (eds): Using Food Science and Technology to Improve Nutrition and Promote National Development. Chapter 9. Paris, France: 1–14.
Keutgen A., Pawelzik E. (2007): Modifications of taste-rele-vant compounds in strawberry fruit under NaCl salinity. Food Chemistry, 105: 1487–1494.
Mahmood T., Anwar F., Abbas M., Boyce M.C., Saari N. (2012): Compositional variation in sugars and organic acids at different maturity stages in selected small fruits from Pakistan. International Journal of Molecular Sci-ences, 13: 1380–1392.
Park S.H., Choi M.R., Park J.W., Park K.H., Chung M.S., Ryu S., Kang D.H. (2011): Use of organic acids to inactivate E. coliO157:H7,Salmonellatyphimurium, andL. mono-cytogeneson organic fresh apples and lettuce. Journal of Food Science, 76: M293–M298.
Penniston K.L., Nakada S.Y., Holmes R.P., Assimos D.G., Nakada K., Holmes A., Assimos V. (2008): Quantitative assessment of citric acid in lemon juice, lime juice, and commercially-available fruit juice products. Journal of Endourology, 22: 567–570.
Roth E., Berna A., Beullens K., Yarramraju S., Lammertyn J., Schenk A., Nicolai B. (2007): Postharvest quality of inte-grated and organically produced apple fruit. Postharvest Biology and Technology, 45: 11–19.
Veberic R., Jakopic J., Stampar F., Schmitzer V. (2009): Euro-pean elderberry (S. nigra L.) rich in sugars, organic acids, anthocyanins and selected polyphenols. Food Chemistry, 114: 511–515.
Vieira F., Borges G., Copetti C., Amboni R., Denardi F., Fett R. (2009): Physico-chemical and antioxidant properties of six apple cultivars grown in southern Brazil. Scientia Horticulturae, 122: 421–425.
Wang S.I., Chen Ch., Sciarappa W., Wang Ch., Camp M.J. (2008): Fruit quality, antioxidant capacity, and flavonoid content of organically and conventionally grown blue-berries. Journal of Agricultural and Food Chemistry, 56: 5788–9574.
Wu J., Gao H., Zhao L., Liao X., Chen F., Wang Z., Hu X. (2007): Chemical compositional characterization of some apple cultivars. Food Chemistry, 103: 88–93.
Zhang Y., Li P., Cheng L. (2010): Developmental changes of carbohydrates, organic acids, amino acids, and phenolic compounds in ‘Honeycrisp’ apple flesh. Food Chemistry, 123: 1013–1018.