_____________________________________________________________________________________________________ *Corresponding author: E-mail: [email protected];
(Past name: American Chemical Science Journal, Past ISSN: 2249-0205)
Preparation and Characterization of Activated
Carbons from Bitter Kola (
Garcinia kola
) Nut Shells
by Chemical Activation Method Using H
3
PO
4
; KOH
and ZnCl
2
Kuete Tiotsop Idris-Hermann
1, Tchuifon Tchuifon Donald Raoul
1,
Doungmo Giscard
2and Anagho Solomon Gabche
1,3*1Research Unit of Noxious Chemistry and Environmental Engineering, Department of Chemistry,
Faculty of Science, University of Dschang, P.O.Box 67, Dschang, Cameroon. 2
Institute of Inorganic Chemistry, Christian-Albrechts-Universität zu Kiel, Max-Eyth-Strae 2, 24118 Kiel, Germany.
3Department of Chemistry, Faculty of Science, University of Bamenda, P.O.Box 39, Bambili,
Cameroon.
Authors’ contributions
This work was carried out in collaboration between all authors. Authors KTIH and ASG designed the study, performed the statistical analysis, wrote the protocol and wrote the first draft of the manuscript. Authors TTDR and DG managed the analyses of the study. Authors KTIH and TTDR managed the literature searches. All authors read and approved the final manuscript.
Article Information
DOI: 10.9734/CSJI/2018/43411 Editor(s): (1)Dr. A. V. Raghu, Department of Food Technology, Centre for Emerging Technologies-Coordinator, School of Engineering Technology, Jain Global Campus, Jain University, India. (2)Dr. Akmal S. Gaballa, Professor, Faculty of Specific Education, Zagazig University, Zagazig, Egypt. Reviewers: (1)Abugu, Hillary Onyeka, Nnamdi Azikiwe University, Nigeria. (2)Ronald Bartzatt, University of Nebraska, USA. (3)Nobuaki Tanaka, Shinshu University, Japan. Complete Peer review History:http://www.sciencedomain.org/review-history/26057
Received 9th June 2018 Accepted 22nd August 2018 Published 31st August 2018
ABSTRACT
Aims: Investigate the changes occurring in the composition of Garcinia kola nut shell after an activation process, especially the characteristics of the chemically activated carbons (ACs) obtained.
Study Design: Determine of the physicochemical properties of the prepared ACs using optimized experimental data.
Place and Duration of Study: Research Unit of Noxious Chemistry and Environmental Engineering, Department of Chemistry, Faculty of Science, University of Dschang, between February 2016 and March 2018.
Methodology: Garcinia kola nut shell (bitter kola nut shell) were used to prepare ACs by chemical activation using H3PO4, KOH and ZnCl2 using the carbonization temperatures 400, 450 and 500°C and the different impregnation ratios 1/1 and 2/1. The effects of the composition of the components on the iodine number and iodine methylene blue number of the ACs were investigated. The best ACs were selected after optimization of the experimental data obtained in the laboratory.
Results: Increase in carbonization temperature from 400°C to 500°C led to a decrease in the iodine number and an increase of in burn-off. For the production of ACs, the optimum temperature was found to be 400°C for 1 hour heating, with impregnation ratio of 1/1 by KOH, ZnCl2 ACs and 2/1 for the H3PO4 AC. Thermo-gravimetric analysis of the raw material was carried out to confirm the thermal stability of the ACs obtained at the optimum temperature of 400°C. The functional surfaces of the ACs and raw materials were studied by Bohem titration, pH, pzc, and FT-IR techniques. SEM analysis illustrates an irregular and heterogeneous surface morphology with a developed and fragmented porous structure of various sizes. Powder X-ray diffraction analysis showed that the raw material and ACs prepared are essentially amorphous.
Conclusion: Chemical activation is one of the appropriate methods that can be used to obtain new ACs. The maximum iodine number of the ACs was obtained at carbonization temperature of 400°C for a period of 1 hr, with impregnation ratios 2/1 and 1/1.
Keywords: Garcina kola shell; Activated Carbons (ACs); chemical activation; iodine number; burn-off; amorphous.
ABBREVIATIONS
ACs : Activated Carbons
CBH : Activated Carbon Impregnated by
Phosphoric Acid
CBK : Activated Carbon Impregnated by
Potassium Hydroxide
CBZ : Activated Carbon Impregnated by Zinc
Chloride
ASTM : American Society for Testing and Materials
pHzpc : pH at Zero-point Charge
1. INTRODUCTION
The worldwide increase of urbanization and
industrialization obviously leads to huge
environmental contaminations, especially in surface and groundwater resources. To reduce environmental contaminants, activated carbons (ACs) which are solid materials, black in color and highly porous in nature, are well-established good adsorbents. It has been clearly shown that their high adsorbent capacity is due to their microporosity, mesoporosity, high surface area, large pore volume, greater extent of surface reactivity [1] and variable characteristics of surface chemistry, low ash content, relatively high mechanical strength, and their amorphous nature. ACs are the final product of activation
carried out at lower temperature (400-700°C) [10]. The activating agent act as dehydrating agent that inhibit the formation of tar as well as reject volatile substances during the process, which helps to enhance the yield of the activated carbons and to decrease the carbonization temperature compared to physical activation method. The production of AC from agricultural
by-products has both economic and
environmental effects, as it converts unwanted, low-value agricultural waste to useful high-value adsorbent [11]. Finally, it reduces the importation of activated carbon.
In the present work, ACs were prepared from carbonaceous agriculture waste, bitter kola nut shell by using chemical activating agents phosphoric acid, potassium hydroxide and zinc
chloride at different temperatures and
impregnation ratios. Bitter kola nut shell are waste products obtained when bitter kola (Garcinia kola) are removed. Garcinia kola, a flowering plant (Clusiacae family) also known as “bitter kola” is an economic tree growing in humid forestlands of West and Central Africa with a long history of use in traditional medicine [12] and traditional events. Cameroonians greatly consume it, particularly in the West region. After bitter kola are removed most of its nut shells are discarded as solid waste or burned off in stacks or used as mulch, which suppresses weeds, and other vegetable growth. In turn, the shell of bitter kola becomes a residue, which has no commercial value and causes environmental
pollution and degradation. Therefore, the
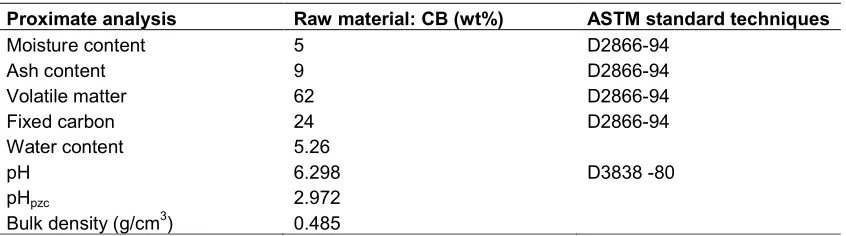
preparation of activated carbons from bitter kola nut shell appears to be an alternative method to valorize it, and thus reduce environmental pollution. To the best of our knowledge, no study has been reported on the preparation of ACs from bitter kola nut shell. The present study has been motivated by the fact that bitter kola nut shell has a low value of ash content (9%) and a high volatile matter percentage (62%). It is thus a potential new precursor for the production of ACs.
The aim of the present work was to study the characteristics of chemically activated carbons (with H3PO4, KOH and ZnCl2 as activating agents) obtained from bitter kola nut shells. The changes in structural morphology, chemical and physical properties of raw material and its obtained ACs have also been investigated. The surface functional groups, surface morphology constituents were analyzed by FTIR, TGA and SEM. The acidic or basic surface behavior was
determined using Boehm titration and pHzpc. The influence of impregnation ratio and carbonization temperature is also reported herein.
2. MATERIALS AND METHODS
2.1 Preparation of Garcinia kola Shell
Adsorbents
Garcinia kola nut shell were collected from the field in the Manjo subdivision, located in the Mungo Division, Littoral Region of Cameroon. The raw material was carefully washed with tap water and rinsed with distilled water to eliminate impurities. It was then dried under sunlight for one month and dried in an oven at 105°C for 72 h to remove excess or residual water. The dried raw materials were mechanically crushed and sieved to obtain particle size ranging between 250-1000 μm.
2.2 Preparation of Activated Carbons by Chemical Activation
The preparation of activated carbons from
Garcinia kola nut shell was performed through a
one-step chemical activation process. The impregnation ratio (IR) was determined as the ratio of the weight of activating agents (W) to the weight of the dried bitter kola nut shell (Wraw) [13].
raw W
W
IR (1)
Following cooling at room temperature, the calcinated samples were ground in a mortar and pestle, and washed several times with distilled water to remove the residual chemical agents until a pH value of the resulting water was neutral. The various activated carbons thus obtained (CBH, CBK, CBZ) were dried for 24 hours in an oven set at 105°C. The resulting products were crushed into powder and well-kept for further tests. The ACs obtained were characterized by the determination of their iodine number for optimal impregnation ratio and optimal temperature of H3PO4, KOH and ZnCl2 activation. The proximate analysis of the Garcinia kola nut shell was determined according to standard techniques ASTM D2866-94 [11], and the results are provided in Table 1.
2.3 Activated Carbon Yield and Burn-off
The activated carbons (ACs) yield and burn-off were calculated using the formulae:
100
0
x W W
Yield charbon (2)
100
0 0
x W
W W off
Burn charbon (3)
W0 = weight of raw material impregnated (g)
Wcharbon = weight of activated carbon obtained after calcination (g)
2.4 Characterization of Garcina kola Nut
Shell and Obtained ACs
2.4.1 Proximate analysis
The proximate analysis of activated carbon is used to determine the distribution of products
obtained when the carbon samples are heated under specific conditions.
2.4.1.1 Moisture content and water content
The moisture content of AC samples were determined using the standard test method ASTM D2867-95 [14]. For this test, 5 g of the precursor were weighed and placed in a clean dry porcelain crucible of known mass. The crucible was heated at 105°C for 2 h in an oven. The weights of the sample before heating and after heating (and cooling in desiccators) was determined in order to calculate the moisture contents of the samples. The moisture and water content were calculated using equation (4) and (5):
100 (g) weight sample Initial
(g) drying on in weight Loss
(%) x
content
Moisture
(4)
100 ) ( (g) drying on in weight Loss
(%) x
g dried carbon activated of Weight content
Water
(5)
2.4.1.2 Ash content
The ash content of the activated carbon samples was determined using standard test method ASTM D2866-94. To determine the ash content, a porcelain crucible was pre-heated in the furnace at about 500°C for 1 h, then cooled in a desiccator and weighed. Then 1.0 g of activated carbon was transferred into the crucibles and heated at 500°C for 2 h. The crucible and its content were cooled to room temperature in a desiccator and reweighed. The ash content was calculated using equation 6.
100 (g) dry weight Oven
(g) Ash weight
(%) x
content
Ash (6)
Table 1. Proximate analysis of the raw material
Proximate analysis Raw material: CB (wt%) ASTM standard techniques
Moisture content 5 D2866-94
Ash content 9 D2866-94
Volatile matter 62 D2866-94
Fixed carbon Water content pH
pHpzc
Bulk density (g/cm3)
24 5.26 6.298 2.972 0.485
D2866-94
2.4.1.3 Volatile matter and fixed carbon content
With the aim to determining volatile matter, 1.0 g of sample was put into a crucible pre-heated in the furnace to about 500°C for 1h and of known weight. The crucible and its content were then
placed in a furnace regulated at 500°C for 2 h. After heating, the crucible is quickly
covered, cooled in desiccator to ambient temperature and weighed. The percentage of volatile matter was calculated as indicated in equation (7):
100 )
( ) (
(%) x
g weight dry Oven
g component volatile
of Weight matter
Volatile
(7)
The fixed carbon content of the activated carbon samples were calculated using equation 8.
volatilematter moisturecontent Ashcontent
carbon Fixed
% %
% 100
(%)
(8)
2.4.2 Bulk density
In order to determine the bulk density, an empty measuring cylinder was weighed. It was then filled with the prepared sample of AC and gently tapped during 10 min until no change in the level of the sample was observed. The volume occupied by the packed sample was recorded (Vs = 25cm3). Let Wc be the weight of the empty cylinder and W the weight of the cylinder and its contained sample, the weight of the sample Ws was obtained through the operation WS=W-WC and the bulk density was calculated using equation (9):
3
25cm W
d S
app (9)
Ws = weight of the sample (g) dapp = bulk density (g/cm3)
2.4.3 Determination of pH
In order to determine the pH values of activated carbon samples, the standard test method ASTM-D3838-80 was used. 100 mg sample of each AC was transferred into 30 mL of distilled water in a flask. The container was sealed and placed on an agitator for 24 h at room temperature. The pH value was then measured using pH meter (pHS-25).
2.4.4 Determination of pHzpc
The pH value of the zero charge point, pHzpc corresponds to the pH at which the net surface charge is zero. pHzpc of the activated carbon samples were estimated according to standard procedure [15]. The pHzpc of AC sample was determined by adding 0.1 g of each material to a 30 mL solution of 0.1 M NaCl whose initial pH had been measured and adjusted with 0.1 M NaOH or 0.1 M HCl to between 2, 4, 6, 8, 10, and 12. The containers were sealed and placed on an agitator for 24 hours at ambient temperature, after which the final pH value (pHfinal) was measured. The pHzpc being the point where the curve pHfinal versus pHinitial intercepts the line pHfinal = pHinitial.
2.4.5 Determination of iodine number
The iodine number is the most fundamental parameter used to measure the AC performance in terms of activity [16]. The iodine number was
measured according to the procedure
established by the American Society for Testing and Materials (ASTM D2866-94) [11]. Iodine number was employed in this study as a test for micro porosity via volumetric analysis. 0.1 g of AC was mixed with 30 mL of 0.02 N iodine solution, stirred for 3 ho and then the contents filtered. 10 mL of the filtrate was titrated against 0.005 N sodium thiosulphate solution using starch as indicator until a clear solution was observed. The remaining iodine in the solutions was calculated using equation 10.
NaI O
S Na I O
NaS 2
2 2 3 2 2 4 6 (10)
2.4.6 Methylene blue number
The methylene blue (MB) is the maximum amount of dye adsorbed on 1.0 mg of adsorbent [17]. The Methylene blue number (QMB) of our ACs was measured according to the standard accepted methods.
m V C C
Q e
MB
)
( 0
(11)
where: m = mass of activated carbon (g); V = volume of test solution (L); C0=initial
concentration of MB (mg/L) and Ce =
concentration of MB at equilibrium (mg/L).
Following the estimation of methylene blue number (mg/g), the relative surface area of methylene blue (SMB, m
2
/g) was calculated using equation 12.
MB A MB MB
M N S Q
S . . (12)
NA: Avogadro’s number; S: cross sectional area, which is taken as 120 Å2 for MB; QMB: Methylene blue number; MMB: molar mass of MB.
2.4.7 Determination of surface functional groups
The surface functional groups containing oxygen were determined using Boehm titration [18,19]. 0.1 g of AC was added to 25 mL of 0.1 M of the following solutions: sodium hydroxide (NaOH),
sodium carbonate (Na2CO3), and sodium
bicarbonate (NaHCO3) for acidic groups and 0.1 M HCl for basic groups. The samples were shaken for 48 h at room temperature and then filtered to separate the ACs from solution. Subsequently, the aqueous solutions were back-titrated with HCl (0.1 M) for acidic and NaOH (0.1 M) for basic groups both in presence of phenolphthalein as indicator [11]. The number and type of acidic sites were calculated by considering that NaOH neutralizes carboxylic, lactonic and phenolic groups, Na2CO3 neutralizes carboxylic and lactonic groups and that NaHCO3 neutralizes only carboxylic groups [11]. The number of basic sites was calculated by titration with HCl that reacted with ACs. In order to neutralize basic groups remaining HCl in the solution was back-titrated with 0.1 M NaOH.
2.4.8 Thermogravimetric analysis (TGA)
Thermogravimetric analysis (TGA/DSC) is used to measure the mass changes of a sample with linearly increasing temperature [20]. Thermal behavior of Garcinia kola nut shell were investigated from the thermograms (TGA/DSC) obtained by LINSEIS STA PT-1000 thermal
gravimetric analyzer (Laboratory of
Physicochemistry of Materials, University of
Yaoundé I). The samples were heated from 25-1000°C with a heating rate of 10°C/min, under ambient atmosphere in order to determine the general decomposition characteristics of the biomass source during the activation and appropriate carbonization temperature for the production of AC.
2.4.9 Fourier transform infra-red
Adsorbents were characterized by Fourier Transform Infra-red Spectroscopy to identify the functional groups and chemical bonding on their structure. The FTIR was recorded in the wave number range from 4000 cm-1-500 cm-1 using Nicolet iS5 FTIR Spectrometer.
2.4.10 Scanning electron microscopy (SEM)
Scanning electron microscopy was used to identify the surface morphology of raw material and activated carbons. SEM of AC and raw material have been determined by sputter coater analysis.
2.4.11 Powder X-ray diffraction (XRD) study
Crystallinity and amorphous structure of the raw material and prepared activated carbons were determined by X-ray diffraction analysis using a STOE Stadi-p X-ray powder diffractometer (STOE & Cie GmbH, Darmstadt, Germany), with Cu Kα1 radiation (40 kV, 30 mA and λ=1.54056 Å). The diffraction angle was varied from 0° to 70°. The X-ray diffraction patterns were collected with scan rate of 5°/min.
3. RESULTS AND DISCUSSION
3.1 The Physicochemical
Characteri-zation
The physical properties of raw materials are reported in Table 1. An observation of the pH value recorded in that table shows that the surface of raw material is primarily acidic. The 9% ash content obtained in this study, which is lower than the norm (10%) [21] reveals that
Garcinia kola nut shell is suitable as AC
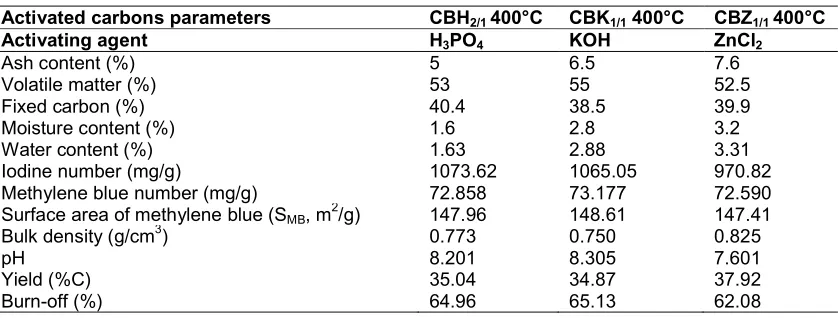
CBZ1/1 have high carbon content, low mineral content or inorganic residue with low water content. The ash content of the samples varies between 5 and 7.6% thus lower than 10% and indicates that the materials contained mainly organic matter. It is concluded from data in Table 2 that all ACs have a low ash content, which means an increase in the fixed carbon value. The American Water Work Association has set 0.25 g/cm3 as the lower limit on the bulk density for AC if it has to be of practical use [4]. The bulk densities of the prepared ACs given in Table 2 satisfy this condition i.e. are higher than the said limit. Indeed, higher density provides greater volume activity and normally indicates better quality AC [8]. The moisture contents of the prepared ACs are also reported in Table 2. Their values 1.6%; 2.8% and 3.2% respectively obtained for CBH2/1; CBK1/1 and CBZ1/1 are within the norm, since the traditional value of the water content varies between 1 to 5% by mass. Studies have shown that lower moisture content increases the rate of adsorption of contaminants [8]. It is evident from Table 2 that all ACs have good iodine numbers. The same table shows that the methylene blue numbers of the three ACs are high. The values obtained reveal that the ACs equally possess mesopore sizes.
3.2 Effect of Temperature on Yield and Burn-off
The carbonization temperature is a factor that is usually taken into consideration because of inter-dependence with all other properties of the
carbon [22]. The activation temperature
determines the devolatilization and activation reaction rates of the carbon. The carbonization temperature plays a significant role in the activated carbon yield and burn-off. Fig. 1 shows
the percentage yield and burn-off of activated
carbons as a function of carbonization
temperature. From this figure, it is found that the
yield of activated carbons decreased
continuously with increasing carbonization
temperature. This is due to the loss of most of the volatile matter. The samples also exhibited a reasonable yield of 38% at 400°C, which shows the presence of carbon content. The raw materials and activation methods have an influence on the yield. However, yields are affected by various parameters such as weight ratio of Garcinia kola nut shell to activation agent, activation temperature and time of calcination and activation. The decrease in yield at high temperature may be due to the release of oxygen and hydrogen as CO, CO2 and CH4 from lignocellulosic materials rather than H2O [23]. These results perfectly agree with those obtained by Ndi et al. [5].
Furthermore, it is observed from Fig. 1 that, when yield decreases, burn-off of activated
carbons increases, with carbonization
temperature increasing. The burn-off occurred due to the steam reforming reaction of char, forming carbon monoxide and hydrogen. The increasing burn-off degree observed in the three curves depended on the temperature and leads to micropore widening. This observation is in agreement with the results reported by other researchers [5].
3.3 Effect of Temperature on the Iodine Number
The carbonization temperature is one of the most
influential factors that govern porosity
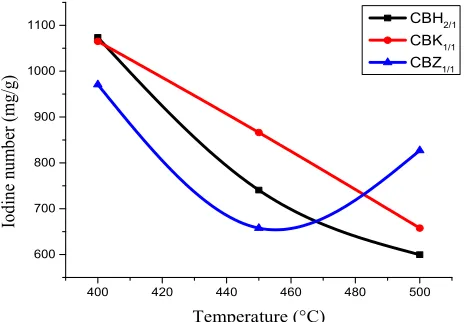
development during the activation process [24]. Fig. 2 shows that the iodine number of ACs
Table 2. Physicochemical characterization of ACs (CBH2/1; CBK1/1; CBZ1/1)
Activated carbons parameters CBH2/1 400°C CBK1/1 400°C CBZ1/1 400°C
Activating agent H3PO4 KOH ZnCl2
Ash content (%) 5 6.5 7.6
Volatile matter (%) 53 55 52.5
Fixed carbon (%) 40.4 38.5 39.9
Moisture content (%) 1.6 2.8 3.2
Water content (%) 1.63 2.88 3.31
Iodine number (mg/g) 1073.62 1065.05 970.82
Methylene blue number (mg/g) 72.858 73.177 72.590
Surface area of methylene blue (SMB, m2/g) 147.96 148.61 147.41
Bulk density (g/cm3) 0.773 0.750 0.825
pH 8.201 8.305 7.601
Yield (%C) 35.04 34.87 37.92
Fig. 1. Effect of carbonization temperature on the Yield and Burn-off
decreased when the carbonization temperature increased in the range 400-500°C. An increasing carbonization temperature results in a decrease of the microporosity of the AC samples and consequently decreases the adsorption capacity of the ACs. As the iodine number decreases, there is a decrease in porosity of ACs. The maximum values of iodine number obtained herein are at 400°C for CBH2/1, CBK1/1 and CBZ1/1. The highest values of iodine number for ACs obtained at 400°C were attributed to the presence of a large micropore structure and to the high probability of carbons having a large surface area due to enlargement of their pore structure [10]. Similar results and conclusions have been obtained by Ndi et al. [5] and Ajifack et al. [21]. However, the increase iodine number for CBZ1/1 from 450 to 500°C indicates the development of micropores, because an increase in temperature increases distillation of tar from
the carbon, which in turn releases some pores for adsorption of iodine.
3.4 Thermogravimetric (TGA) Analysis
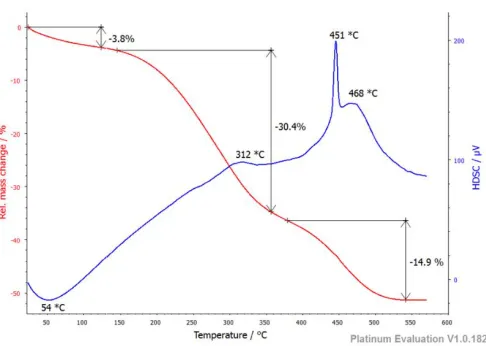
The thermal behavior of Garcina kola nut shell was evaluated by TGA in ambient atmosphere. The curve obtained is presented in Fig. 3. This figure presents three weight loss stages. The first stage from 0 to 145°C shows a weight loss of 3.8% with an endothermic decomposition peak at 54°C in DSC that can be attributed to dehydration, removal of moisture and volatile contents. The second stage from (150-360°C) leading to an exothermic decomposition peak at 312°C in DSC shows a 30.4% weight loss, due
to the decomposition of cellulose and
hemicelluloses in CB [25] and some volatile matters and decomposition of pectins. The third stage is observed between 380 and 540°C
400 420 440 460 480 500
600 700 800 900 1000 1100
Iod
ine num
b
er (mg/
g)
Temperature (°C)
CBH2/1 CBK1/1 CBZ1/1
Fig. 2. Effect of carbonization temperature on the iodine number
400 420 440 460 480 500
24 26 28 30 32 34 36 38 40
Yield
(
%
)
Temperature (°C)
CBH2/1 CBK1/1 CBZ1/1
400 420 440 460 480 500
62 64 66 68 70 72 74 76
Bu
rn-off (%)
Temperature (°C) CBH2/1
and causes a weight loss of 14.9%, with two exothermic decomposition peaks observed in the DSC curve at 451°C and 468°C. The maximum exothermic decomposition peak is obtained at 451°C. At this temperature range (380
aromatization takes place (around 400°C). The weight losses in this temperature range are attributed to the formation of graphitic layers and decomposition of lignin component of CB. Thermogravimetric (TGA) analysis reveals that carbonization of CB occurs around 400°C. Similar results were obtained by Ahmad et al. [10].
3.5 FTIR Spectra
FTIR spectroscopy was used to determine the various functional groups present on
kola nut shell powders and the ACs prepared
from these raw materials with different
impregnation solutions. The spectra obtained are presented in Fig. 4. Between 3500
and at 3349 cm-1, a broad and strong intense band attributable to the stretching vibration of the hydroxyl group (OH) and adsorbed water is observed. The small absorption band at 2922 cm-1 is attributable to symmetric - CH
stretching groups. The stretching vibration band at 1637 cm-1 can be associated to the carbonyl and carboxylate group C=O. At 1559 cm stretching band associated with C=C in the aromatic ring [24] is observed. The region around 1450 cm-1, corresponds to bending vibration of O-H or C-O groups of alcohols or carboxylic groups. The band around 1374 cm
-to the C-H bending vibration or stretching vibration of aliphatic nitro compounds (
Fig. 3. Thermogravimetric (TGA) analysis (TGA/DSC) of and causes a weight loss of 14.9%, with two
exothermic decomposition peaks observed in the 468°C. The maximum exothermic decomposition peak is obtained at 451°C. At this temperature range (380-540°C) aromatization takes place (around 400°C). The weight losses in this temperature range are attributed to the formation of graphitic layers and position of lignin component of CB. Thermogravimetric (TGA) analysis reveals that carbonization of CB occurs around 400°C. Similar results were obtained by Ahmad et al.
FTIR spectroscopy was used to determine the oups present on Garcina nut shell powders and the ACs prepared
from these raw materials with different
impregnation solutions. The spectra obtained are presented in Fig. 4. Between 3500 - 3000 cm-1
, a broad and strong intense ributable to the stretching vibration of the hydroxyl group (OH) and adsorbed water is observed. The small absorption band at 2922 CH2 and -CH3 stretching groups. The stretching vibration band
ted to the carbonyl and carboxylate group C=O. At 1559 cm-1 the stretching band associated with C=C in the aromatic ring [24] is observed. The region around , corresponds to bending vibration of O groups of alcohols or carboxylic -1 corresponds
H bending vibration or stretching vibration of aliphatic nitro compounds (–NO2).
The band around 1264 cm-1 is attributable to the C-O stretching vibration of aryl group of lignin. The band at 1036 cm-1 is associated with C stretching vibration of carboxylic acids, alcohols, ester, and ether. Between
500-observed the small absorption band attributed to stretching vibration C-X of halogeno
and C-H bending vibration or C=C aromatic polynuclear system.
The spectra of different AC CBH2/1
CBZ1/1 pre-treated with different impregnation solutions are different from that of the raw material in the fact that many bands disappeared during the activation and carbonization stages. Indeed, the reduction in the intensities of the broad band around 3349 cm
disappearance of the band at 1036 cm attributed to the disappearance of H after activation. The band at 2922 cm
the IR spectrum of the raw material disappears in the ACs due to the decomposition of the surface functions during pyrolysis. This disappearance indicates decomposition of functional groups present in oxygenated hydrocarbons, reflecting the carbohydrate structure of cellulose and hemicellulose [9,26]. A Similar phenomenon was observed for bands at 1316 cm-1, 1243 cm 1158 cm-1 in CBH2/1, CBK1/1 and CBZ
that a chemical transformation occurred. The stretching absorption band at 1637 cm observed from the raw material associated to the carbonyl C=O group is absent in the ACs, indicating that the chemical activation led to the breakage of many bonds in aliphatic and aromatic species and the elimination of many volatile and light substrates [27].
Fig. 3. Thermogravimetric (TGA) analysis (TGA/DSC) of Garcinia kola nut shell (CB) is attributable to the O stretching vibration of aryl group of lignin. is associated with C-O stretching vibration of carboxylic acids, alcohols, -600 cm-1 we observed the small absorption band attributed to X of halogeno-alkane [5] H bending vibration or C=C aromatic
2/1, CBK1/1 and treated with different impregnation solutions are different from that of the raw material in the fact that many bands disappeared carbonization stages. Indeed, the reduction in the intensities of the
broad band around 3349 cm-1 and the
disappearance of the band at 1036 cm-1, can be attributed to the disappearance of H2O molecules after activation. The band at 2922 cm-1 present in IR spectrum of the raw material disappears in the ACs due to the decomposition of the surface functions during pyrolysis. This disappearance indicates decomposition of functional groups present in oxygenated hydrocarbons, reflecting ture of cellulose and hemicellulose [9,26]. A Similar phenomenon was , 1243 cm-1 and and CBZ1/1 indicating that a chemical transformation occurred. The
stretching absorption band at 1637 cm-1
ved from the raw material associated to the carbonyl C=O group is absent in the ACs, indicating that the chemical activation led to the breakage of many bonds in aliphatic and aromatic species and the elimination of many volatile and light substrates [27]. The band
obtained approximately at 1587 cm-1 in the three ACs, indicates the presence of C=O stretching vibration of lactone and carbonyl groups [28]. This band can also be attributed to the C=C stretching vibration of alkene or aromatic ring. The shift, absence, or presence of bands in ACs also signifies that the samples reacted differently with the various activating agents [21].
3.6 Boehm Titration Results
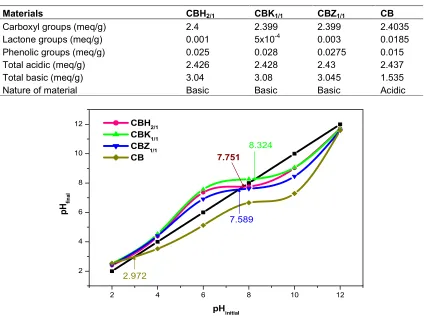
Boehm titration was used to characterize the oxygen functional groups of the raw material (CB) and ACs (CBH2/1, CBK1/1 and CBZ1/1). From
Table 3, the quantities of the acidic and basic surface functional groups determined can
be compared. It can be observed that the total of basic groups is higher than the total of
acidic groups from the three ACs (CBH2/1, CBK1/1 and CBZ1/1), while the surface total of acidic groups is larger than the total of basic groups in the raw material (CB). The abundance of basic groups in CBH2/1, CBK1/1 and CBZ1/1 is clearly due to the chemical reaction that took place during the heating of the impregnated raw material.
3.7 pHzpc
The pHzpc is the pH where the adsorbent net surface charge corresponds to zero. It offers the possible mechanism for the electrostatic
interaction between adsorbent and adsorbate. The significance of the pHzpc value of a given activated carbons surface is that it will have a positive charge in solution with pH less than their pHzpc and will thus easily adsorb anion. On the other hand, if the pH value of the solution is higher than the pHzpc value of the ACs, the carbon surface will be negatively charged, and will easily absorb cations [16]. The pHzpc values obtained for each AC and raw material (shown in Fig. 5) are coherent with the quantification of the surface functional groups obtained by the Boehm method. In this Figure we observed the values: pHzpc (CBH2/1) = 7.751; pHzpc (CBK1/1) = 8.324; pHzpc (CBZ1/1) = 7.589 and the pHzpc (CB) = 2.972.
3.8 Scanning Electron Microscopy (SEM)
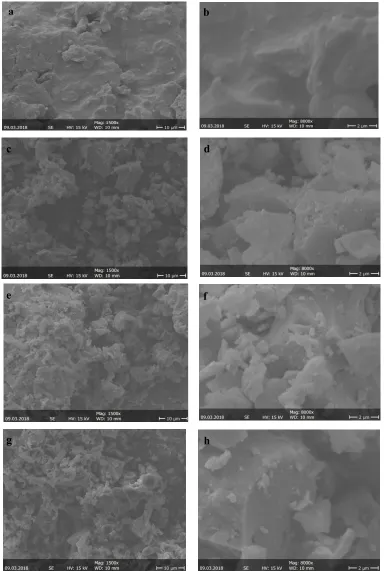
The impregnation ratios of different activating agents (H3PO4, KOH and ZnCl2) and final carbonization temperature are effective in creating well-developed pores on the surface of the activated carbons [29]. In the chemical activation process, new pores are formed due to the reaction between carbon and the activating agents [29]. The SEM images of CB at the operating conditions with 1500 and 8000 magnification are presented in Fig. 6(a & b). The SEM images of ACs (CBH2/1, CBK1/1 and CBZ1/1) developed at 400°C at the operating condition magnified at 1500 and 8000 are also presented
Fig. 4. FTIR spectra of Garcinia kola nut shell (CB) and ACs (CBH2/1, CBK1/1 and CBZ1/1)
4000 3500 3000 2500 2000 1500 1000 500
0,00 0,02 0,04 0,06 0,08 0,10 0,12 0,14 0,16 0,18 0,20
Absorb
ance
Wavenumber (Cm-1) CBZ1/1
CBK1/1
CBH2/1
Table 3. Boehm titration for the determination of oxygen surface functional groups of carbon samples and raw materials
Materials CBH2/1 CBK1/1 CBZ1/1 CB
Carboxyl groups (meq/g) 2.4 2.399 2.399 2.4035
Lactone groups (meq/g) 0.001 5x10⁻⁴ 0.003 0.0185
Phenolic groups (meq/g) 0.025 0.028 0.0275 0.015
Total acidic (meq/g) 2.426 2.428 2.43 2.437
Total basic (meq/g) 3.04 3.08 3.045 1.535
Nature of material Basic Basic Basic Acidic
Fig. 5. Graph for the determination of pHzpc for CBH2/1, CBK1/1, CBZ1/1 and CB
in Fig. 6(c & d); 6(e & f) and 6(g & h), respectively. There are significant differences between the surface morphology of the Garcinia kola nut shells and that of the prepared ACs. an observation of Fig. 6(a & b) reveals that the surface of CB of raw material is moderately smooth, very rough and has few pores or voids on the surface. Fig. 6(c & d); 6(e & f) and 6(g & h) displaying SEM images of prepared ACs CBH2/1, CBK1/1 and CBZ1/1 respectively, illustrates an irregular and heterogeneous surface morphology with a developed and fragmented porous structure in various sizes. The pores exhibited by CBH2/1, CBK1/1 and CBZ1/1 are honeycomb like in shape and are not clearly visible on the surface. However, it can be seen from the micrographs that the external surface of the ACs has cracks and crevices. These pores result from the evaporation of the chemical reagents (H3PO4, KOH and ZnCl2) during carbonization, leaving empty spaces [28], but also due to the breakdown of the
lignocellulosic material at carbonization
temperature (400°C) followed by removal of volatile matters leaving samples with developed pores.
3.9 X-ray Diffraction (XRD) Analysis
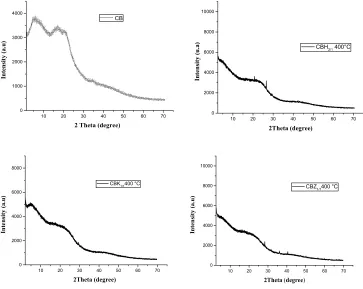
The results of powder X-ray diffraction obtained for CB, CBH2/1, CBK1/1 and CBZ1/1 are presented in Fig. 7. As concerning the Garcinia kola nut shell, the existence of two broad peaks indicates that the material is amorphous. The absence of a sharp peaks reveals that all ACs prepared from CB are mainly amorphous. The amorphous nature of our ACs is an advantageous property for well-defined adsorbents. However the small sharp peak presented by the X-ray graphs of CBH2/1 (2θ = 27°) and CBZ1/1 (2θ = 28°) indicate a very low crystallinity on these ACs resulting from better layer alignment [29]. In addition, the small sharp peaks of CBZ1/1 are due to the presence of zinc oxide and zinc carbide [2].
2 4 6 8 10 12
2 4 6 8 10 12
2.972
7.589
8.324 7.751
p
H fi
na
l
pHinitial
Fig. 6. SEM of samples: (a & b) Garcinia kola nut shell (CB); (c & d) CBH2/1, (e & f) CBK1/1 and (g & h) CBZ1/1 ACs prepared at 400°C of carbonization temperature
a
b
c
d
e
f
Fig. 7. XRD of samples: Garcinia kola nut shell (CB); CBH2/1, CBK1/1 and CBZ1/1 ACs prepared at 400°C of carbonization temperature
4. CONCLUSION
Chemical activation is one of the appropriate methods to obtain new ACs. In the present study, ACs with developed pore structure were prepared from Garcinia kola nut shell by
chemical activation with phosphoric acid,
potassium hydroxide and zinc chloride. The present investigation revealed that when the carbonization temperature increased, iodine number decreased. The maximum iodine number was obtained at a carbonization temperature of 400°C for a period of 1 h, and impregnation ratios of 2/1 for CBH and 1/1 for CBK and CBZ. However, the yield of activated carbons
decreased as carbonization temperature
increased. The Boehm titration and pHzpc showed that the three new activated carbons have a basic character. XRD analysis showed that the raw material and ACs prepared are mainly amorphous. SEM images showed an irregular and heterogeneous surface morphology with a developed and fragmented porous structure in various sizes. The pores exhibited
are honeycomb like in shape and are not clearly visible.
ACKNOWLEDGEMENTS
We grateful acknowledge technical assistance rendered by the researchers of Material and Process Engineering Team (MPET)/RU-NOGEE of the Department of Chemistry, Faculty of Science of the University of Dschang, Cameroon and The World Academy of Sciences (TWAS).
COMPETING INTERESTS
Authors have declared that no competing interests exist.
REFERENCES
1. Das D, Samal DP, Meikap BC. Preparation
of Activated Carbon from Green Coconut Shell and its Characterization. J. Chem. Eng. Process. Technol. 2015;6(5):1.
10 20 30 40 50 60 70 0
1000 2000 3000 4000
In
tensity (a.u)
2 Theta (degree)
CB
10 20 30 40 50 60 70
0 2000 4000 6000 8000 10000
Intensity (u.a)
2Theta (degree)
CBH2/1 400°C
10 20 30 40 50 60 70 0
2000 4000 6000 8000
Int
e
nsity (a.u)
2Theta (degree)
CBK1/1400 °C
10 20 30 40 50 60 70 0
2000 4000 6000 8000 10000
In
tensity (a.u)
2Theta (degree)
2. Danish M, Hashim R, Mohamed Ibrahim MN, Sulaiman O. Effect of acidic activating agents on surface area and surface functional groups of activated carbons produced from Acacia mangium wood. J. Anal. Appl. Pyrolysis. 2013;104:418. 3. Ozdemir I, Ahin MS, Orhan R, Erdem M.
Preparation and characterization of
activated carbon from grape stalk by zinc chloride activation. Fuel Process. Technol. 2014;125:200.
4. Tchuifon TDR, Anagho SG, Nche GN,
Ketcha JM. Adsorption of salicylic and sulfosalicylic acid onto powdered activated carbon prepared from rice and coffee husks. Int. J. Curr. Eng. Technol. 2015;5: 1641.
5. Ndi NJ, Ketcha MJ, Anagho GS, Ghogomu
NJ, Belibi EP. Physical and chemical
characteristics of activated carbon
prepared by pyrolysis of chemically treated Kola nut (Cola acuminata) Shell wastes and its ability to adsorb organics. Int. J. Adv. Chem. Technol. 2014;3:1.
6. Xua J, Chena L, Qua H, Jiao Y, Xiea J, Xing G. Preparation and characterization of activated carbon from reedy grass leaves by chemical activation with H3PO4. Appl. Surf. Sci. 2014;320:674.
7. Arvind K, Hara MJ. Preparation and
characterization of high surface area activated carbon from Fox nut (Euryale ferox) shell by chemical activation with H3PO4. Results Phys. 2016;6:651.
8. Rhoda HG, Ideyonbe O. Production of
activated carbon and characterization from Snail Shell Waste (Helix pomatia). Adv. Chem. Engineer. Sci. 2015;5:51.
DOI:http://dx.doi.org/10.4236/aces.2015.51 006
9. Nasri NS, Basri H, Garba A. Synthesis and
characterization of low-cost porous carbon from palm oil shell via K2CO3 chemical activation process. Appl. Mech. Mater. 2015;735:36.
10. Ashfaq Ahmad A, Al-Swaidan HM,
Alghamdi HA. Production of activated carbon from Raw Date Palm Fronds by ZnCl2 activation. J. Chem. Soc. Pak. 2015; 37(6):1081.
11. Ekpete OA, Horsfall MJ. Preparation and
characterization of activated carbon
derived from fluted pumpkin stem waste (Telfairia occidentalis Hook F). Res. J. Chem. Sci. 2011;1(3):10.
12. Chukwudi TO, Ifeanyi TN, Ogbonna O,
Tochukwu JO, Chukwuma OA,
Chukwuemeka CM, Charles OE,
Comparative Adsorption of Spiramycin on Veegum. Activated Charcoal and Garcinia kola Heckel (Guttiferea) Seed. Trop. J. Pharm. Res. 2015;14(3):379.
13. Yorgun S, Vural N, Demiral H. Preparation of high-surface area activated carbons from Paulownia wood by ZnCl2 activation.
Microporous Mesoporous Mater.
2009;122: 189.
14. Annual Book of ASTM Standards,
Standard Test Method for Moisture in
Activated Carbon. ASTM D2867-95,
Philadelphia PA United State of America. 2004;709-711.
15. Lopes-Ramon MV, Stoeckli F,
Moreno-Castilla C, Carrasco-Marin F. On the characterization of acidic and basic surface sites on carbons by various techniques. Carbon. 1999;37:1215.
16. Mohammed Danish, Rokiah Hashim,
Mohamad Ibrahim, Mohd Rafatullah,
Tanweer Ahmad, Othman Sulaiman.
Characterization of Acacia mangium wood based activated carbons prepared in the presence of basic activating agents. Bioresour. 2011;6(3):3019.
17. Rinita Rajbhandari Joshi. Optimization of conditions for the preparation of activated
carbon from lapsi (Choerospondias
axillaris) seed stone using ZnCl2. J. Inst. Eng. 2015;11(1):128.
18. Boehm HP. Chemical identification of
surface groups. Adv. Catal. 1966;16:179. 19. Boehm HP. Some aspects of the surface
chemistry of carbon blacks and other carbons. Carbon. 1994;32:759.
20. Djilani C, Zaghdoudi R, Modarressi A, Rogalski M, Djazi F. Elimination of organic micropollutants by adsorption on activated carbon prepared from agricultural waste. Chem. Eng. J. 2012;189-190:203.
DOI:https://doi.org/10.1016/j.cej.2012.02.0 59
21. Ajifack DL, Ghogomu JN, Ndi JN, Ketcha JM. Dynamics and equilibrium studies of the Adsorption of Cu (II) from aqueous solutions by activated Hibiscus sabdariffa. L. Stalk Biomass. Int. J. Eng. Res. Technol. 2015;4:655.
22. Ekpete OA, Marcus AC, Osi V. Preparation
and characterization of activated carbon obtained from plantain (Musa paradisiaca) Fruit Stem. J. Chem. 2017;1.
23. Marsh H, Rodriguez-Reinoso F. Activated carbon. Elsevier Science & Technology Books, Amsterdam; 2006.
24. 24. Nabais JV, Carrott P, Carrott MM, Luz V, Ortiz AL. Influence of preparation conditions in the textural and chemical properties of activated carbons from a novel biomass precursor: The coffee endocarp. Bioresour. Technol. 2008;99: 7224.
25. Jiang GB, lin ZT, Haung XY, Zehang YQ, Ren CC, Haung CK, Haung ZY. Potential biosorbent based on sugarcane bagasse modified with tetraethylenepentamine for removal of Eosin Y. Int. J. Biol. Macromol. 2012;3(50):707.
DOI: 10.1016/j.ijbiomac.2011.12.030
26. Shamsuddin MS, Yusoff NR, Sulaiman
MA. Synthesis and characterization of
activated carbon produced from kenaf core fiber using H3PO4 activation. Procedia Chem. 2016;19:558.
27. Yagmur E, Ozmak M, Aktas Z. A novel method for production of activated carbon from waste tea by chemical activation with microwave energy. Fuel. 2008;87: 3278.
28. Deng H, Zhang G, Xu X, Tao G, Dai J. Optimization of preparation of activated carbon from cotton stalk by microwave
assisted phosphoric acid-chemical
activation. J. Hazard. Mater. 2010b;182: 217.
29. Arvind K, Hara MJ. High surface area microporous activated carbons prepared from fox nut (Euryale ferox) shell by zinc chloride activation. Appl. Surf. Sci. 2015; 356:753.
_________________________________________________________________________________
© 2018 Idris-Hermann et al.; This is an Open Access article distributed under the terms of the Creative Commons Attribution License (http://creativecommons.org/licenses/by/4.0), which permits unrestricted use, distribution, and reproduction in any medium, provided the original work is properly cited.
Peer-review history: