Abstract—This study proposes a technique for automated detection and diagnosis of stroke lesions based on diffusion-weighted imaging (DWI). The technique consists of several stages which are pre-processing, segmentation, feature extraction, and classification. The proposed analytical framework of this study is based on Fuzzy C-Means (FCM) segmentation, statistical parameters for features extraction and rule-based classification. The three-dimensional (3D) view is developed to enable observing directions of the gained 3D structure along the three axes. The segmentation results have been validated by using Jaccard and Dice indices, false positive rate (FPR), and false negative rate (FNR). The results for Jaccard, Dice, FPR and FNR of acute stroke are 0.7, 0.84, 0.049 and 0.205, respectively. The accuracy for acute stroke is 90% and chronic stroke is 70%, while the sensitivity and the specificity is 84.38% and 83.33%, respectively.
Index Terms—Diffusion-Weighted Imaging (DWI), Segmentation, Fuzzy C-Means, Three-Dimensional Reconstruction
I. INTRODUCTION
TROKE is a major health burden in Malaysia as well as worldwide. It is also one of the top five leading causes of death in Malaysia [1]. National Stroke Association of Malaysia (NASAM) stated that one of six people worldwide will suffer from the stroke in their lifetime and it is the third leading cause of adult disability [2]. Stroke is a clinical symptom that happens when the blood vessel is blocked or burst due to a blood clot. All the oxygen and nutrients supply will be cut off causing a syndrome characterize by rapidly developing symptoms or sign of focal neurologic
Manuscript received January 23, 2017.
N. Mohd Saad is with the Center for Robotics & Industrial Automation (CeRIA) and Faculty of Electronics and Computer Engineering, Universiti Teknikal Malaysia Melaka, Malaysia. (email:[email protected]).
N. S. M. Noor is with theCenter for Robotics & Industrial Automation (CeRIA) and Faculty of Electronics and Computer Engineering, Universiti Teknikal Malaysia Melaka, Malaysia.
(email:[email protected]).
A. R. Abdullah is an Associate Professor and a coordinator with the Center for Robotics & Industrial Automation (CeRIA) and Faculty of Electrical Engineering, Universiti Teknikal Malaysia Melaka, Malaysia. (email:[email protected]).
Sobri Muda is a Professor with the Radiology Department, Fakulti Perubatan dan Sains Kemanusiaan, Universiti Putra Malaysia, Malaysia. (email:[email protected]).
A. F. Muda is with the Faculty for Electronics and Computer Engineering, Universiti Teknikal Malaysia Melaka, Malaysia.
(email:[email protected]).
N. N. S. Abdul Rahman is with the Center for Robotics & Industrial Automation (CeRIA) and Faculty of Electronics and Computer Engineering, Universiti Teknikal Malaysia Melaka, Malaysia.
(email:[email protected]).
dysfunction due to a vascular cause [3]. Urgent treatment is needed to obtain less debilitating of stroke and for better recovery. Detection and diagnosis of brain stroke are the keys to implementing successful therapy and treatment planning. However, the diagnosis is a very challenging task and can only be performed by professional neuroradiologists [4].
Computer Aided Diagnosis (CAD) is needed to assist radiologists in interpreting medical images by using dedicated computer systems to provide a second opinion for clinical validation [5]. Studies on CAD systems and technology show that CAD can help to improve the diagnostic accuracy of radiologists. Today, diffusion-weighted imaging (DWI) of the brain has become common in emergency setting, such that it is considered as a key sequence for stroke imaging, and essential in the proper evaluation of most pathologic conditions [6]. This imaging technique provides high lesion contrast compared to other magnetic resonance image (MRI) sequences [7].
DWI measures diffusion of water molecules within the tissue structure on a pixel basis. Tissues in which water diffusion is reduced can, therefore, be readily detected as a hyperintense on DWI images, which has become the hallmark of detection of recent stroke lesion. Manual detection and segmentation of different tissues are very time-consuming compared to computer-aided techniques [8]. However, automatic image segmentation is still a troublesome issue with larger part of utilization due to the presence of noise and intensity inhomogeneity.
Fuzzy C-Means (FCM) is a popular technique proposed by many researchers for segmentation of medical images [8]. However, because of noises and intensity inhomogeneity, FCM technique fails in producing accurate results. Although, the original FCM algorithm provides superior results for segmenting noise free images, but it’s accuracy is low when the image is corrupted with noises. Therefore, FCM algorithm is modified to improve the segmentation results [9, 10, 11].
The purpose of this research is to develop an automatic method to detect and segment the brain stroke lesions from DWI images and to visualize the brain scan in three-dimensional (3D) view. The ability of MRI scan in converting the 3D brain images into multiple two-dimensional (2D) image slices in a various way may lead to certain necessary information being lost. This problem has attracted researchers to continuously seek towards the 3D reconstruction. The availability of 3D imaging has made disease diagnosis and surgical planning successful, which resulted in saving precious patient lives [12].
The proposed analytical framework of this study is based
Automated Stroke Lesion Detection and
Diagnosis System
N. Mohd Saad, N. S. M. Noor, A.R. Abdullah, Sobri Muda, A. F. Muda and N. N. S. Abdul Rahman
on FCM segmentation technique, statistical parameters for features extraction and rule-based classification. Finally, the performances of the proposed segmentation technique are evaluated based on Jaccard and Dice indices, false positive rate (FPR) and false negative rates (FNR). Acute and chronic stroke lesions have been evaluated through this analysis. For the classification performances, accuracy, sensitivity and specificity are evaluated. The three-dimensional (3D) view of the brain is created to visualize the segmented area of the stroke lesion.
II. METHODOLOGY
A. Proposed Analysis Framework
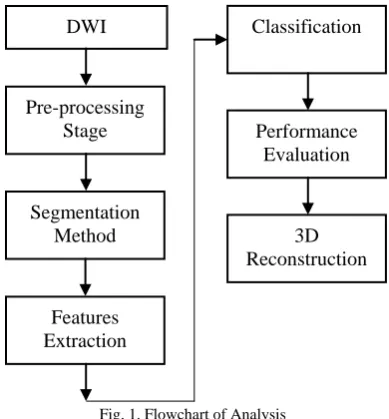
[image:2.595.72.267.310.520.2]Fig. 1 shows the flow process of the proposed analysis framework. The process begins with DWI data collection, followed by pre-processing stage. After that the segmentation is applied to extract the region of interest (ROI) of the lesion. Then, the parameters for features extraction are calculated to be fed as input to a classifier. Finally, three-dimensional (3D) reconstruction is created.
Fig. 1. Flowchart of Analysis
B. Imaging Parameter
The DWI are gained from General Hospital of Kuala Lumpur using 1.5T MRI scanners Siemens Magnetom Avanto. The diffusion-weighted parameters obtained from this scanner are time echo (TE), 94ms; time repetition (TR), 3200ms; pixel resolutions, 256x256; slice thickness, 5mm; gap between each slice, 6.5 mm; of diffusion weighting known as b value, 1000s/ intensity mm2 and total number of slices, 19. The data is encoded in 12-bit DICOM (Digital Imaging and Communication in Medicine) format. The dataset consists of 30 samples of acute stroke and 20 samples of chronic stroke. Overall, 50 images were taken for this analysis.
C. Pre-processing Stage
The pre-processing stage is developed to acquire better segmentation results [13]. Three algorithms are applied which are image normalization, background removal, and image enhancement. Detail descriptions about
pre-processing stage is explained previously in [4].
D. Fuzzy C-Means Segmentation
The flowchart of the proposed FCM segmentation is shown in Fig. 2. The segmentation begins with selecting a data point in three clusters which are the low, middle and high cluster. This algorithm functions by assigning membership to each data point corresponding to each cluster center on the basis of distance between the cluster and the data point. Fuzzy partition works based on minimizing an object function by iteratively updating membership function and cluster centers.
[image:2.595.362.504.406.701.2]The iteration allows the data that belong to two or more clusters with different membership coefficients to become clusters. The process begin with generating the initial fuzzy partition matrix and then calculating the initial fuzzy cluster centers. The cluster centers and the membership grade point in each step of the iteration are updated, and the objective function is minimized to find the best position for the clusters. The process stops when the maximum numbers of iterations is reached, or when the objective function improvement between two consecutive iterations is less than the minimum specified amount of improvement. Morphological operation and correlation template are then utilized to dispense the dissonance in the image after the segmentation process. The details for the proposed segmentation algorithms are discussed in [13].
Fig. 2. Flowchart of FCM Algorithm Start
Input Image
Select 3 cluster center Initialize membership Calculate center vector
Begin iteration
Update membership
Possible number of iterations< ε
Stop
DWI
Pre-processing Stage
Segmentation Method
Features Extraction
Classification
Performance Evaluation
3D Reconstruction
Y
E. Features Extraction
In this work, statistical features analysis in spatial domain are used to quantitatively describe the region pixels. Due to the small number of pixels count in the segmented regions, the calculation involve only one scale representations of the pixels and do not consider any spatial pixel’s dependence. Meanwhile, the differential diagnosis in DWI images is mainly dependent on the signal intensity. Therefore, mode, standard deviation, mean, median and mean boundary are calculated as the parameters from the features for the stroke regions. The equations are given as follows:
Mode
mode (1)
Standard Deviations s2 (2) Mean
N x U
(3)
Median
n 1
thvalue 21
(4)
F. Classification
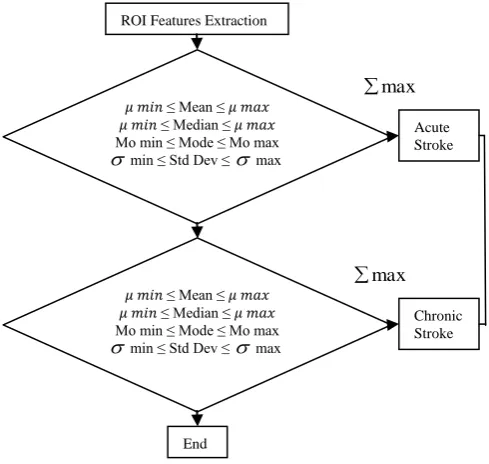
[image:3.595.45.290.408.640.2]The overall process of classification is shown in Fig. 3. Rule-based classification is chosen in this study due to its simplicity for implementation as well as its ability to classify the stroke based on the given features.
Fig. 3. Rule Based Classifier
G. Performance Evaluation
Performance of the segmentation results is evaluated by comparing the results obtained from the analysis with the manual reference image which has been visually inspected by neuroradiologists. Jaccard, Dice, false positive rate (FPR), and false negative rate (FNR) are used as the performance metrics. FPR and FNR are used to quantify over-segmentation and under-segmentation results, respectively. High Jaccard and Dice, and low FPR and FNR
indicate high accuracy of the segmentation results. These metrics are computed by using the following equations [13]:
Jaccard G A G A
100 (5
) Dice G A G A C
100 2 (6
) FPR G A G A C
(7)
FNR G A G AC (8 ) The accuracy, sensitivity and specificity of the stroke classification is evaluated by using the equations as below [13]:
Accuracy 100
sample of number tion classifica correct (9)Sensitivity = TP / (TP+FN) (10)
Specificity = TN / (TN+FP) (11)
The sensitivity of a classification are defined as the probability that a diagnostic test is positive, given that the person has the disease, while the specificity is a probability that a diagnostic test is negative, given that the person does not have the disease. The true positives (TP) is defined as correctly classified positive cases, true negatives (TN) is correctly classified negative cases, false positives (FP) is incorrectly classified negative cases, and false negatives (FN) is incorrectly classified positive cases.
H. Three-Dimensional Reconstruction
[image:3.595.366.499.627.741.2]Three-dimensional (3D) reconstruction is performed to display, analyze the regions and identify the location of the stroke lesions. The 3D images of the brain have unique characteristics and can be viewed in sagittal, frontal and transverse. Fig. 4 shows the flow process for constructing the 3D image of the brain.
Fig. 4. Flowchart of 3D view
Load Input Slide
Segmentation of Stroke Part
3D Representation of Stroke Stroke Detected Slide
ROI Features Extraction
𝜇𝑚𝑖𝑛 ≤ Mean ≤ 𝜇𝑚𝑎𝑥
𝜇𝑚𝑖𝑛 ≤ Median ≤ 𝜇𝑚𝑎𝑥 Mo min ≤ Mode ≤ Mo max
min ≤ Std Dev ≤ max
𝜇𝑚𝑖𝑛 ≤ Mean ≤ 𝜇𝑚𝑎𝑥
𝜇𝑚𝑖𝑛 ≤ Median ≤ 𝜇𝑚𝑎𝑥 Mo min ≤ Mode ≤ Mo max
min ≤ Std Dev ≤ max
The steps are described as below:
Step 1- The brain MRI image slices are loaded using dicomread command.
Step 2- The stroke area present in the input image is automatically detected using the proposed segmentation technique.
Step 3- The brain and stroke slices, which are the output of the segmentation can be represented in the 3D view, which normally helps in finding out the exact shape and size of the stroke.
Step 4- The brain and stroke area is represented in the 3D view.
III. RESULTS
A. Segmentation
The segmentation results of the original image from stroke lesions are shown in Fig. 5. The manual reference images are obtained from [4].
DWI Manual Reference FCM Result
Fig. 5. The segmentation results of the original image from stroke lesion
Table I shows the average performance of the proposed FCM segmentation for 30 samples of acute stroke and 20 samples of chronic stroke. The performance of the algorithm is measured using the metrics such as Jaccard, Dice, FPR and FNR.
TABLE I
PERFORMANCE ANALYSISAND EVALUATION
Index Acute Stroke Chronic Stroke
Jaccard 0.7 0.4 Dice 0.84 0.53 FPR 0.049 0.284 FNR 0.205 0.273
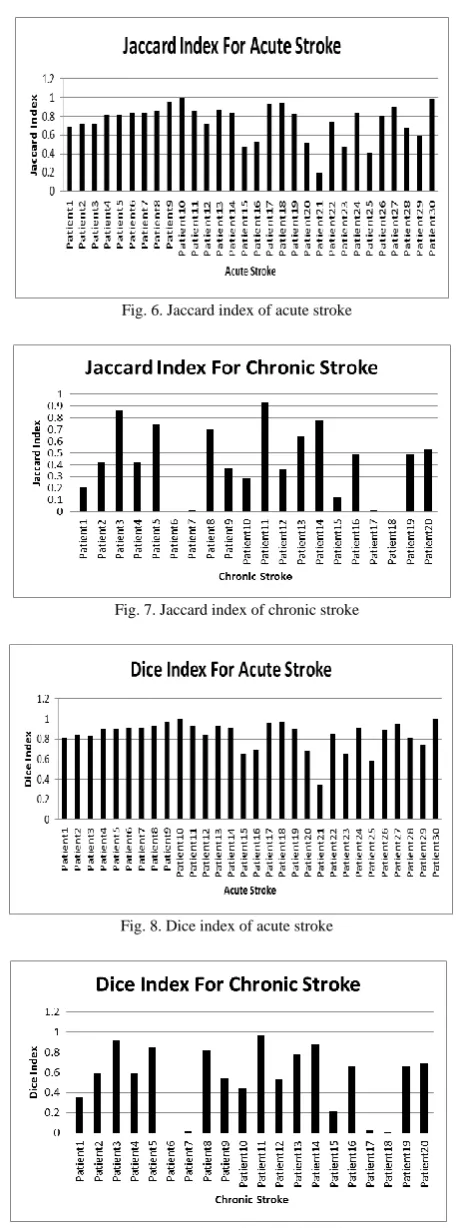
Fig. 6 shows Jaccard index for the segmentation of acute stroke. Overall, 26 out of 30 patients able to achieve the segmentation results of above 0.5. The highest reading is 0.99 while the lowest is 0.41. Fig. 7 shows 7 out of 20 chronic stroke patient having above 0.5 with the highest rate is 0.86.
Fig. 8 and Fig. 9 show the results of Dice index for acute and chronic stroke samples, respectively. The highest index of acute stroke is 0.97 for Patient 9 and 19 while the lowest index is 0.34 for Patient 2. Fig. 9 shows that Dice index of a chronic stroke at the highest rate is Patient 11 with 0.97.
Fig. 6. Jaccard index of acute stroke
Fig. 7. Jaccard index of chronic stroke
[image:4.595.313.542.42.657.2]
Fig. 8. Dice index of acute stroke
Fig. 9. Dice index for chronic stroke
B. Classification
[image:4.595.60.280.294.428.2] [image:4.595.42.298.530.588.2]TABLE II
CONFUSION MATRIX FOR CLASSIFICATION
Predicted
Actual
Acute Stroke Chronic Stroke Acute Stroke 27 3 Chronic Stroke 5 15
From Table II, the accuracy for acute stroke is 90% and for chronic stroke is 75%. The sensitivity of both cases is 84.3% and specificity is 83.33%.
C. Three-Dimensional Reconstruction
[image:5.595.336.515.58.317.2]A proper graphical user interface (GUI) is designed which allow the system is used by simply clicking the buttons. In order to work with the brain images, the user needs to enter the path directory which holds the initial dicom format. After that, the user can view the 3D images, segmentation images and the details parameters of the features extraction. Fig. 10 shows the GUI for the proposed system. Fig. 11 visualized the image slices in axial view.
[image:5.595.45.293.321.619.2]Fig. 10. Main GUI
Fig. 11. The segmented brain outliner
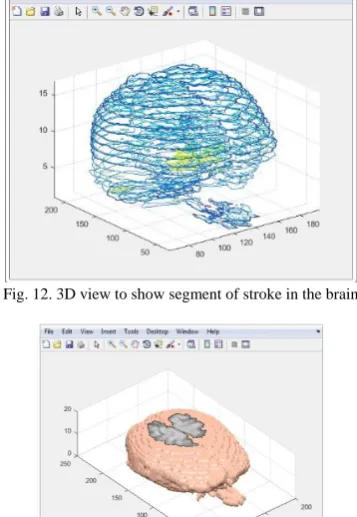
Fig. 12 and Fig. 13 show the 3D view that shows the segmented stroke regions. For Fig. 8, the yellow color is the abnormal lesion in each slice of the brain and in Fig. 13, it shows the brain iso-surface of the stroke lesion.
[image:5.595.337.506.447.736.2]Fig. 12. 3D view to show segment of stroke in the brain
Fig. 13. The brain in 3D
Fig. 14 shows the movie player for the segmentation result of overall DWI slices of the patient. It contain 17 slices of the brain images. In this figure, slice 3 to slice 8 have abnormal stroke regions, while the rest slices are normal. Finally, Fig. 15 shows the segmentation outer of the stroke lesion for each slice in coordinate view.
Fig. 14. Movie player to show the region of stroke lesion
[image:5.595.349.502.449.589.2] [image:5.595.354.500.611.737.2]IV. CONCLUSION
Diffusion-weighted imaging (DWI) is considered as the most sensitive technique in detecting stroke and is useful in giving details of the component of the stroke lesions. In this study, new approach for automatically detecting, segmenting and classifying of stroke from DWI are introduced. Fuzzy C-Means (FCM) algorithm is proposed to segment the stroke lesions in DWI. Jaccard, Dice, false positive rate (FPR) and false negative rate (FNR) are used as the segmentation performance evaluation metrics. The results demonstrated that the FCM algorithm provides better segmentation results in acute stroke lesion according to the high values of Jaccard and Dice indices and low values of FPR and FNR. The results for Jaccard, Dice, FPR and FNR of acute stroke are 0.7, 0.84, 0.049 and 0.205, respectively. The accuracy for acute stroke is 90% and chronic stroke is 70%, while the sensitivity of the lesion is 84.38% and the specificity is 83.33%. Finally, the DWI images have been reconstructed in three-dimensional (3D) view showing that it has a good visualization of the stroke lesions.
ACKNOWLEDGEMENT
The authors would like to thank to the Rehabilitation Engineering & Assistive Technology (REAT) research group under Center for Robotics & Industrial Automation (CeRIA), Faculty of Electronics and Computer Engineering (FKEKK), UTeM, Advanced Digital Signal Processing (ADSP) Lab, UTeM and Ministry of Higher Education (MOHE), Malaysia for sponsoring this work under project PJP/2016/UPM/FKEKK/CERIA/S01490 and the use of the existing facilities to complete this project.
REFERENCES
[1] K. W. Loo and S. H. Gan, “Burden of Stroke in Malaysia,” International Journal of Stroke, vol. 7, pp 165-167, February 2012. [2] C. D. Bushnell, “Stroke and the Female Brain,” Nature Clinical
Practice Neurology, vol. 4, no. 1, pp 22-33, January 2008.
[3] J. I. Sirven and B. L. Malamut (2008). Clinical Neurology of the Older Adult. Lippincott Williams & Wilkins, Philadelphia, USA. [4] N. Mohd Saad, S.A.R. Abu-Bakar, Sobri Muda, M. Mokji, and A.R.
Abdullah, “Fully Automated Region Growing Segmentation of Brain Lesion in Diffusion-weighted MRI,”IAENG International Journal of Computer Science, 39:2, IJCS_39_2_03, May 2012.
[5] Saad, N. M., Syed Abu Bakar, S. A. R., Muda, A. S., & Mokji, M. M., “Review of Brain Lesion Detection and Classification using Neuroimaging Analysis Techniques,” Jurnal Teknologi,74(6), pp 73-85, April 2015.
[6] J. B. Andre and R. Bammer, “Advanced Diffusion Weighted Magnetic Resonance Imaging Techniques of the Human Spinal Cord,”Top Magn Reson Imaging, 21(6) :367–378 December 2010. [7] MAGNETOM Maestro Class: Diffusion Weighted MRI of the Brain,
Brochure Siemens Medical Solution that help
[8] Miyamoto, S., Ichihashi, H., & Honda, K. (2008). Algorithms for fuzzy clustering. Methods in c-Means Clustering with Applications. Kacprzyk J, editor Berlin: Springer-Verlag
[9] Kannan, S. R., Pandiyarajan, R., & Ramathilagam, S. Effective weighted bias fuzzy C-means in segmentation of brain MRI. In Intelligent and Advanced Systems (ICIAS), 2010 International Conference on (pp. 1-6). IEEE. (2010, June).
[10] Shah, Brijesh, Satish Shah, and Y. P. Kosta. "Novel Improved Fuzzy C-Mean Algorithm for MR-Image Segmentation." International Journal of Soft Computing and Engineering 2 (2012): 355-357. [11] Xue, J. H., Pizurica, A., Philips, W., Kerre, E., Van De Walle, R., &
Lemahieu, I., “An integrated method of adaptive enhancement for unsupervised segmentation of MRI brain images,” Pattern Recognition Letters, 24(15), 2549-2560, April 2003.
[12] H. Bashir, F. Hussain, and M. H. Yousaf, “Smart Algorithm for 3D Reconstruction and Segmentation of Brain Tumor from MRIs using Slice Selection Mechanism,” vol. 5, no. 3, pp 187–200, June 2015. [13] A.F. Muda, N. Mohd Saad, Y.F. Low, A.R. Abdullah, N. Waeleh,