DOI 10.1007/s11340-017-0296-9
Experimental and Numerical Analysis of Initial Plasticity
in P91 Steel Small Punch Creep Samples
F. Cortellino1·J. P. Rouse1 ·B. Cacciapuoti1·W. Sun1·T. H. Hyde1
Received: 17 November 2016 / Accepted: 2 May 2017
© The Author(s) 2017. This article is an open access publication
Abstract To date, the complex behaviour of small punch creep test (SPCT) specimens has not been completely understood, making the test hard to numerically model and the data difficult to interpret. This paper presents a novel numerical model able to generate results that match the experimental findings. For the first time, pre-strained uni-axial creep test data of a P91 steel at 600◦C have been implemented in a conveniently modified Liu and Murakami creep damage model in order to simulate the effects of the initial localised plasticity on the subsequent creep response of a small punch creep test specimen. Finite element (FE) results, in terms of creep displacement rate and time to fail-ure, obtained by the modified Liu and Murakami model are in good agreement with experimental small punch creep test data. The rupture times obtained by the FE calculations which make use of the non-modified creep damage model are one order of magnitude shorter than those obtained by using the modified constitutive model. Although further investigation is needed, this novel approach has confirmed that the effects of initial localised plasticity, taking place in the early stages of small punch creep test, cannot be neglected. The new results, obtained by using the modified constitutive model, show a significant improvement with respect to those obtained by a ’state of the art’ creep dam-age constitutive model (the Liu and Murakami constitutive model) both in terms of minimum load-line displacement rate and time to rupture. The new modelling method will
J. P. Rouse
1 Department of Mechanical, Materials and Manufacturing
Engineering, University of Nottingham, Nottingham, Nottinghamshire, NG7 2RD, UK
potentially lead to improved capability for SPCT data inter-pretation.
Keywords Small punch test·Creep·Finite element· Initial plastic strain
Introduction
In recent years, miniature specimen testing techniques have received increased attention from the power generation industry in view of several situations where the amount of material available for testing is limited [1,2]. One of these cases is life assessment of in-service components, where small amounts of material can be extracted without impair-ing the structural integrity of the analysed component [3, 4]. In this way, quasi-non destructive evaluation of “at risk” components can be completed to inform future operation and maintenance strategies. The uncertainty related to life assessment techniques needs to be reduced if safe and eco-nomic operation is to be achieved and in-service component testing constitutes a key approach [7]. Miniature speci-men creep testing techniques developed for power plant applications and, in particular for material creep proper-ties characterisation, include: subsize conventional uniaxial creep specimens, with typical diameters of 1.5 to 3 mm; impression creep test specimens, with typical dimensions of 10x10x2.5 mm for a rectangular sample; small punch creep test specimens, with recommended disk radius of 8 mm and thickness of 0.3 to 0.5 mm; small ring creep test specimens, with typical radius of 6 mm; and two-bars creep specimens, with typical overall length of 26 mm [2,5,6].
developed in 1980s for nuclear applications in order to evaluate the ductile-to-brittle transition temperature (DBTT) of a Ni-Cr steel (as a constant load-line displacement rate test technique). In 1990s, the creep deformation determined by this testing technique, carried out at constant load, was used to characterise the creep properties of various steels and of their welds.
An application of small specimen testing techniques is the creep qualification of critical locations in structural components, such as the heat affected zone (HAZ) of welds [7–9].
Typically, the test has been used for power plant applica-tions (e.g. steam headers or steam pipes) testing materials such as P91, P92, CrMoV steels, 316LN stainless steel, and magnesium and aluminium alloys [10–13]. Typical temper-atures are those of the creep regime of the material been tested, e.g. 575–750 °C.
SPCT has several advantages over other miniature test-ing techniques. Specimen designs are simple (a disk) and therefore far easier to manufacture than, say, the miniature samples proposed by the Electrical Power Research Institute (EPRI) [1]. Unlike other creep samples, such as the small ring specimen [2], the small punch creep test specimen is taken to failure, therefore it is expected that creep rupture data can also be evaluated using SPCT [14–22].
During a unixial creep test, carried out at constant stress, crack propagation only occurs in the tertiary region of the creep curve. During small punch creep tests however, dam-age starts developing in the secondary stdam-age of the deflection versus time curve, where deformation of the specimen is dominated by dislocation creep. The tertiary region of the deflection versus time curve is characterised by an accelera-tion of the crack propagaaccelera-tion and the deformaaccelera-tion of the disk is governed by inter-granular cavitation [23,24]. A small punch specimen generally experiences the evolution of a necking region, which takes place at an offset from the axis of symmetry of the disk [25–27]. Commonly, a crack nucle-ates at the bottom surface of the specimen, in the necked area, and spreads through the thickness of the disk, leading to the specimen rupture [3,28].
The complex, non-linear nature of the test introduces sev-eral difficulties in the procedure of data interpretation and correlation to the corresponding uniaxial test output. In par-ticular, large plastic deformation due to the application of the loading punch takes place in localised regions of the specimen. It is expected that this deformation affects both the localised creep behaviour of the material in those regions and the global deformation response of the specimen as a whole. Several authors have investigated the effects of plastic-ity (induced in a material by various loading conditions) on subsequent creep deformation [29]. Willis et al. investi-gated the effects of pre-straining on the creep response of 316H stainless steel in partially-solution treated (PST) and fully-solution treated (FST) conditions, and of FST 316L stainless steel, at 575◦C [30,31]. A drastic reduction in the
creep ductility and the minimum creep rate was observed for both PST and FST 316 stainless steels, while the fail-ure time was found to decrease for the PST material and to increase for the FST material. A similar variation of the creep curve, after room temperature pre-straining, was also observed by Wilshire and Palmer for polycrystalline copper [32]. Wilshire and Willis also reported the effects of high temperature pre-straining on the subsequent creep behaviour of 316L stainless steel at 575◦C by reducing the test stress after an initial stage. Immediately after the load reduction, the creep rate became extremely low and, after that, it increased to a value similar to the minimum creep strain rate observed during a constant stress creep test [31]. The behaviour of 316 stainless steel was also investigated by Hyde who reported the results of plasticity/creep tests performed at 550◦C by applying a creep load to the speci-mens and overloading for 3 sec at regular time intervals of 168 h [33,34].
In view of the remarkable effects that initial plasticity (pre-straining) can have on the creep behaviour of mate-rials, the role of initial, large plastic deformation on the response of the small punch creep test specimen is investi-gated in this paper through the use of finite element (FE) calculations and experimental investigations carried out on both full sized uniaxial and small punch specimens. For the first time in the published literature, the data obtained from pre-strained uniaxial creep tests has been used in numerical analyses in order to simulate the effects of the initial plastic-ity on small punch creep test, resulting in a good agreement between the numerical results and the experimental data. Liu and Murakami’s creep damage model [35] has been conveniently modified in order to take into account, dur-ing numerical simulations of small punch creep tests, the effects of pre-straining. The modified creep damage model has shown to be able to provide more accurate results in terms of displacement versus time curve with respect to the non-modified Liu and Murakami model. The results of the non-modified constitutive model exhibit times to failure one order of magnitude shorter than those obtained by experi-mental testing and numerical calculations carried out with the modified constitutive model.
Experimental Programme
Pre-strained Uniaxial Creep Tests
Experimental Procedure
Table 1 Chemical
composition (wt%) of the P91 steel used for the investigation [36]
Cr Mo C Si S P Al V Nb N W Fe
8.60 1.02 0.12 0.34 <0.002 0.017 0.007 0.24 0.070 0.060 0.03 Bal
SEM image of the virgin material microstructure. Cylindri-cal uniaxial specimens were machined on a CNC lathe from a power plant steam pipe section. The data obtained from the pre-strained uniaxial creep tests was used to characterise the plastic behaviour of the material through the determination of two parameters,φandψ, as described in Section 2.1.3.
Before manufacturing the specimen (see Fig.2for the specimen geometry) material blanks were tempered at 760◦C for 3 hours and then cooled to room temperature at a rate of 0.8◦C/min , in order to obtain a fully martensitic steel microstructure.
A Mayes EN250 machine was used for all of the pre-strained uniaxial creep tests. The deformation of the speci-men was monitored by use of an extensometer with a gauge length of 50mm, while the temperature was kept constant to within±1◦C by the furnace controller of the machine. For each test, the specimen was plastically pre-strained under displacement control conditions. Subsequently, the config-uration of the machine was changed to load control and constant load creep tests were carried out. The load lev-els used during the creep tests were corrected in order to account for the reduction of the cross sectional area due to plastic pre-straining. When plastic deformation takes place the volume of the specimen is constant, therefore equation (1) holds, wherepre andLpre are the cross section area
and the gauge length of the specimen at the end of pre-straining, whileyieldandLyield are the cross section area
and the specimen gauge length at yielding.
preLpre=yieldLyield (1)
Fig. 1 SEM image of the virgin P91 steel used for the tests, from Ref. [37]
The load,P, applied to the specimen is then obtained by equation (2), whereσ is the stress applied,d0is the initial diameter of the specimen’s effective section,el,yield is the
elastic engineering strain at yielding,p is the plastic
pre-strain andνis the Poisson’s ratio. Deviation of equation (2) is presented in theAppendix.
P =σ pre=σ π d02
4
1+el,yield
1+p+el,yield
1−νel,yield 2
(2)
The stress levels used for the creep tests are 150, 160 and 170MP a. For the 150MP a tests, engineering pre-strain levels of 5, 10 and 20% were used. For the other two stress levels, the pre-strain levels of 0.5, 5, 10 and 20% were used. Uniaxial creep data at 600◦C was also available for the P91 steel and was used to provide 0% pre-strain creep results [36].
Pre-strained creep test results
Figure3shows the variation of the creep strain,c, versus time obtained from the pre-strained creep tests performed at 150, 160 and 170MP a at 600◦C, wherepreis the total
engineering pre-strain. All of the plots exhibit the typical three regions of creep curves, i.e. primary, secondary and tertiary regions, and the experimental output was found to be significantly influenced by the plastic pre-straining carried out before creep testing. Plastic deformation mainly takes place in the pre-straining stage of the test, as the creep step is carried at stress levels well below the material’s yield stress (in it’s virgin state). The effects of plastic strain accumula-tion in the latter stages of the test (i.e. just before rupture) are not considered hereafter.
The results of the tests performed at 150MP a(Fig.3(a)), show that the material exhibited a creep resistance effect, i.e. the minimum creep strain rate decreased and the time to fail-ure increased, for pre-strain levels of 5 and 10%, while, with
[image:3.595.52.289.523.688.2] [image:3.595.304.546.604.688.2]Fig. 3 Variation of the creep strain,c, versus time (a) 150MP a, (b) 160MP aand (c) 170MP aat 600◦C, wherepre is the total engineering pre-strain
a pre-strain level of 20%, a creep enhancement effect was found (i.e. the minimum creep rate increased and the time to rupture decreased). When the stress level was 160MP a, see Fig.3(b), creep resistance effects were found for pre-strains of 0.5 and 5%, and creep enhancement was observed for 10 and 20% pre-straining. For the tests at 170MP a, the material showed creep resistance effects for 0.5% pre-strain only, while, for all of the other cases, creep enhancement occurred, as reported in Fig.3(c).
Characterisation of the effects of pre-straining on creep response
In view of the results shown in Fig. 3, the effects of high temperature plastic pre-strain on creep response of P91 steel may be quantified by two parameters, namely, φ and ψ. These parameters account for the variation in the minimum creep strain rate and the time to failure, respectively, due to the application of a total engineering pre-strain level,t.
Equations3and4defines theφandψparameters, respec-tively, where˙MI N,c 0andtf,0are the minimum creep strain rate and the failure time of material under a 0% pre-strain condition (as received), while˙MI N,pc andtf,p refer to the
material after pre-straining.
φ=˙ c MI N,p
˙
MI N,c 0 (3)
ψ= tf,0 tf,p
(4)
In the experimental study conducted by Tai and Endo [38], the φ parameter was used to model the variation of the minimum strain rate after pre-creep deformation in a 2.25Cr1Mo steel. In the present work the accumulation of time dependent inelastic strain during pre-straining is considered to be negligible.
For each stress level, the variation of the φ parameter withpwas fitted by an equation of the form of equation (5)
(see Table2for coefficient values) wherep is the plastic
engineering pre-strain, expressed as a percentage. The val-ues of each fitting coefficient, obtained for each stress level, was averaged over the three stress levels, in order to obtain an average fitting surface.
φ=exp[a1p] +b1p2+c1p3+d1p4 (5)
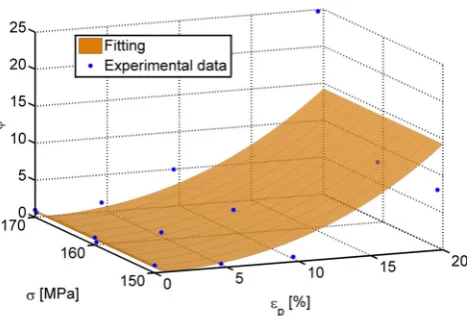
Figure 4shows theφ parameter versus the engineering plastic pre-strain and the stress (for creep) obtained from the experiments, together with the average fitting surface (see equation (5)).
Similarly, the rupture data for the pre-strained creep tests was used to determine the variation of the ψ parameter. Equation6is the fitting equation used to model theψ vari-ation versusp, for each stress level, and Table3lists the
coefficients of the average fitting.
[image:4.595.73.264.56.551.2]ψ=exp[a2p] +b2p2+c2p3 (6)
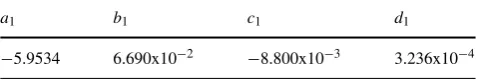
Table 2 Averaged fitting constants values used in equation (5)
a1 b1 c1 d1
[image:4.595.306.545.675.715.2]Fig. 4 Variation of the φ parameter with the engineering plastic pre-strain and the stress level with an average fitted surface to the experimental data
Figure5shows the variation of theψparameter with the engineering plastic pre-strain and stress obtained from the experiments, and the average surface (equation (6)).
When φ > 1, the material shows an increase of the minimum creep strain rate when compared with the 0% pre-strained condition (hence it exhibits a creep enhance-ment effect). When φ < 1, a creep resistance effect is evident. Similarly, whenψ <1 the failure life of the speci-men increases (creep resistance effect) while, whenψ >1, the failure time decreases (creep enhancement effect). Both equation (5and6) lead toφ = ψ = 1 when the plastic pre-strain equals 0, i.e. for the 0% pre-strained condition.
Small Punch Creep Tests
Experimental Set-up
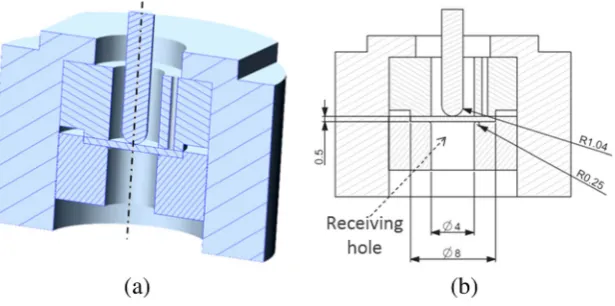
Small punch creep tests were carried out at 600◦C on the same batch of material as that used for the pre-strained tests (see Table 1). A dead-weight machine was used for the SPCTs (see Fig.6(a) for a cross section of the experimental set-up). The disc specimen was held in place by a clamping ring while it was loaded by the hemispherical end punch. The outer tube and the clamping ring have through-passing holes for the top thermocouple to be inserted. In Fig.6(b), the dimensions of the testing set-up, which conform to those recommended by the CEN draft code of practice [5], are also shown.
[image:5.595.309.543.56.214.2]The specimen was clamped by applying a clamping torque to a M25x1.5 thread, connecting the outer tube and
Table 3 Averaged fitting constants for equation (6)
a2 b2 c2
-3.241 2.610x10⁻² 4.763x10⁻⁴
Fig. 5 Variation of the ψ parameter with the engineering plastic pre-strain and the stress level with the average fitted surface to the experimental data
the insert tube. The value of the clamping force was con-trolled by monitoring the applied torque and which is set to 10N m for all of the tests, in order to ensure consistent experimental conditions.
The set-up represented in Fig. 6 was located in a fur-nace with a single-zone temperature controller. During the tests, the temperature was controlled to 600 ±1◦C. Two thermocouples were inserted in the testing set-up (located at the top surface of the specimen and immediately below the specimen) in order to record any temperature fluctuations.
The central deformation of the specimen was monitored by a linear variable differential transducer (LVDT), which measures the displacement of the punch with time.
To date, the magnitude of friction forces acting on SPCT specimen has not been identified in a definitive manner. However, numerical and experimental investigations [39– 41] showed that, for the same test load and temperature, friction has the effect of increasing the time to rupture and decreasing the rate of creep deformation of the specimen. Friction forces generate a bending moment in the speci-men which opposes the rotation of the annular region of the specimen in the vicinity of the edge of contact between the specimen and the punch. In turn, the viscous (creep) defor-mation of the specimen takes place at a lower rate and the failure time is therefore increased [40]. Although SPCT is a static test, the temperature and the test load level in the present investigation are likely to be high enough for the asperity junctions of the punch and the specimen to generate a stick/slip scenario. The generation of such contact regime is intrinsic of this testing typology, therefore, in the present work, it could not be eliminated.
Small punch creep test results
[image:5.595.53.287.59.213.2] [image:5.595.48.290.673.714.2]Fig. 6 Specimen location set-up with relevant dimensions (mm)
the tests, i.e. the variation of the central displacement of the specimen versus time. The experimental curves shown in Fig.7exhibit the 3 typical SPCT regions described in the literature [1,20,42–44].
The early stage of the test is characterised by a decreasing displacement rate, followed by a stationary region, where the displacement rate reaches its minimum value. The later stage of the tests shows rapidly increasing displacement rate until failure occurs. The fluctuations in displacement found in the early stages of the 25kg test curve were caused by electronically induced noise, caused by interfer-ence between two data acquisition system units; this was eliminated in the early stages of the other tests. Figure8shows the variation of the minimum displacement rate (MDR) versus the load level,P.
A power law correlation between MDR and P was found and is represented by equation (7), whereMDR is expressed inmm/ hrandP inkg.
MDR=6.457x10⁻¹⁵P7.790 (7)
Fig. 7 Variation of the central specimen deformation versus time for a P91 steel at 600◦with different load levels
Figure9shows the variation of the failure time,tf, versus
load level using logarithmic scales. A power law correlation oftf with load level, given by equation (8), was obtained.
tf =1.995x10¹⁷P−10.24 (8)
According to the CEN Code of Practice CWA 15627, the load level, P, must be calculated such that the small punch creep test specimen has the same time to failure as an uniaxial creep test specimen subjected to an equivalent uniaxial stress,σU N IEQ [5]. The dimensions of the testing set-up, i.e.Rs = 1.04mm,ap =2mmandt0 =0.5mm, were used in equation (9) and the multiplication factor of 0.8 was included because the disc specimens were clamped into the experimental set-up [5], conforming with the CEN code of best practice for SPCT. The ksp parameter is a correction
factor describing the effects of the ductility of the tested material at different temperatures.ksp has then been
calcu-lated for each load level and it has been found to increase with the load, in agreement with the results of G¨ulc¸imen and
[image:6.595.237.545.61.214.2] [image:6.595.331.519.516.674.2] [image:6.595.77.265.530.675.2]Fig. 9 Variation of the time to failure (tf) versus load level, plotted on logarithmic scales
H¨ahner [8]. An averagekspvalue (1.353) was found for the
load range used in the investigation.
P
σU N IEQ =3.332kspa −0.2
p R
1.2
s 0.8 (9)
Interrupted tests were also performed using a load of 25kgin order to investigate the evolution of failure in the specimen during the test. Figure 10 is a plot of the out-put of the 25kgcompleted and interrupted tests (at 2, 200, 400 and 669hrs). As with previous investigations, a signif-icant amount of data scatter in the experimental results was found to exist [4]. In the present investigation, the scatter appeared to be related to the characteristics of the testing machine, and to slight misalignments in the loading punch with respect to the axial direction of the test rig. Detailed numerical investigations of this misalignment are discussed elsewhere [24,45].
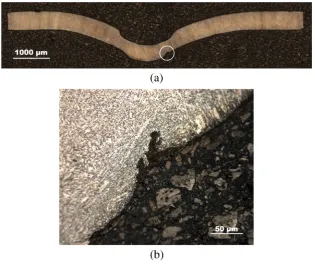
[image:7.595.75.264.56.217.2]Interrupted test specimens were imaged using Nikon Eclipse LV100ND optical microscope (see Figs.11,12and13). A crack was found to nucleate at the bottom surface of the
Fig. 10 Variation of the central deformation of the specimen versus time for the interrupted tests. The punch load is 25kgfor all of the tests
specimen at some distance from the axis of symmetry in the 400hrssample (see Figs.12(b) and13(c)) which propagates along a direction at approximately 45◦from the loading axis (Fig.13(b)).
Such a crack has a significant role in the evolution of the apparent creep response of the specimen, as it constitutes the main mechanism which leads to the loss of load carrying capability of the structure and to rupture (through fracture) of the specimen.
FE Modelling
FE Model
Material constitutive model
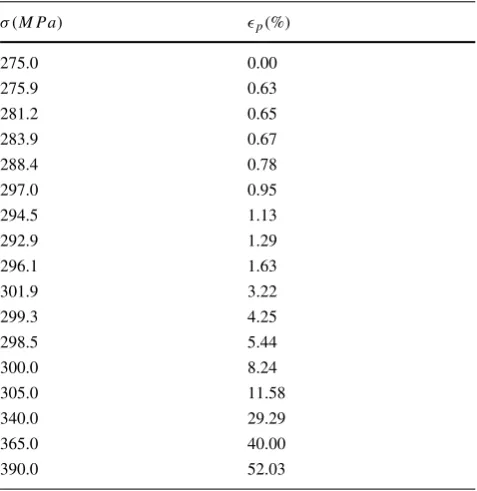
An elastic/plastic/creep constitutive model, capable of accounting for the effects of plastic deformations on subse-quent creep material behaviour, was used for the FE anal-yses. The true stress/strain curve, reported in Fig.14, was approximated from the engineering tensile curve obtained using a stress/strain test of a P91 steel at 600◦C, and it was implemented, in a tabular form, in the FE solver ABAQUS (see Table4), whereσis the equivalent von Mises stress and
pis the von Mises equivalent plastic strain.
[image:7.595.75.261.530.677.2]Fig. 11 Images of a P91 SPCT specimen tested until 200hrs, showing (a) the general deformed shape and (b) detail of the punch contact region
a penny shaped microcrack, or, equivalently, a cavitated grain boundary facet, Liu and Murakami proved that the damage parameter,ω, is a function of the length and the den-sity of the microcracks and does not depend on the material constantn[35]. Instead the microcrack parameter,ρ, is also a function ofn, as shown in equation (10) [35].
ρ= 2(n+1) π
1+3
n
ω3/2 (10)
In this paper, in order to model the creep behaviour of the material by also taking into account the pre-straining effects in the SPCT, the authors propose a modified Liu-Murakami constitutive model, which was implemented through the CREEP user subroutine in ABAQUS [49]. The modified constitutive equations allow the effects of plastic pre-strain on the minimum creep rate and on the failure life to be included. The Liu-Murakami constitutive model was mod-ified using theφ andψ parameters defined in equation (3 and 4), respectively. Equations 11and 12shows the evo-lution of the creep strain rate, ˙ijc, (in multi-axial form)
[image:8.595.231.547.457.724.2]Fig. 13 Images of a P91 SPCT specimen tested until 669hrs
(failure), showing (a) the general deformed shape, (b) detail of the fracture surface (location B) and (c) detail of a secondary crack initiated in the punch contact region (location A)
and of the damage rate,ω˙, in the creep constitutive model adopted for the FE calculations, whereσEQis the von Mises
equivalent stress,σ1 is the maximum principal stress, Sij
is the generic component of the deviatoric stress tensor andB is a material constant. σRU P is the rupture stress,
defined by equation (13). The effects of temperature on the creep behaviour of the material are taken into account by the material constants. It should be noted that, in the Liu and Murakami constitutive model, the rupture stress is a composition of the maximum principal stress and of the von Mises equivalent stress, summarising the multi-axiality of the stress state in a single variable.
˙
ijc = 3
2φBσ
n EQ
Sij σEQ
exp
⎡ ⎢ ⎢
⎣ 2(n+1) π
1+3
n
σ1
σEQ 2
ω3/2 ⎤ ⎥ ⎥ ⎦
(11) ˙
ω=ψA
1−exp (−q2)
q2
σRU Pχ exp (q2ω) (12)
σRU P =ασ1+(1−α) σEQ (13)
In order to include the variations of φ andψ with the plastic strain, equation (5and6) were also implemented in the constitutive model. The maximum damage value was limited to ωMAX = 0.9901 in order to avoid numerical
problems which arise whenωapproaches unity.
Fig. 14 True stress/strain curve, for a P91 steel at 600◦C
instantaneous modulus corresponding to a damaged element [48].
E=E0(1−ω) (14)
Table5lists the elastic properties and material constants for the Liu-Murakami creep constitutive model obtained for the P91 steel at 600◦C (as received 0% pre-strain condition). The correlations between pre-strain and the φ and ψ
[image:10.595.72.264.56.214.2]parameters were obtained using experimental results where strain levels are taken to be the engineering total strain for the specimen. In reality however, local strains (particularly in the necked regions) can be far greater than the average engineering strain of the uniaxial specimens (discussed in
Table 4 Tabular form of the true stress/strain curve, for a P91 steel at 600◦C, implemented in ABAQUS
σ (MP a) p(%)
275.0 0.00
275.9 0.63
281.2 0.65
283.9 0.67
288.4 0.78
297.0 0.95
294.5 1.13
292.9 1.29
296.1 1.63
301.9 3.22
299.3 4.25
298.5 5.44
300.0 8.24
305.0 11.58
340.0 29.29
365.0 40.00
[image:10.595.305.544.82.122.2]390.0 52.03
Table 5 Material constants for a P91 steel at 600◦C (stress inMP a
and time inhrs) adapted from ref. [36]
E0(MP a) ν B n A χ q2 α
1.5x10⁵ 0.3 1.51x10⁻³⁰ 11.795 2.12x10⁻²⁷ 10.953 5.3 0.3
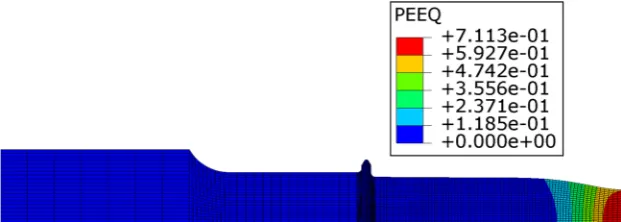
“Material constitutive model”). This is especially true for the high pre-strain level tests. In order to account for this mismatch and to implement a correlation between the true strains and the pre-strain parameters (i.e. φ andψ) in the SPCT model, an additional FE calculation of a uniaxial ten-sile test of a P91 steel at 600◦C was carried out using the tensile curve described in Table4. The mesh used is shown in Fig.15and it consists of 2974 axisymmetric quadrilateral elements. In view of the symmetry of the uniaxial creep test specimen (see Fig.2), a quarter section only was modelled. By using the geometry non-linear (GNL) approach (which updates the stiffness matrix of the structure at each time increment during the analysis) the uniaxial specimen FE model can take into account the large deformations and necking occurring for large engineering strains. Figure16 is a contour plot of the plastic equivalent strain, expressed in absolute value, for an engineering strain level of 0.122%, while Fig. 17 shows the engineering stress/strain curves obtained from the uniaxial FE model and from a tensile test carried out on a P91 steel at 600◦C.
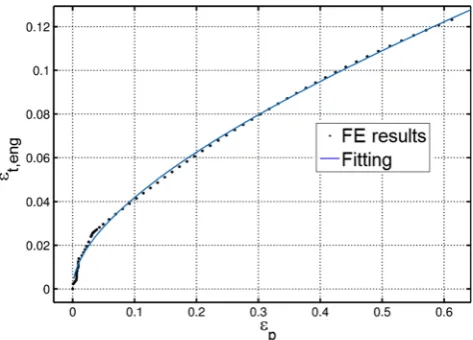
From the results of the additional uniaxial FE analy-sis, the variation of the total engineering strain (t,eng) was
related to that of the true equivalent plastic strain (p,t rue)
in the necked section of the uniaxial specimen. Equation15 was fitted to the FE results, where both t,eng, andp,t rue
are expressed in absolute value, witha=0.052,b=0.118 andm=0.508 (Fig.18).
eng=atrue+btruem (15)
Geometry, loads and boundary conditions
The geometry of the FE model of the SPCT is identical to that used for testing as shown in Fig. 6, with a speci-men thickness,th, and diameter,DSP T, of 0.5mmand 8mm,
respectively, punch radius,Rs, of 1.04mm, receiving hole
radius (see Fig.6(b)),ap, of 2mmand lower clamp radius
of 0.25mm.
[image:10.595.51.290.457.703.2]Fig. 15 FE mesh used for the additional calculation of a uniaxial tensile test for a P91 steel at 600◦C
also constrained. A load of 500kgwas applied to the rigid holder (representative of the clamping load resulting from a 10N mtightening torque [45]) in order to secure the speci-men between the two dies. Figure19schematically shows the loads and the boundary conditions applied to the model.
Element choice and meshing
Since the behaviour of the specimen is characterised by large incompressible deformations due to creep and by severe local loading conditions at the contact edge (between the punch and the specimen), the FE mesh adopted to model the SPCT specimen consists of 883 nodes and 790 bilinear axisymmetric 4-node elements. Figure20shows the mesh used for the SPCT FE analyses. 10 elements were used through the thickness of the specimen and the mesh was refined in the region where the edge of contact between the punch and the specimen is located for most of the analysis. The minimum element size, in the refined region, is 0.013 mm. Quadratic elements (second order formulation) were avoided because, for the present work, they lead to a larger computational cost without producing any increase in the accuracy of the FE solutions as significant plastic deforma-tions occur in the model. The reduced integration formula-tion was used, in order to avoid “locking” problems and con-vergence difficulties encountered when ”fully integrated” linear elements were adopted. These problems are due to a non-physical increase of the stiffness of the elements (“parasitic stiffness components” [49]) when bending defor-mation occurs, such as at the beginning of the creep step in the SPCT analyses, causing non-convergence of the solu-tion. Hybrid formulation elements were adopted in order to avoid numerical singularities, which can occur when standard constant strain elements (such as the 4-node axis symmetric bilinear elements) are used with incompress-ible deformation fields. The hybrid formulation processes
the pressure stress as an independently interpolated solu-tion variable, coupled with the displacement solusolu-tion [49]. Thus, unstable solutions for the displacement field after an infinitesimal increase of the pressure stress are avoided. In view of these requirements, the CAX4RH element type, available in ABAQUS, was used. The elements are refined near the edge of the unsupported region of the specimen, where significant bending deformation take place, and in the region close to the contact edge between the punch and the specimen, which was identified as the most critical location in the specimen [16,28,43].
Modelling procedure of the contact interactions
Surface-to-surface contact interactions have been used for all of the contacting pairs. The contact elements were auto-matically generated by the solver and consist of stiff springs which, once activated, apply the contact forces to the con-tact nodes on master and slave surfaces [50]. The activation of contact elements occurs when the interference between the contact nodes is less than the specified tolerance (0 in the present analyses). The stiffness of the contact ele-ments varies non-linearly with the contact penetration (i.e. the non-linear penalty contact formulation was used). This was found to be a critical feature of the FE analyses when material flow due to plasticity and/or creep is included as it directly influences the convergence rate and the accuracy of the solution. Also the slip tolerance under stick conditions (identifying the stiffness of tangential contact elements) significantly affects the convergence rate of both the elas-tic/plastic and creep steps of the FE analysis. Although the friction coefficient between the specimen and the clamp-ing components, as well as between the punch and the disk, cannot be straightforwardly quantified, for steels at temper-atures of 600◦C or higher, a realistic value of the coefficient of friction between the punch and the specimen was found to
[image:11.595.232.543.591.702.2]Fig. 17 Experimental and numerical engineering stress/strain curves. Strain was measured using an extensometer with a gauge length of 50
mm. It is worth noting that the apparent “weakening” of the material is due to necking of the specimen rather than the degradation of the material
[image:12.595.305.542.59.225.2]be 0.3 by Dym´aˇcek et al. [41]. It was also demonstrated, by finite element analysis, that friction effects become impor-tant when the friction coefficient between the specimen and the punch varies from 0 to 0.5, making the failure life to increase up to 8 times [39,40]. For this work the Coulomb classical friction formulation was used and the friction coef-ficients were taken to be 0.3 and 0.8 for the punch/specimen and the punch/clamps interactions, respectively [45]. The Coulomb friction formulation used for the numerical analy-ses does not account for stick/slip between contact surfaces. During the test the small disc specimen undergoes severe changes in its shape (it gradually deforms into a conical shape). In order to account for large deformation, the geo-metrical non-linearity formulation (GNL in ABAQUS) has been used for all of the analyses.
[image:12.595.52.289.508.678.2]Fig. 18 Variation of the engineering strain versus the true strain, in absolute value, obtained from the additional FE analysis of a tensile test for a P91 steel at 600◦C
Fig. 19 Loads and boundary conditions applied to the FE model of SPCT
Numerical Results and Discussion
The results of elastic/plastic/creep damage FE analyses of SPCTs obtained using the modified Liu-Murakami consti-tutive model (see equation (11and12)) were compared with those obtained without including the pre-straining effects (i.e. with φ = ψ = 1). Figure 21 shows the contour plots of the von Mises equivalent plastic strain at the begin-ning of the creep step. The von Mises peak plastic strains ranged from approximately 23% for a punch load of 25kgto approximately 29% when a punch load of 30kgwas applied. The initial plastic strains are therefore judged to be signif-icant in the specimen for all of the load levels used in the calculations. When the load increases from 25 to 30kg, the location of the peak equivalent plastic strain moves from the region close to the punch/specimen contact interface to the bottom surface of the specimen, at approximately 0.5mm
Fig. 20 FE mesh used for the numerical simulations
Fig. 22 Contour plots of theφ
parameter for punch loads of (a) 25kg(b) 28kgand (c) 30kg
therefore, the location of the peak plastic strain changes with the load applied to the structure.
The effects of initial plastic deformations on the creep behaviour of the material are highlighted in Figs.22and23, showing the contour plots of theφandψparameters (calcu-lated using the plastic strain levels shown in Fig.21) at the beginning of the creep step, respectively.
In the region close to the punch/specimen contact edge (which is characterised by the peak plastic deformation) the
φparameter is 1 when the punch load is 25kg, while it is larger than unity (peak values are 1.095) for higher load lev-els. Therefore, a creep enhancement of the material occurs in that region for loads of 28 and 30kg. The region on the middle plane of the specimen, close to the clamps, exhibits
φ=1 for all of load levels used in the calculations because it corresponds to the neutral plane of bending deformation,
where the material is not plastically deformed at the begin-ning of the test for any of the load levels implemented (see also Fig.21for comparison). The material surrounding this area of the specimen exhibits relatively small plastic strains, showing creep resistance effects (φ <1) for all of the load levels.
The variation ofψshows that, due to plastic strain accu-mulation, the creep damage rate is enhanced in the area close to the punch/specimen contact edge (ψ >1). A resis-tance effect is observed in the unsupported region (between the punch and the clamps where ψ < 1). In Fig. 23 the region of material on the middle plane of the specimen, close to the clamps, is characterised by ψ = 1 for all of the load levels because, in this region,p =0 (see Fig.21).
Fig. 23 Contour plots of theψ
parameter for punch loads of (a) 25kg(b) 28kgand (c) 30kg
φ = ψ = 1. Figure 24 shows the punch displacement variation versus time obtained, for the three load levels, using both the modified (pre-strian effects) and un-modified constitutive model. These results are also compared to the corresponding experimental results (see Fig.7).
From the results reported in Fig.24 (where the effects of initial plastic deformation on the creep response of the specimen are taken into account) a global creep resistance effect can be observed with a significant decrease of the minimum displacement rate and an increase of the time to failure, compared to the results of the analyses obtained without the inclusion of pre-straining effects. The global creep resistance of the specimen is related to the fields of the
φandψparameters, which show values less than 1 in most of the specimen, except from the region close to the con-tact edge between the punch and the specimen. The results
of the FE calculations performed by taking into account the effects of pre-straining exhibit a greater adherence to the experimental results compared to those obtained with-out modification in the creep damage constitutive model, in terms of both minimum displacement rate and time to fail-ure. It should be noted that the results of the non-modified constitutive model exhibit times to failure one order of mag-nitude shorter than those obtained by experimental testing and numerical calculations carried out with the modified constitutive model. Albeit a more accurate quantification of theφandψparameters could lead to a further improvement in the numerical results, the modification already provides a significant improvement with respect to the non-modified constitutive model calculations.
Fig. 24 Variation of the punch displacement versus time with punch loads of (a) 25kg(b) 28kgand (c) 30kg
results obtained with the modified constitutive model at 25% of the failure life (462hrs) and those of the FE analy-sis without the inclusion of the plastic deformation effects at
the same failure life fraction (42hrs). It should be noted that the high damage locations indicated in Fig.25are compat-ible with the region of the specimen where crack initiation and propagation was found during the interrupted tests dis-cussed in “Small punch creep test results” (see Fig. 13). Indeed, crack initiation location suggested in Fig.12(b) and the secondary crack location in Fig. 13(c) correlate well with the high damage region reported in both models.
The results of the FE calculations show that the peak damage location is, in both cases, near the bottom sur-face of the specimen and in line with the contact edge between the punch and the specimen (agreeing with pre-vious observations from the literature [3,43]). The region where peak damage is located, defined in the literature as the most critical location of the specimen [16,28], exhibits a global creep enhancement. It is also noted that the region where the elements are fully damaged is larger when the plastic deformation effects are considered. The propaga-tion of the high damage region is not identical in both cases as a result of different creep damage evolution prop-erties (the inclusion of initial plasticity effects). When the effects of pre-straining are taken into account, the damage level in the region close to the clamps is lower than that obtained from the non-modified Liu-Murakami constitutive model, since the elements in that area exhibit a creep resis-tance effect and the damage rate evolution process becomes slower.
In spite of the larger high damage region found in the 25% of the failure time analyses, the simulation with the inclusion of the plastic deformation effects showed a global creep resistance. The global behaviour of the specimen is governed by the combination of creep resistance effects, occurring in most of the specimen for this load level, and creep enhancement effects, found in the critical region of the specimen. For the loads of 28 and 30kg, a creep resistance effect was also observed becauseφandψare less than unity in the majority of the specimen, as shown in Figs.22and23. A comparison of the results obtained by using the modi-fied and the original damage models with the experimental data is given in Table6.
It is generally observed that estimations of both MDR andtf are improved if initial plasticity effects are
Fig. 25 Contour plots of creep damage at 25% of the failure life for a load of 25kg(a) with and (b) without including the effects of initial plastic deformations on material creep behaviour
creep crack growth in the SPCT. It can be seen from optical microscopy that cracks initiate early (2/3tf) for the 25kg
load case. The modelling approach adopted at present does not allow for crack initiation and growth, hence the general over prediction oftf. The peak damage location was not
affected by the initial plastic deformation but the direction of propagation of the high damage region was different from that obtained by the FE calculations without considering the effects of pre-straining. This is again due to the complex interaction between creep enhancement and creep resistant regions in the SPCT. Modelling conditions are in part veri-fied by the excellent agreement noted between high damage regions in FEA model results and crack initiation locations found from interrupted SPCTs (see Figs.11,12and13).
Concluding Remarks
Small specimen tests are gaining popularity in many indus-tries (such as power generation and aerospace) due to their ability to estimate bulk material properties from very small amounts of sample material. Structural integrity assess-ments of in service components can be enhanced using these quasi-non destructive techniques as the overall component integrity is not impaired after sampling [51]. A limiting factor in the wider implementation of the SPCT however is the difficulty in interpreting test results and determining equivalent uniaxial behaviours.
In the present paper, the results of SPCTs (complete and interrupted) have been reported and the role of the initial,
Table 6 Summary of failure times and MDRs calculated from experimental (Exp.), Liu-Murakami (no
pre-straining effects, L-M) and modified Liu-Murakami (inclusion of pre-straining effects, Mod. L-M) results and associated errors
Load (kg) Method MDR(mm/ hr) tf(hrs) Error MDR(%) Errortf (%)
25 Exp. 4.46x10⁻⁴ 1068.38 -
-—– L-M 4.05x10⁻³ 170.94 208.07 84.00
—– Mod. L-M 4.07x10⁻⁴ 1850.43 8.74 73.20
28 Exp. 1.29x10⁻³ 278.49 -
-—– L-M 1.56x10⁻² 49.46 1109.30 82.24
—– Mod. L-M 1.28x10⁻³ 497.85 0.78 78.77
30 Exp. 2.14x10⁻³ 176.09 -
-—– L-M 2.36x10⁻² 29.35 1002.80 83.33
[image:17.595.177.543.571.714.2]localised plastic pre-straining on the subsequent creep behaviour of a P91 steel at 600◦C has been investigated (creep enhancement or resistance).
• A modified Liu-Murakami creep damage model, in which the effect of the initial plasticity is accounted for, has been developed based on results for pre-strained uniaxial creep tests and the corresponding SPCT exper-imental results.
• Prior plastic deformation was found to significantly affect the creep curve of the material tested, and two parameters,φ and ψ, have been used to describe the variation of the minimum creep rate and failure time induced by pre-straining, respectively.
• Predictions of minimum displacement rates (MDRs) in SPCTs were vastly superior when FEA models included pre-straining effects.
• Some improvement was also noted for the prediction of time to failure,tf.
Future Work
The present work has highlighted the critical importance of considering initial plasticity when analysing SPCT results. Accurate interpretation of the SPCT results will only be possible with this greater appreciation of the deformation behaviour of the sample.
• Future inverse methods must make some assump-tions on the creep enhancement/resistance regions in the SPCT sample prior to performing inverse studies to determine creep material properties. Improvements to the prediction of the creep enhancement/resistance behaviour of a particular type of material (here high chrome steels) can be made by incorporating loading (stress) dependent terms in theφandψfunctions. • In order to avoid over prediction oftf, future models
should take into account crack initiation and propga-tion.
• More data in the experimental region of large plastic strains of pre-strained uniaxial creep specimens would enhance the modified Liu and Murakami creep damage model in terms of degree of accuracy and reliability. • The minimum creep strain rate and the time to rupture
in uniaxial creep tests are linked by the Monkmann-Grant equation. The investigation of the effects of pre-strain on the parameters of such relation may lead to the identification of the link betweenφandψ. • Since creep enhancement and creep resistance effects
are microstructure-controlled, a microstructural investi-gation needs to be carried out.
• A useful improvement could consist of the characterisa-tion of the effects of stick/slip contact regime between
the punch and the specimen and the development of a technique to mitigate it, in order to increase test repeatability.
• Unified visco-elastic visco-plastic constitutive models could be superior alternatives to Liu and Murakami creep damage model for numerical simulation of small punch creep test.
Acknowledgments The authors would like to thank the Electric Power Research Institute (EPRI), NC, USA, for their financial support to the Ph.D. programme including this research.
We would also like to acknowledge the support of the Engineering and Physical Sciences Research Council (EPSRC) for their support for the project - Flexible and Efficient Power Plant: Flex-E-Plant (Grant number: EP/K021095/1). We also thank the following partners for their the valuable contributions: GE Power, Doosan Babcock Lim-ited, Centrica plc., EDF Energy (West Burton Power) LimLim-ited, Uniper Technologies Limited, Goodwin Steel Castings Limited, NPL Man-agement Limited, R-MC Power Recovery Limited, RWE Generation UK plc., Scottish and Southern Energy (SSE) plc., Siemens Industrial Turbomachinery and TWI Limited.
Open Access This article is distributed under the terms of the Creative Commons Attribution 4.0 International License (http://creativecommons.org/licenses/by/4.0/), which permits unre-stricted use, distribution, and reproduction in any medium, provided you give appropriate credit to the original author(s) and the source, provide a link to the Creative Commons license, and indicate if changes were made.
Appendix
In order to derive equation (2), the non-linear problem of load correction has to be split in three parts: elastic part of pre-straining, plastic part of pre-straining and elastic recovery upon unloading.
Elastic Part of Pre-straining
Pel,yield is the load during the elastic part of pre-straining
that leads the specimen to yield, and it is given by equation (16), wheredel,yield is the diameter of the effective section
of the specimen at the elastic limit, defined by equation (17).
Pel,yield =σ π
del,yield2
4 (16)
del,yield =d0−νel,yieldd0=d0(1−νel,yield) (17)
In virtue of equation (17),Pel,yield can be expressed as
in equation (18).
Pel,yield =σ π d02
4 (1−νel,yield) 2
Plastic Part of Pre-straining
The load during the plastic part of pre-straining,Ppl, can be
expressed as in equation (19), wheredpreis the diameter of
the effective section of the specimen due to pre-straining.
Ppl=σ π dpre2
4 (19)
State the constancy of specimen’s volume when plastic deformation takes place, equation (20) holds.
preLpre=yieldLyield (20)
Expressing equation (20) in the form of equation (21), it is possible to derivedpreas in equation (22).
πdpre
2
4 Lpre=π
del,yield2
4 Lyield (21)
dpre2=del,yield2 Lyield
Lpre
(22)
LpreandLyield are given in equation (23) and in
equa-tion (24), respectively, where L0 is the initial specimen gauge length.
Lpre=L0(1+el,yield+p) (23)
Lyield =L0(1+el,yield) (24)
Therefore,precan be obtained as in equation (25).
pre=
L0(1+el,yield) L0(1+el,yield+p)
(25)
el,yield is given in equation (26).
el,yield =π d02
4 (1−νel,yield) 2
(26)
ThusPplcan be expressed as in equation (27).
Ppl=σ π d02
4
1+el,yield
1+el,yield+p
(27)
Elastic Recovery Upon Unloading
Upon unload partial recovery ofel,yieldto elastic strain,el,
occurs, and the loadP can be expressed in its final version as in equation (28).
P =σ πd0
2 4
1+el
1+el+p
(28)
Sinceel is very small with respect toel,yield, it can be
neglected, and the load can be calculated as in equation (29).
P ≈σ πd0
2 4
1 1+p
(29)
References
1. Rouse JP, Cortellino F, Sun W, Hyde TH, Shingledecker J (2013) Small punch creep testing: review on modelling and data interpre-tation. Mater Sci Technol 29:1328–1345
2. Hyde TH, Sun W (2009) A novel, high sensitivity, small speci-men creep test. Journal of Strain Analysis for Engineering Design 44:171–185
3. Evans M, Wang D (2008) The small punch creep test: some results from a numerical model. J Mater Sci 43:1825–1835
4. Evans RW, Evans M (2006) Numerical modelling of small disc creep test. Mater Sci Technol 22:1155–1162
5. CEN (2006) CWA 15627 Workshop agreement: Small punch test method for metallic materials. European Commitee for Standardi-sation, Brussels
6. Hyde TH, Sun W, Ali BSM (2012) A small creep test specimen for use in determining uniaxial creep rupture data. IN: Matocha K, Hurst R, Sun W (eds) 2nd international conference SSTT determi-nation of mechanical properties of materials by small punch and other miniature testing techniques. Ostrava (CZ), pp 261–270 7. Blagoeva D, Li YZ, Hurst RC (2011) Qualification of p91 welds
through small punch creep testing. J Nucl Mater 409:124–130 8. G¨ulc¸imen B, H¨ahner P (2013) Determination of creep properties
of a p91 weldment by small punch testing and a new evaluation approach. Mater Sci Eng A 588:125–131
9. Holmstrom S, Auerkari P, Hurst R, Blagoeva D (2014) Using small punch test data to determine creep strain and strength reduction properties for heat affected zones. Mater Sci Technol 30:63–66 10. Baik JM, Kameda J, Buck O (1983) Small punch test
evalua-tion of intergranular embrittlement of an alloy steel. Scr Metall 17(12):1443–1447
11. Dobeˇs F, Miliˇcka K (2008) Comparison of conventional and small punch creep tests of mechanically alloyed Al–C–O alloys. Mater Charact 59(7):961–964
12. Bagloeva D, Li YZ, Hurst RC (2011) Qualification of P91 welds through small punch creep testing. J Nucl Mater 409(2):124– 130
13. Dym´aˇcek P (2016) Recent developments in small punch testing: applications at elevated temperatures. Theor Appl Fract Mech 86(Part A):25–33
14. Dym´aˇcek P, Dobes F (2012) Influence of atmosphere on small punch testing of p91 steel. In: Matocha K, Hurst R, Sun W (eds) 2nd international conference SSTT determination of mechanical properties of materials by small punch and other miniature testing techniques. Ostrava (CZ), pp 75–78
15. Dym´aˇcek P, Miliˇcka K (2008) Small punch testing and its numerical simulations under constant deflection force conditions. Strength of Materials 40:24–27
16. Dym´aˇcek P, Miliˇcka K (2009) Creep small-punch testing and its numerical simulations. Mater Sci Eng A 510–511:444–449 17. Hurst RC (2005) Standardisation - a route to enhancing the
accept-ability of the small punch creep test. In: ECCC creep conference. DEStech Publications, Inc, London
18. Li Y, Sturm R (2008) Determination of creep properties from small punch test. ASME Conf Proc 2008:739–750
19. Manahan MPS (1989) Mechanical behavior and swelling of tube scale from a pressurized water reactor steam generator using miniature specimens. J Nucl Mater 168:178–187
20. Miliˇcka K, Dobeˇs F (2006) Small punch testing of p91 steel. Int J Press Vessel Pip 83:625–634
22. Yang Z, Wang Z (2003) Relationship between strain and cen-tral deflection in small punch specimens. Int J Press Vessel Pip 80:397–404
23. Cortellino F (2015) Experimental and numerical investigation of small punch creep test. Ph.D Thesis, The Univeristy of Notting-ham
24. Cacciapuoti B, Sun W, McCartney DG (2016) A study on the evo-lution of the contact angle of small punch creep test of ductile materials. Int J Press Vessel Pip 145:60–74
25. Chakrabarty J (1970) A theory of stretch forming over hemispher-ical punch heads. Int J Mech Sci 12(4):315–325
26. Dobeˇs F, Miliˇcka K (2009) Application of creep small punch testing in assessment of creep lifetime. Materials Science and Engineering: A: Properties, Microstructure and Processing 510(11):440–443
27. Kobayashi KI, Kajihara I, Koyama H, Stratford GC (2010) Defor-mation and fracture mode during small punch creep tests. Journal of Solid Mechanics and Materials Engineering 4(1):75–86 28. Ma YW, Shim S, Yoon KB (2009) Assessment of power law creep
constants of Gr91 steel using small punch creep tests. Fatigue and Fracture of Engineering Materials and Structures 32:951– 960
29. Li DF, O’Dowd NP, Davies CM, Nikbin KM (2010) A review of the effect of prior inelastic deformation on high temperature mechanical response of engineering alloys. Int J Press Vessel Pip 87:531–542
30. Willis M, McDonaugh-Smith A, Hales R (1999) Prestrain effects on creep ductility of a 316 stainless steel light forging. Int J Press Vessel Pip 76:355–359
31. Wilshire B, Willis M (2004) Mechanisms of strain accumulation and damage development during creep of prestrained 316 stainless steels. Metall Mater Trans A 35:563–571
32. Wilshire B, Palmer CJ (2004) Strain accumulation during disloca-tion creep of prestrained copper. Mater Sci Eng A 387–389:716– 718
33. Hyde TH (1986) Anomalous creep behaviour of 316 stainless steel at 550◦C. High Temp Technol 4:25–29
34. Hyde TH (1997) Creep of 316 stainless steel at 550 and 600◦C and the effects of short duration overloads on creep at 550◦C. Materials at High Temperatures 14:27–35
35. Liu Y, Murakami S (1998) Damage localization of conventional creep damage models and proposition of a new model for creep damage analysis. JSME International Journal Series A 41:57–65 36. Saad AA, Hyde TH, Sun W, Hyde CJ, Tanner DWJ (2013)
Char-acterization of viscoplasticity behaviour of p91 and p92 power plant steels. Int J Press Vessel Pip 111–112:246–252
37. Cortellino F, Chen R, Sun W, Hyde TH (2014) A microscopic investigation on the failure mechanisms of small punch creep test of a p91 steel at 873 k. In: Matocha K, Hurst R, Sun W (eds) 2nd international conference SSTT determination of mechanical properties of materials by small punch and other miniature testing techniques. Graz (Austria), pp 260–269
38. Tai K, Endo T (1993) Effect of pre-creep on the succeeding creep behavior of a 2.25Cr-1Mo steel. Scripta Metallurgica et Materialia 29:643–646
39. Kobayashi M, Koyama H, Stratford GC, Tabuchi M (2012) Kaneko the influence of both testing environment and fillet radius of the die holder on the rupture life of small punch creep tests. Journal of Solid Mechanics and Materials Engineering 6(8):925– 934
40. Cortellino F, Sun W, Hyde TH (2016) On the effects of friction modelling on small punch creep test responses: a numerical inves-tigation. The Journal of Strain Analysis for Engineering Design 51(7):493–506
41. Dym´aˇcek P, Seitl S, Miliˇcka K, Dobeˇs F (2010) Influence of fric-tion on stress and strain distribufric-tions in small punch creep test models. Key Eng Mater 417–418:561–564
42. Hyde TH, Stoyanov M, Sun W, Hyde CJ (2010) On the interpreta-tion of results from small punch creep tests. The Journal of Strain Analysis for Engineering Design 45:141–164
43. Ling X, Zheng Y, You Y, Chen Y (2007) Creep damage in small punch creep specimens of Type 304 stainless steel. Int J Press Vessel Pip 84:304–309
44. Zhou Z, Zheng Y, Ling X, Hu R, Zhou J (2010) A study on influence factors of small punch creep test by experimental investigation and finite element analysis. Mater Sci Eng A 527:2784–2789 45. Cortellino F, Sun W, Hyde TH, Shingledecker J (2014) The
effects of geometrical inaccuracies of the experimental set-up on small punch creep test results. The Journal of Strain Analysis for Engineering Design 49:571–582
46. Hutchinson JW (1983) Constitutive behavior and crack tip fields for materials undergoing creep-constrained grain boundary cavi-tation. Acta Metallurgica 31(7):1079–1088
47. Riedel H (1987) Fracture at high temperatures. Springer 48. Lamaitre J, Chaboche JL (2000) Mechanics of solid materials.
Cambridge University Press
49. ABAQUS (2010) Theory manual. Dassault Syst `EMes Simulia Corp 50. Lin FH, Tseng AA (1998) A finite element analysis of elasto-plastic
contact problems in metal forming. Mater Des 19:99–108 51. Rouse JP, Sun W, Hyde TH (2013) The effects of scoop sampling
![Fig. 1 SEM image of the virgin P91 steel used for the tests, from Ref.[37]](https://thumb-us.123doks.com/thumbv2/123dok_us/8567940.367608/3.595.304.546.604.688/fig-sem-image-virgin-steel-used-tests-ref.webp)