A quantitative analysis of antibiotic usage in British sheep flocks
1
2
Authors: Davies PL1*,Remnant JG1, Green MJ1, Gascoigne E2,3, Gibbon NJ4, Hyde R1, Porteous JR5,
3
Schubert KL6, Lovatt FM1, Corbishley A7,8
4
* Corresponding author [email protected] 5
1 University of Nottingham, School of Veterinary Medicine and Science, Sutton Bonington,
6
Leicestershire LE12 5LJ 7
2 Synergy Farm Health Ltd, West Hill Barns, Evershot, Dorset DT2 0LD
8
3 RAFT Solutions Ltd, Mill Farm, Studley Road, Ripon, North Yorkshire HG4 2QR
9
4 Belmont Farm & Equine Ltd, 92 Belmont Road, Hereford, Herefordshire, HR2 7JS
10
5 Browne & McKinney, East View, Church St, Broughton-in-Furness LA20 6HJ
11
6 Torch Farm and Equine, 15 Habat Enterprise Park, Bideford, Devon, EX39 3HN
12
7 Dairy Herd Health and Productivity Service, Royal (Dick) School of Veterinary Studies, The
13
University of Edinburgh, Easter Bush, Midlothian, EH25 9RG, UK. 14
8 Division of Immunity and Infection, The Roslin Institute, The University of Edinburgh, Easter Bush,
15
Midlothian, EH25 9RG, UK. 16
Abstract
17
The aim of this study was to examine the variation in antibiotic usage between 207 commercial 18
sheep flocks using their veterinary practice prescribing records. Mean and median prescribed mass 19
per Population Corrected Unit (mg/PCU) was 11.38 and 5.95 respectively and closely correlated with 20
Animal Defined Daily Dose (ADDD) 1.47(mean), 0.74(median) (R2 = 0.84, p<0.001). This is low in
comparison with the suggested target (an average across all UK livestock sectors) of 50mg/PCU. In 22
total, 80% of all antibiotic usage occurred in the 39% of flocks where per animal usage was greater 23
than 9.0 mg/PCU. Parenteral antibiotics, principally oxytetracycline, represented 82% of the total 24
prescribed mass, 65.5% of antibiotics (mg/PCU) were prescribed for the treatment of lameness. Oral 25
antibiotics were prescribed to 49% of flocks, 64% of predicted lamb crop/farm. Lowland flocks were 26
prescribed significantly more antibiotics than hill flocks. Variance partitioning apportioned 79% of 27
variation in total antibiotic usage (mg/PCU) to the farm level and 21% to the veterinary practice 28
indicating that veterinary practices have a substantial impact on overall antimicrobial usage. 29
Reducing antibiotic usage in the sheep sector should be possible with better understanding of the 30
Introduction
32
Antibiotic usage in farmed species is under scrutiny because of increasing concern surrounding 33
antimicrobial resistance, with imprudent patterns of prescribing and use representing a potential 34
risk to human and animal health (O'Neill, 2015). 35
Antibiotic usage is measured across the EU at a national level using the metric of total mass (mg) of 36
any and all antibiotic active ingredients per Population Corrected Unit (mg/PCU). The PCU 37
denominator is calculated as a standardised figure for each farmed species for breeding and 38
slaughtered animals (EMA, 2013). There is significant variation between countries, with the UK’s 39
usage at 62.1 mg/PCU ranked 15th out of 26 EU countries in order of highest antibiotic usage (EMA, 40
2013). 41
The UK government has identified reducing antibiotic usage as a priority and has adopted the 42
mg/PCU metric to measure usage across all livestock sectors (UK Government, 2016) with a target 43
for UK livestock production set at 50mg/PCU. The UK is the 4th largest livestock producer in the EU 44
as calculated by PCU biomass (EMA, 2013) and the sheep industry in the UK is the largest in the EU. 45
The sheep sector is also the largest single sector of UK livestock agriculture, representing 40% of the 46
PCU biomass (EMA, 2013). For this reason, antibiotic usage in the UK sheep industry has a 47
disproportionate impact on the total mg/PCU figure for the whole UK livestock sector. 48
Species or sector specific targets are also expected to be set (UK Government, 2016), for which a 49
detailed understanding of current usage patterns is required in order to make informed decisions in 50
this area. To understand how to reduce antibiotic usage in each sector, we need to understand the 51
The aim of this study was to collate information from a large number of British sheep farms, 53
primarily to evaluate the magnitude and variation in antibiotic usage and secondarily to assess 54
factors that impact on farm level antibiotic usage. 55
Methodology
56
57
Farm selection criteria
58
Two hundred and seven anonymised flock records were collated from a convenience sample of eight 59
veterinary practices that were able to contribute sales and prescription records for all antibiotic 60
products supplied to a minimum of ten sheep farm enterprises which met specific selection criteria. 61
Practices were recruited with client farms located in the following regions: West Wales, Mid Wales, 62
Central Scotland and the following English regions: South West, South East, West Midlands, East 63
Midlands and North West. Each practice provided details of all antibiotic products and quantity 64
prescribed to all their sheep farming clients during the study period of August 2015-July 2016 along 65
with flock level information on breeding flock size, flock type (categorised as Hill (18), Upland (25), 66
Lowland (164)) and management system (Organic (11), Conventional (196)). A single, recent year 67
was selected for analysis to reduce recall bias in the recording of the breeding ewe flock size, which 68
were used as the denominator for antibiotic calculations. Data were requested from farms that 69
were sheep only holdings with a minimum of 100 breeding ewes; to avoid the risk of antibiotics 70
being used in other species the study was restricted to farms exclusively with sheep. A minimum 71
breeding ewe flock size was used to reduce the potential bias associated with unnecessarily large 72
pack sizes of antibiotic products being supplied for small flocks, where unused product could 73
represent a large proportion of the purchased total. The threshold also represented a reasonable cut 74
off for commercial vs leisure/hobby flocks. The flock size ranged from 100 to 4000 ewes, with a 75
mean and median size of 529 and 300 respectively. The threshold was selected based upon the 76
Calculation of antibiotic usage per population correction unit (PCU)
78
The mass of antibiotic active ingredients per PCU was calculated for each prescribed product using 79
the manufacturer supplied product specification and the ESVAC standard methodology (EMA, 2015) 80
using approximate average body weights of adults (75kg) and weighted average weight for 81
slaughtered lambs drawn from the Eurostat census. To calculate the lamb component of the PCU the 82
mean rearing % of lambs per ewe (143.5%) in the reference period was estimated using the UK levy 83
board benchmarking data (AHDB 2016) as a coefficient of the standard ESVAC lamb weight value 84
(20kg). This metric was applied to all flocks in the study. 85
The average ESVAC ewe and lamb weights were considered reasonable estimates for lowland flocks 86
by the authors, however breeds used in hill farming in UK systems are generally smaller and less 87
fecund than their lowland counterparts. To account for this potential bias, a sub-analysis was 88
conducted where a separate ‘Hill-PCU’ was used as the denominator for antibiotic usage in hill flocks 89
specifically. This was calculated based on a mature ewe body weight of 55kg, a lamb average body 90
weight of 16kg and a rearing percentage of 115% (Welsh Farm Survey, 2016). 91
Calculation of antibiotic usage by Defined Daily Doses (DDDvet), Defined Course Doses
92
(DCDvet) and Animal-Defined Daily Dose (ADDD).
93
Antibiotic usage at flock level was estimated using standardized methods as follows. The number of 94
Defined Daily Doses (DDDvet) and Defined Course Doses (DCDvet) as Animal Defined Daily Dose 95
(ADDD) per farm for the one year reference period were estimated for each farm. The breeding 96
female population was used as the flock denominator and a standardized body weight of adult 97
sheep of 75kg and was applied to convert the mg/kgBW into a per head unit in line with the 98
standardised methodology set out by the ESVAC (EMA/710019/2014)(EMA, 2015). For oral and 99
parenteral products DDDvet and DCDvet were calculated for each antibiotic product using either; (a) 100
the licenced recommended maintenance dose for sheep where available, (b) the licenced 101
product] where the product used was not licenced for sheep but prescribed under the Veterinary 103
Medicines Directorate ‘cascade’. Topical preparations were excluded from the calculation of DDDvet 104
and DCDvet in line with the ESVAC methodology. All products and preparations, including topical 105
and oral preparations, were included in the mg/PCU metric. The ADDD metric was generated for 106
comparison with mg/PCU and was calculated as previously described (Bos et al., 2013) and used for 107
comparison of antibiotic usage in dairy herds (Kuipers, Koops, & Wemmenhove, 2016). An additional 108
Lamb DCDvet metric was calculated for oral antibiotics licenced exclusively for neonatal lambs 109
where dose was independent of body weight. These products were assigned a lamb DCDvet per 110
animal rather than mg/kg body weight. In this study, the dose rates for these products were 111
calculated on a fixed volume per animal as directed by manufacturer recommendations, rather than 112
mg/kg bodyweight. The number of lamb DCDvet doses was then divided by the breeding ewe 113
population per farm to generate an index of lamb doses per breeding ewe per flock. 114
Statistical modelling
115
A Linear regression model was used to assess the correlation between mg/PCU, ADDD (DDDvet and 116
DCDvet) using MiniTab17 (Minitab 17 Inc, 2015). A multivariable regression model was developed 117
with antibiotic use (mg/PCU) as the response variable. A multi-level structure was used to account 118
for correlations in antibiotic use between farms, within a veterinary practice. The number of 119
breeding ewes, farm type (organic, conventional) and farm stratification (Lowland, Upland, Hill) were 120
forced into the model. Based on the a priori hypotheses of this study, all variables were retained in 121
the model. The model was built using MLwiN version 2.36 (Charlton, et al, 2017) and parameter 122
estimates generated using iterative generalised least squares (IGLS). Model fit was assessed by 123
examining q-q plots of residuals. The mg/PCU of antibiotic calculated for each farm were 124
transformed to meet the assumptions of the multivariable regression model. The optimal 125
transformation (mg/PCU to the power 0.28) was calculated using the boxcox function in the MASS 126
package in R (Venables, W. N. & Ripley, 2002). Variance partition coefficients (VPCs) were calculated 127
and veterinary practice level. To facilitate interpretation of the final model, predictions were 129
calculated by fixing explanatory variables at their mean value except the variable of interest. 130
Predictions and their corresponding confidence interval estimates were back transformed to the 131
mg/PCU scale. 132
Antibiotic use by disease
133
Analysis of the disease for which each antibiotic product was prescribed was possible for 24 flocks 134
from one practice that routinely and accurately collected this information. Diseases were 135
categorised for comparison of antibiotic usage by antibiotic class in mg/PCU. Disease incidence rates 136
were estimated for the two most common prescribed reasons for antibiotic usage, using the DCDvet 137
metric and the following assumptions: licenced dose rate was used for each dose, 75kg ewe body 138
weight for each administered dose, all doses administered to ewes not lambs, zero wastage of 139
antibiotic product. 140
Results
141
142
Distribution of total antibiotic usage per farm and comparison of metrics.
143
Flock usage of antibiotics during the reference period ranged from 0 mg/PCU to 116.9 mg/PCU, with 144
a mean of 11.38 (sd = 15.35) and median of and 5.95 (IQR = 2.47 – 13.95) mg/PCU respectively. 4.3% 145
of flocks recorded no antibiotic prescriptions during the reference period, while 1.9% of flocks 146
recorded over 50 mg/PCU (Figure 1). In total, 80% of all antibiotic usage occurred in the 39% of 147
flocks where per animal usage was greater than 9.0 mg/PCU 148
Antibiotic usage at the farm level, using the ADDD metric, calculated using the DDDvet method 149
indicated mean daily doses per animal of 1.47 (sd = 2.1) and a median of 0.74 (IQR = 0.299 – 1.97). 150
Mean and median usage as calculated by DCDvet per ewe per flock were 0.39 (sd = 0.53) and 0.20 151
Correlation between mg/PCU and ADDD using DDDvet for farms in this study was R2 = 0.84
153
(P<0.001). The correlation between mg/PCU and ADDD using DCDvet was R2 = 0.77 (P<0.001). There
154
was no significant correlation between Lamb DCDvet and any of the other metrics. 155
156
Distribution of antibiotic usage by antibiotic group
157
The mass of antibiotic products prescribed were ranked by antibiotic class (Table 1). The most 158
commonly prescribed antibiotic was oxytetracycline, which comprised 57.4% of the total, followed 159
by penicillin (including extended spectrum penicillins) 23.7%, aminoglycosides 10.7%, lincomycin 160
4.7%, macrolides 1.7%, fluoroquinolones 0.5% and florfenicol 0.5%, with the remaining 0.9% being 161
made up of cephalosporins, sulphonamides, trimethoprim and thiamphenicol. 162
Distribution of antibiotic usage by route of administration
163
Parenterally administered products represented 84.4% of the total mass used, whilst topical 164
preparations represented 12.3% and oral represented 3.3% of the total mg/PCU (Table 1). 165
Table 1 Percentage distribution of antibiotic prescriptions by mass (mg/PCU), antibiotic class and administration route per
166
class across all farms.
167
Antibiotic class Administration route (% of each class) % of Total mass of all
classes Oral Parenteral Topical
Oxytetracycline 91% 9% 57.4%
Penicillin (inc extended
spectrum) 98% 2% 23.6%
Aminoglycoside 29% 66% 6% 10.7%
Lincomycin 100% 4.7%
Macrolides 60% 40% 1.7%
Florfenicol 100% 0.5%
Fluoroquinolones 38% 62% 0.5%
Other 25% 55% 21% 0.9%
168
Comparison of antibiotic group and route of administration between 1
stand 4
th170
quartile (high and low users)
171
A comparison was made between the antibiotic usage of the upper quartile of flocks (Q1) (High 172
users >13.95mg/PCU) and lower quartile flocks (Q4) (Low users < 2.47 mg/PCU). All the antibiotic 173
classes were represented in the Q1 group of flocks, however the Q4 group used fewer antibiotic 174
classes (oxytetracycline, penicillin (including extended spectrum), aminoglycosides, lincomycin). The 175
total usage of all of these individual classes was significantly lower in Q4 compared to Q1. There was 176
no significant difference in the proportional usage of antibiotic classes i.e. oxytetracycline was still 177
the predominant antibiotic used, followed by penicillins, or in administration route. 178
Seasonality of antibiotic usage by antibiotic group
179
Antibiotic prescriptions were distributed throughout the year with a significant increase in spring 180
along with a significant relative increase in the mg/PCU of penicillins and aminoglycosides (Figure 2). 181
Oxytetracycline usage also increased in the spring but to a lesser extent than the increase observed 182
with penicillin and the aminoglycosides. February was the only month in which oxytetracycline was 183
surpassed by penicillins as the most commonly prescribed antibiotic class. All of the oral 184
aminoglycoside antibiotics (neomycin and spectinomycin) were prescribed during the spring months, 185
which coincides with the majority of lambing periods in UK flocks. 186
187
Oral antibiotic usage in lambs
188
In this study, 47% (95% CI: 41% - 62%) of flocks used oral antibiotics licenced for 189
treatment/prophylaxis of colibacillosis in lambs. A further 2% of flocks, (4 farms from 2 practices) 190
were prescribed oral antibiotic tablets. Of the lowland flocks sampled, 77% (95% CI: 42% - 90%) were 191
prescribed oral antibiotics, whereas 44% (95% CI: 41% - 69%) of upland flocks and 25% (95% CI: 17% 192
were explicitly only approved for use in neonatal lambs. In those flocks using oral antibiotics, the 194
mean number of lamb oral antibiotic doses prescribed per ewe per flock was 1.23 (95% CI: 0.034, 195
5.181) and median of 0.92 (95% CI: 0.8, 1.2) doses per ewe per flock. 196
Topical antibiotic preparations
197
Topical antibiotic preparations were assigned to one of three catagories for comparison of the 198
percentage prescribed total mass (mg/PCU) across all farms: ophthalmic preparations (4%), aerosol 199
sprays (45%) and soluble powders (51%). Ophthalmic preparations were prescribed to 22% of farms, 200
aerosol sprays were prescribed to 47% of farms and soluble powders were prescribed to 7% of 201
farms. DDDvet and DCDvet metrics were not established for topical preparations in line with EMA 202
standard methodology. 203
Farm Stratification
204
Considerable variation was observed in antibiotic usage between farms both within and between 205
farm stratification categories (Figure 3). The distributions of mg/PCU within all categories of farm 206
were positively skewed. 207
208
Multivariable analysis: Influence of veterinary practice, management system and farm
209
stratification on antibiotic use
210
Accounting for influence of practice in the multi-level model structure, lowland farms were shown to 211
use significantly more antibiotics (mg/PCU0.28) than hill farms (p=0.02), principally due to higher
212
usage of parenteral oxytetracycline. When a ‘Hill-PCU’ coefficient (accounting for the lower body 213
weights and lamb output) was applied to the antibiotic usage of hill flocks as opposed to the 214
standard PCU coefficient appropriate to lowland flocks, a significantly lower antibiotic usage in hill 215
flocks was still identified (p = 0.03). There was a non-significant trend for organic farms to use less 216
mg/PCU0.28 occurred between veterinary practices, with the remaining 79% of variation being
218
between farms. Additional detail on model results are provided in supplementary material. 219
220
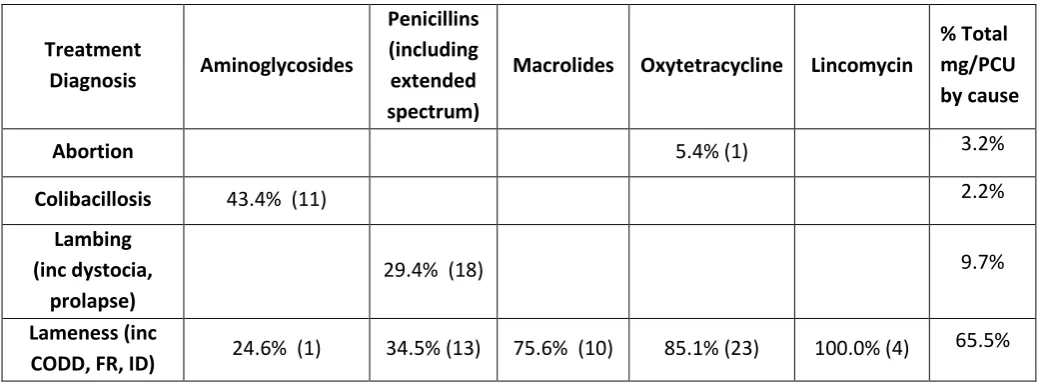
Distribution of antibiotic usage by clinical diagnosis
221
A subset analysis of antibiotic class prescription patterns by clinical diagnosis was conducted on the 222
data supplied by one veterinary practice with unusually detailed records of all antibiotics prescribed. 223
Analysis of these 24 flocks data revealed that lameness accounted for 65.5% of antibiotics prescribed 224
by this practice (Table 2) and oxytetracycline was the most commonly prescribed antibiotic 225
accounting for 63.5% of the total, followed by penicillins (26.8% of total). Penicillins were prescribed 226
for the widest range of clinical diagnoses (9 of 11 disease categories, Table 2), while oxytetracycline 227
was prescribed for 4 of 11 categories and 85.1% of all oxytetracycline was prescribed for treatment 228
of lameness (Table 2). The mean proportion of oxytetracycline prescribed for the treatment of 229
[image:11.595.71.590.570.762.2]lameness per farm was 91% (95% CI: 81%, 99%). 230
Table 2. Antibiotic prescription patterns by diagnosis from a subset of 24 flocks supplied by one veterinary practice with
231
unusually detailed prescription records. The proportions of antibiotics per class prescribed for each diagnosis are stated as a
232
percentage of the total prescribed for that antibiotic class. The number of flocks prescribed a given class for a given
233
diagnosis is stated in brackets. The Lameness category includes Contagious Ovine Digital Dermatitis, Footrot and
234
Interdigital Dermatitis.
235
Treatment
Diagnosis Aminoglycosides
Penicillins (including extended spectrum)
Macrolides Oxytetracycline Lincomycin
% Total mg/PCU by cause
Abortion 5.4% (1) 3.2%
Colibacillosis 43.4% (11) 2.2%
Lambing (inc dystocia,
prolapse)
29.4% (18) 9.7%
Lameness (inc
Listeriosis 0.3% (1) 0.1%
Mastitis 10.3% (4) 3.4%
Metritis 0.4% (1) 0.1%
Ophthalmic 1.7% (5) 9.2% (4) 6.0%
Pneumonia 0.4% (1) 0.3% (1) 0.3%
Polyarthritis 32.0% (2) 18.8% (9) 24.4% (4) 8.2%
Not recorded 4.3% (5) 1.4%
% Total mg/PCU by antibiotic
class
2.0% 26.8% 6.3% 63.5% 1.3%
236
Incidence of lameness treatments and treatments associated with lambing were estimated using the 237
DCDvet for each flock (Table 3). DCDvet based estimates of lameness incidence between farms 238
indicate a wider and higher range of treatment rates for lameness with a median of 29.6 ewe 239
[image:12.595.65.584.71.297.2]treatment DCDvet per 100 ewes per year. 240
Table 3 Disease incidence estimates for lameness and lambing associated events based upon prescribed antibiotic DCDvet
241
values for parenteral antibiotics prescribed for each.
242
Mean Median Range
Parenteral treatments for lameness
42.7 ewe treatment DCDvet per 100 ewes per year
29.6 ewe treatment DCDvet per 100 ewes per year
9.6 – 67.0
Parenteral treatments for lambing associated events (including dystocia, prolapse)
7.8 ewe treatment DCDvet per 100 ewes per year
6.8 ewe treatment DCDvet per 100 ewes per year
3.2 – 10.3
243
Discussion
244
245
The results of this study suggest that antibiotic use in all sectors and management systems of the UK 246
UK livestock sectors in 2015 (UK government VARSS 2015). The relatively low usage of antibiotics in 248
the sheep sector should not give rise to complacency. This study highlights a number of areas where 249
potential improvements in our use and monitoring of antibiotics can be made. 250
If antibiotic usage is to be reduced in line with the stated EU and UK policy statements (UK 251
Government, 2016) then it would be logical to target those diseases which drive highest usage with a 252
‘Refine, Reduce, Replace’ strategy, whilst keeping in mind the other priorities, principally animal 253
welfare. In identifying the most appropriate strategy for minimising any potential antibiotic 254
resistance selection risk, the metric used needs to be appropriate. It would be counterproductive if a 255
targeted adoption of one metric, led inadvertently, to antibiotic use patterns that did not reflect the 256
best evidence based clinical practice or neglected high risk antibiotic use. 257
It should be noted that the dominance of parenteral oxytetracycline and to a lesser extent penicillins 258
identified in this study resulted in a close correlation between the two main metrics for antibiotic 259
usage; Population Corrected Unit (PCU) and Animal Defined Daily Dose ADDD (DCDvet/DDDvet). The 260
close correlation between mg/PCU and ADDD (DDDvet/DCDvet) in the sheep sector may be very 261
helpful in simplifying monitoring of antibiotic usage, however the use of oral aminoglycosides in 262
neonatal lambs and the use of soluble antibiotic powders for topical use in footbaths or hand sprays 263
to control lameness (particularly contagious ovine digital dermatitis (CODD)) present two important 264
challenges that may be obscured by the scale of oxytetracycline use. Both of these practices have 265
the potential to subject a larger proportion of the flock, as well as the wider farm environment, to 266
antibiotic resistance selection, than targeted individual parenterally administered treatments. 267
Overall, 79% of the variation in antibiotic usage observed between flocks was attributable to 268
differences between farms. These are likely to include a combination of biological and management 269
differences, which influence the force of infection and genetic differences in disease susceptibility to 270
infection. However, the between farm variation in antibiotic use will also likely be influenced by the 271
have demonstrated differences in attitude to population health management between sheep and 273
pig farmers (Garforth, Bailey, & Tranter, 2013). In the context of antibiotic usage this study has 274
demonstrated that flock type (Hill, Upland, Lowland) was significantly associated with different 275
levels of antibiotic use and the basis for these differences warrant further investigation. 276
There was an important further 21% of variation attributable to the veterinary practice serving the 277
individual flocks after the effects of stratification, region, flock size and management system were 278
accounted for. This suggests there is an important influence of practice prescribing policy and 279
practice culture on the quantity of antibiotics prescribed for sheep. Reasons for these differences 280
cannot be elucidated from the current study and this would be a worthwhile topic for future 281
research. Surveys that rely on the voluntary contribution of data from participants (veterinary 282
practices in this case) are subject to bias and it is unclear the extent to which this convenience 283
sample is representative of the national flock. With the current absence of a universal, robustly 284
audited, mandatory reporting system of antibiotic use/prescription, these study findings represent 285
initial data that may indicate current prescription patterns in the UK sheep industry. Further studies 286
that incorporate true random sampling would be of value. 287
The subset analysis of antibiotic prescriptions per disease process from one practice (24 flocks) 288
suggested that the pattern of antibiotic usage across the 24 flocks was comparable to the dataset as 289
a whole in terms of overall usage per flock, relative usage by antibiotic classes and seasonality of 290
usage. It would therefore seem reasonable to conclude that some useful estimates of the disease 291
diagnosies underpinning antibiotic usage may be drawn from this subset of data. Principally the 292
treatment of lameness was the most common reason for the use of antibiotics (mainly 293
oxytetracycline) in sheep flocks, accounting for approximately 65 % of total mg/PCU. This result is 294
not surprising given the prevalence of footrot, interdigital dermatitis and contagious ovine digital 295
identified in this study, it should also be recognised that records from one veterinary practice may 297
not be representative of practices in general. 298
Prompt parenteral antibiotic treatment (PAT) forms part of the accepted best practice guidelines for 299
the control of footrot (Kaler et al, 2010) and has been shown to reduce the prevalence of footrot in 300
flocks. In many upland and hill flocks, where grazing management is more extensive and PAT is not 301
practical, regular periodic treatment with parenteral antibiotics has also been suggested to be 302
effective in reducing lameness prevalence (Angell & Duncan, 2015). The authors suggest that some 303
of the significant variation observed in this study between lowland and hill flocks in the usage of 304
oxytetracycline may be due to the greater difficultly in adopting PAT protocols for lameness 305
management in comparison to their lowland counterparts. Infection pressure and risk of clinical 306
disease may also vary between these hill and lowland farms. 307
Whilst lameness prevalence is referred to widely (J. R. Winter, Kaler, Ferguson, Kilbride, & Green, 308
2015), there is little published data on the incidence rates of lameness in commercial flocks under 309
typical management conditions. The extrapolated treatment rate calculated in this study from the 310
subset of 24 flocks with detailed diagnosis data on each antibiotic product unit is an attempt to use 311
readily available data to provide a crude estimate of treatment rate as a proxy for disease incidence. 312
Accepting that the treatment rate measure used makes several key assumptions as detailed 313
previously, the high median treatment rates of 29.6 cases per 100 ewes per year and wide range 314
between farms may represent a reasonable benchmark when considering appropriate strategies for 315
lameness control. 316
Whilst the use of parenteral oxytetracycline would seem most plausibly attributed to its perpetual 317
use in the control of infectious lameness a small seasonal increase observed in February and March 318
could be attributed, at least in part, to the prophylactic or metaphylactic use in the control of 319
Chlamydophila abortus. This use of oxytetracycline was estimated in this study at 5% of flocks (table
320
Oral aminoglycosides are licenced for the treatment and/or prophylaxis of enteric E.coli infections in 322
neonatal lambs. The ESVAC methodology for calculating DDDvet and DCDvet values for oral 323
antibiotics dramatically underestimate the number of individuals and thus the proportion of the 324
population that are treated. For this reason it seems logical that neonatal antibiotic preparations 325
should be recorded as a ‘per animal’ dose rather than as mg/kg body weight. In this study, 49% of 326
farms were prescribed oral antibiotics. Extrapolating from the UK benchmarked mean rearing 327
percentage of lambs per ewe (143.5%), the mean and median doses per lamb reared per flock using 328
oral antibiotics is approximately 0.86 and 0.64 respectively. 329
The most common aminoglycoside antibiotic preparation prescribed in this study is also licenced for 330
use in piglets. In piglets, the exposure of the developing gastrointestinal flora to antibiotics has been 331
shown to have enduring effects on the microbiota (Schokker et al, 2015). It is unclear if similar 332
results would be expected in ruminant species. It has been shown that there is significant variation 333
in microbiota between calves from different beef herds (Weese & Jelinski, 2017) and early life 334
exposure of calves to antibiotics was hypothesised as a potential contributory factor. More research 335
is required to understand the dynamics of the microbiota development in lambs and what affect 336
peri-natal antibiotic treatment may have on antimicrobial resistance as well as their long term 337
health. 338
Topical use of antibiotics presents a different but no less important challenge. Topical antibiotic 339
preparations are excluded from ESVAC DDDvet/DCDvet metrics, however in the sheep and cattle 340
industries, these products are commonly used both in antibiotic footbaths and also as topical sprays, 341
primarily for the treatment of pathogens causing lameness. A wide range of soluble antibiotic 342
products including macrolides, aminoglycosides, lincomycin and fluoroquinolones were prescribed 343
to a small proportion of flocks (7%). In the authors’ experience, these products, licenced for oral 344
administration to pigs, poultry and calves, are prescribed overwhelmingly for the treatment and 345
lameness is a well-established clinical approach for CODD in sheep and the cattle equivalent 347
condition, digital dermatitis, in the UK and internationally (Laven & Logue, 2006; A. C. Winter, 348
2011).In the case of CODD in particular, there is no published evidence to support this form of use, 349
whilst the evidence to support the use of antibiotic footbaths to control of digital dermatitis in cattle 350
is weak. The lack of an evidence base to guide decisions on dose rate and effective application 351
protocols raises the possibility that sub-therapeutic dosing may be common in this clinical scenario, 352
whilst spent footbath solutions are commonly discharged into slurry or the environment. It must be 353
recognised that in addition to the causative pathogens, a wide variety of other bacterial species on 354
the foot and in the soil environment will also be exposed as a result of the use of these antibiotic 355
products in this way. This is an undesirable and potentially imprudent use of antibiotics, which is 356
difficult to justify unless substantially better welfare outcomes can be demonstrated compared to 357
targeted treatment with parenteral antibiotics, which is known to be highly efficacious (Duncan et al. 358
2011, 2012, Angell et al, 2014, Angell & Duncan, 2015). CODD is estimated to affect approximately 359
35% of UK flocks (Angell et al, 2014) Assuming a similar prevalence of CODD for the flocks in this 360
study, it can be inferred that the majority of CODD affected flocks are not using antibiotic footbaths 361
to control this disease on a regular basis. 362
It cannot be assumed that low antibiotic usage correlates with low disease or good welfare and 363
there is a great danger in conflating the two measures. Low, targeted usage of antibiotics in all 364
veterinary species is desirable but this must be balanced with concern for animal welfare and 365
sustainable productivity. This study has demonstrated significant variation in antibiotic usage 366
between farms and between veterinary practices. Further research is required to understand the 367
biological, managemental and physiological drivers of antibiotic prescription and use among sheep 368
farmers and their prescribing veterinary surgeons in order to achieve a sustainable reduction in 369
antibiotic use. 370
Figures
372
373
Figure 1 Distribution of antibiotic usage in total mg/PCU from 207 individual sheep flocks in England,
374
Wales and Scotland compiled from prescribing records of eight veterinary practices over a 12 month
375
period from 1st August 2015 to 31st July 2016.
376
377
Figure 2 Percentage of total antibiotic usage mg/PCU per month for all flocks by antibiotic class.
378
379
Figure 3 Distribution of flock antibiotic usage in mg/PCU by farm stratification. Box indicates the
380
interquartile range. Whiskers indicate upper and lower quartiles excluding outliers calculated as
381
those > 1.5 IQR from Q1/Q2 or Q3/Q4 boundary. Median is identified by horizontal line, mean is
382
identified by black diamond.
383
References
384
385
Angell JW, Grove-White DH and Duncan JS 2015. Sheep and farm level factors associated with 386
contagious ovine digital dermatitis: a longitudinal repeated cross-sectional study of sheep on six 387
farms. Prev Vet Med 122, 107-120.Angell, J. W., Duncan, J. S., Carter, S. D., & Grove-white, D. H. 388
(2014). Farmer reported prevalence and factors associated with contagious ovine digital dermatitis 389
in Wales : A questionnaire of 511 sheep farmers. Prev Vet Med, 113(1), 132–138. 390
http://doi.org/10.1016/j.prevetmed.2013.09.014 391
Bos, M. E. H., Taverne, F. J., Geijlswijk, I. M. Van, Mouton, J. W., Mevius, D. J., Heederik, D. J. J., & 392
Netherlands : Quantitative Results of Nationwide Collection of Data in 2011, PLOS One 8(10). 394
http://doi.org/10.1371/journal.pone.0077525 395
Duncan JS, Grove-White D, Moks E, Carroll D, Oultram JW, Phythian CJ and Williams HW 2012. 396
Impact of footrot vaccination and antibiotic therapy on footrot and contagious ovine digital 397
dermatitis. Veterinary Record 170, 462. 398
Duncan JS, Grove-White D, Oultram JW, Phythian CJ, Dijk JV, Carter SD, Cripps PJ and Williams HJ 399
2011. Effects of parenteral amoxicillin on recovery rates and new infection rates for contagious 400
ovine digital dermatitis in sheep. Veterinary Record 169, 606. 401
EMA - European Medicines Agency. (2013). Sales of veterinary antimicrobial agents in 26 EU / EEA 402
countries in 2013 Fifth ESVAC report. 403
EMA - European Medicines Agency. (2015). Principles on assignment of defined daily dose for 404
animals (DDDA ) and defined course dose for animals ( DCDA ) Table of contents, 44(March), 1–64. 405
Garforth CJ, Bailey AP and Tranter RB 2013. Farmers' attitudes to disease risk management in 406
England: a comparative analysis of sheep and pig farmers. Prev Vet Med 110, 456-466 407
Kaler J, Daniels JL, Wright JL and Green LE 2010. Randomized clinical trial of long-acting 408
oxytetracycline, foot trimming, and flunixine meglumine on time to recovery in sheep with footrot. 409
Journal of Veterinary Internal Medicine 24, 420-425.Kuipers, A., Koops, W. J., & Wemmenhove, H. 410
(2016). Antibiotic use in dairy herds in the Netherlands from 2005 to 2012. Journal of Dairy Science, 411
99(2), 1632–1648. http://doi.org/10.3168/jds.2014-8428 412
Laven, R. A., & Logue, D. N. (2006). Treatment strategies for digital dermatitis for the UK, Veterinary 413
Journal: 171, 79–88. http://doi.org/10.1016/j.tvjl.2004.08.009 414
MLwiN Version 3.00, Charlton, C., Rasbash, J., Browne, W.J., Healy, M. and Cameron, B. (2017). 416
Schokker, D., Zhang, J., Vastenhouw, S. A., & Heilig, H. G. H. J. (2015). Long-Lasting Effects of Early-417
Life Antibiotic Treatment and Routine Animal Handling on Gut Microbiota Composition and Immune 418
System in Pigs, (day 55),PLOS One: 1–18. http://doi.org/10.1371/journal.pone.0116523 419
Stocktake report 2016. (2016), www.AHDB.co.uk. 420
Timmerman, T., Dewulf, J., Catry, B., Feyen, B., Opsomer, G., Kruif, A. De, & Maes, D. (2006). 421
Quantification and evaluation of antimicrobial drug use in group treatments for fattening pigs in 422
Belgium, Prev Vet Med: 74, 251–263. http://doi.org/10.1016/j.prevetmed.2005.10.003 423
VARSS report 2015: https://www.gov.uk/government/publications/veterinary-antimicrobial-424
resistance-and-sales-surveillance-2015 425
Venables, W. N. & Ripley, B. D. (2002). MASS Package in R. 426
Weese, J. S., & Jelinski, M. (2017). Assessment of the Fecal Microbiota in Beef Calves, Journal of 427
internal veterinary medicine, 176–185. http://doi.org/10.1111/jvim.14611 428
Welsh Farm Survey 2016, TABLE B3 . Hill sheep farms Farm Business Income TABLE B3. Hill sheep 429
farms 1 . Under 28 ESU, Aberystwuth University. 430
Winter, A. C. (2011). Treatment and control of hoof disorders in sheep and goats, Vet Clin North Am 431
Food Anim Pract: 27, 187–192. http://doi.org/10.1016/j.cvfa.2010.10.018 432
Winter, J. R., Kaler, J., Ferguson, E., Kilbride, A. L., & Green, L. E. (2015). Changes in prevalence of , 433
and risk factors for , lameness in random samples of English sheep flocks : 2004 – 2013, Prev Vet 434
Med 122, 121–128. 435