EARTHQUAKE ENGINEERING AND STRUCTURAL DYNAMICS Earthquake Engng Struct. Dyn. 0000; 00:1–24
Published online in Wiley InterScience (www.interscience.wiley.com). DOI: 10.1002/eqe
Influence of Earthquake Ground-Motion Duration on Damage
Estimation: Application to Steel Moment Resisting Frames
Andre R. Barbosa
1∗Filipe L.A. Ribeiro
2and Luis A.C. Neves
31
Assistant Professor, School of Civil and Construction Engineering, Oregon State University, U.S.A.
2
Ph.D. Student, UNIC, Department of Civil Engineering, Universidade Nova de Lisboa, Portugal. Visiting Ph.D. Student, School of Civil and Construction Engineering, Oregon State University, U.S.A.
3
Lecturer, Nottingham Transport Engineering Centre (NTEC), University of Nottingham, U.K.
SUMMARY
This paper presents an analytical study evaluating the influence of ground motion duration on structural damage of 3-, 9-, and 20-story SAC steel moment resisting frame (SMRF) buildings designed for downtown Seattle, Washington, USA, using pre-Northridge codes. Two-dimensional nonlinear finite element models of the buildings are used to estimate the damage induced by the ground motions. A set of 44 ground motions is used to study the combined effect of spectral acceleration and ground motion significant duration on drift and damage measures. In addition, 10 spectrally equivalent short duration shallow crustal ground motions and long duration subduction zone records are selected to isolate duration effect and assess its effect on the response. For each ground motion pair, incremental dynamic analyses are performed at at least twenty intensity levels and response measures such as peak inter-story drift ratio and energy dissipated are tracked. These response measures are combined into two damage metrics that account for the ductility and energy dissipation. Results indicate that the duration of the ground influences, above all, the combined damage measures, although some effect on drift-based response measures is also observed for larger levels of drift. These results indicate that since the current assessment methodologies do not capture the effects of ground motion duration, both performance-based and code-based assessment methodologies should be revised to consider damage measures that are sensitive to duration. Copyright c0000 John Wiley & Sons, Ltd.
Received . . .
KEY WORDS: Damage, Fatigue, Long-duration ground motions, Steel Moment Frames, Subduction Zone Earthquakes
1. INTRODUCTION
The effects of earthquake duration on civil engineering structures has been addressed only in the last quarter century and consensus within the scientific community is yet to be reached [1]. Longer earthquakes have been shown to increase the risk of failure on liquefaction [2] and slope instability [3] problems. However, early studies on the sensitivity of structural response to ground motion duration reported mixed results [4, 5, 6, 7]. These mixed results, together with the lack of ground motion records for large magnitude subduction events, lead to seismic design code provisions considering only effects of short duration earthquakes [8]. Among the works available in the literature that address the effects of duration on structural response, the main observations can be classified into two groups. First, studies that employ response measures
∗Correspondence to: Andre R. Barbosa, School of Civil and Construction Engineering, Oregon State University,
101 Kearney Hall, Corvallis, OR 97331-3212, USA. E-mail: [email protected]. Office Phone: 541-737-7291. Fax: 541-737-3052
Copyright c0000 John Wiley & Sons, Ltd.
based on peak displacement demands, such as peak drift ratios, generally do not find strong correlation between duration and the magnitude of the response (e.g., [9, 10]). Second, studies that employ cumulative response measures such as number of inelastic cycles, cumulative inelastic strains, and hysteretic energy dissipated, find a positive correlation between ground motion duration and structural response measures (e.g., [11, 12, 13]), showing that longer duration ground motions cause collapse at lower intensities [13]. These conclusions are also supported by other authors [9, 14, 15]. Even though the cumulative damage induced by the ground motion has been shown to be dependent on the amplitude, source-to-site distance, fault type, as well as the duration of the ground motion, it is not trivial to decouple the specific influence of duration.
Due to the increase in available ground motion data from recent subduction zone earthquakes, mainly from Japan and Chile, ground motion records from large subduction zone megathrust earthquakes can now be used [16, 17, 18, 13]. To isolate the effects of ground motion duration, Foschaar et al. [17] and Chandramohan et al. [19], for example, selected ground motions with similar spectral shape and studied the relationship between the response and different intensity measures of ground motion duration.
The objective of this paper is to better understand differences in structural damage on 3-, 9-, and 20-story ductile steel moment resisting frames (SMRF) when subjected to long duration or short duration earthquake ground motions. The SMRFs are part of the SAC steel project and correspond to buildings located in Seattle, Washington, designed using pre-Northridge codes. These three buildings are representative of the design practice in the US for decades, and the conclusions of this work can be significant in the assessment/retrofit of thousands of buildings. Two-dimensional nonlinear finite element models of the buildings are developed in OpenSees [20] and are validated against data available in the literature [21]. A database of 44 ground motions is used to assess the combined influence of ground motion duration and spectral acceleration on structural response. To isolate the effects of duration, 10 spectrally equivalent ground motion pairs are selected from the initial database of 44 ground motions following a procedure proposed in Chandramohan et al. [19]. Structural response is investigated in terms of deformation, energy dissipation, number of inelastic cycles, and damage state. To track damage, the Park and Ang [22] and Reinhorn and Valles [23] damage indices are used. The results show that buildings with different number of stories display different deformation and energy dissipation distributions that significantly affect their post-earthquake structural damage and that increases in ground motion duration produce increases in accumulated damage.
2. DAMAGE INDICES
INFLUENCE OF EARTHQUAKE GROUND-MOTION DURATION ON DAMAGE ESTIMATION 3
minimum secant stiffness recorded, i.e. the stiffness at the most damaged state attained, and the secant stiffness at the onset of failure. In the second group, some damage indices consider explicitly the energy dissipated as the measure of the severity of inelastic response [27, 28], while some others consider the number and amplitude [29, 30], or even the history of the inelastic cyclic response [31]. These indices focus on the effects of cumulative loading and combine inelastic measures of the response to account for fatigue, namely low-cycle fatigue [32]. In the third and last group, the response parameters considered individually in each of the former groups are merged into single indices. For example, Park and Ang [22] defined a damage index that is a linear combination of the ratio of the peak observed to ultimate deformation and hysteretic energy dissipated. Reinhorn and Valles [23, 33, 34] developed an index entitled Fatigue Based Damage Model that models the damage due to low plastic cycles fatigue. The Reinhorn and Valles index, which was calibrated with experimental data, is based on an initial development by [22].
The damage index proposed by Park and Ang [22] is given by:
DIP A= dm du +β
R
Eh
du×Fy (1)
where Fy is the yield strength,dm is the maximum attained deformation,du is the ultimate
deformation under monotonic loading, β is the empirical non-negative strength deteriorating
constant, and R
Eh denotes the hysteretic energy dissipated during the cyclic loading. β
depends on the value of shear and axial forces in the section and, for RC components, on the total amount of longitudinal and confining reinforcement. Available test data for 402 RC components of rectangular cross-sections and 132 steel specimens of H-shaped sections tested
in the U.S. and Japan were used to estimate β, resulting in a value of β = 0.05 for concrete
structures andβ = 0.025 for steel structures [35, 36].
The index proposed by Reinhorn and Valles [23] is based on the product of the ratio of the maximum to ultimate deformations and a low inelastic cyclic fatigue rule calibrated by the authors using experimental data. This index is given by:
DIRV =
0, (dm−dy)≤0
dm−dy du−dy ×
1
1− R
Eh
4×(du−dy)×Fy
, (dm−dy)>0 & R
Eh<4×(du−dy)×Fy
1, R
Eh≥4×(du−dy)×Fy
(2)
where 4×(du−dy)×Fy represents the reference hysteretic energy dissipation capacity
associated with the low inelastic cyclic fatigue.
[image:3.595.174.420.568.627.2]Calibration of damage indices performed by Park et al. [35] are presented in Table I, as well as the degree of observed damage in the structures. These are the definitions for damage used in this study.
Table I. Physical Interpretation of the Damage Indices [35]
Degree of Damage Damage Index, DI State
Collapse > 1.0 Loss of building
Severe 0.4 - 1.0 Beyond repair
Moderate < 0.4 Repairable
Minor/Slight < 0.2
3. GROUND MOTION SELECTION
Subduction earthquake motions were selected from databases that include earthquake records from the 2011 Great East Japan Earthquake [37], the 2010 Santiago, Chile earthquake [38],
Copyright c0000 John Wiley & Sons, Ltd. Earthquake Engng Struct. Dyn. (0000)
the 1985 Valparaiso, Chile earthquake, the 2010 Southern Peru earthquake, and the 1999 Chi-Chi, Taiwan earthquake. It is worth noting that due to the high-frequency site effects, amplifications in the 2011 Great East Japan Earthquake records are expected to be greater than those adopted in the U.S. for typical NEHRP site classes [39]. Twenty-two ground motions obtained from these databases had to be filtered and baseline corrected [40]. For each of these
long duration records, a corresponding short duration record with D5−75 shorter than 25 s,
and having a closely matching response spectrum was chosen from the PEER NGA-West2 database [41]. The spectral ordinates of each short duration record were then scaled, such that the mean spectral ordinates of the scaled record were similar to those of the long duration record. Among all candidate short duration records that had not already been selected, the one with the lowest sum of squared errors was chosen.
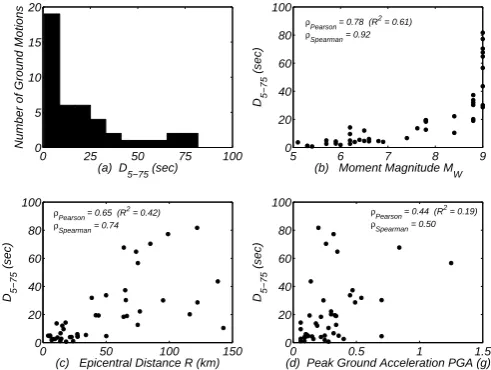
The complete ground motion database is presented in Table II. The characteristics of these ground motion records are shown in Figure 1, namely in terms of moment magnitudes and source-to-site distance for each ground motion, as well as, peak ground acceleration,
P GA, and the significant duration, D5
−75, which are all detailed in Kramer [42]. Figure 1(a)
shows the distribution of earthquake ground motions as a function of the ground motion
duration, D5
−75. Figures 1(b) to 1(d) show the relationship between D5−75 and ground
motion magnitude, source-to-site distance, andP GA. This figure shows also the linear Pearson
correlation coefficient and the Spearman correlation coefficient, which highlight that although these determination coefficients are not very large, a correlation between ground motion
duration and magnitude as well as distance andP GAexist.
0 0.5 1 1.5
0 20 40 60 80 100
(d) Peak Ground Acceleration PGA (g)
D5−75
(sec)
0 50 100 150
0 20 40 60 80 100
(c) Epicentral Distance R (km)
D5−75
(sec)
5 6 7 8 9
0 20 40 60 80 100
(b) Moment Magnitude M W
D5−75
(sec)
0 25 50 75 100
0 5 10 15 20
(a) D
5−75 (sec)
Number of Ground Motions
ρPearson = 0.78 (R 2
= 0.61)
ρSpearman = 0.92
ρPearson = 0.65 (R 2 = 0.42)
ρSpearman = 0.74
ρPearson = 0.44 (R 2 = 0.19)
[image:4.595.170.416.330.515.2]ρSpearman = 0.50
Figure 1. Ground motion records characteristics and correlation
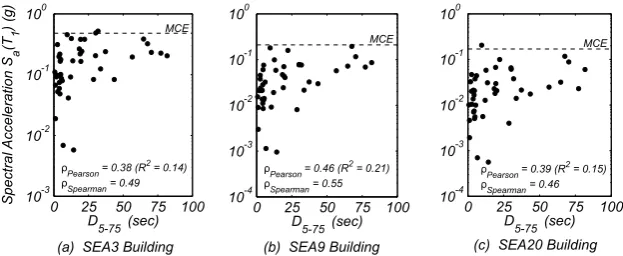
Figure 2 shows the relationship between spectral acceleration at the fundamental period of each of the three buildings and ground motion duration. Figures 2a to 2c indicate that correlation between these two measures, although weak, can not be neglected as a trend can be observed graphically. In the interest of isolating duration effect on structural response, the comparison is based on ground motion pairs with similar response spectra. The selecting and scaling procedure is independent of the hazard at any site. However, for reference, the Seattle MCE values are shown in Figure 2 for each building.
INFLUENCE OF EARTHQUAKE GROUND-MOTION DURATION ON DAMAGE ESTIMATION 5
0 25 50 75 100 10-3
10-2 10-1 100
D
5-75 (sec)
Spectral
Acceleration S
a
(T
1
) (g)
(a) SEA3 Building
0 25 50 75 100 10-4
10-3 10-2 10-1 100
D
5-75(sec)
(b) SEA9 Building
0 25 50 75 100 10-4
10-3 10-2 10-1 100
D
5-75 (sec)
(c) SEA20 Building. ρ
Pearson= 0.46 (R
2
= 0.21)
ρSpearman= 0.55
ρPearson= 0.39 (R2= 0.15)
ρ
Spearman= 0.46
ρPearson= 0.38 (R2= 0.14)
ρ
Spearman= 0.49
MCE
[image:5.595.140.452.73.201.2]MCE MCE
Figure 2. Ground motion spectral acceleration at the fundamental period of the intact structures versus significant duration for: (a) SEA3 Building; (b) SEA9 Building; and (c) SEA20 Building
lists the scale factors SF applied to the crustal motions response spectra. These factors
are computed as to minimize the mean squared error of the logarithmic 5%-damped linear response spectral acceleration associated with each pair of subduction and crustal motions in the period range of interest of each building. The ratio between the spectral accelerations
(Sa(Ti), where Ti are the list of discretized periods of the response spectra) for each of the
10 pairs of subduction/crustal ground motion ranges between 0.44 to 2.46 (SEA3: 0.54-2.46, SEA9: 0.44-2.28, SEA20: 0.46-2.37) across the period range of interest for the spectral response.
The period range of interest is defined as0.2T1 to1.5T1, whereT1 is the fundamental period
of the structure after application of the gravity loads.
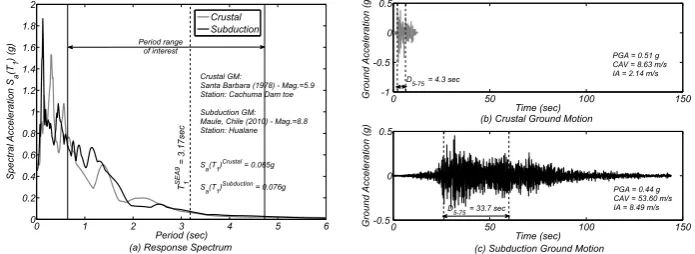
Figure 4 shows two of the 10 selected ground motion pairs used for analysis of the response of the SEA9 building. This figure shows a very good agreement between the individual response spectra for the two types of ground motions. For other pairs of ground motion and buildings, similar results are obtained, but not shown here in the interest of brevity. Moreover, median spectra of the long duration and short duration sets are, consequently, very similar. This similarity between the response spectra of the two types of earthquake ground motions is key in this study so that the effects of duration can be isolated from ground motion spectral response parameters.
4. BUILDING MODELS
4.1. General Description
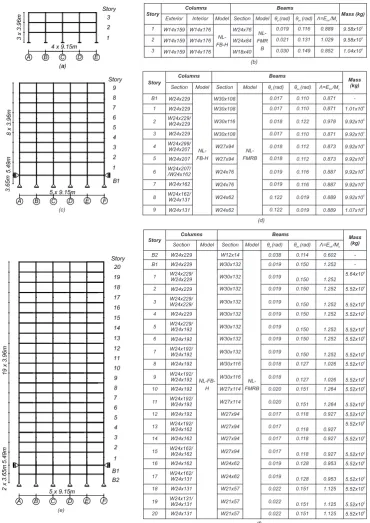
The steel moment resisting frame (SMRF) buildings studied are a 3-, a 9-, and a 20-story building (denoted SEA3, SEA9, and SEA20, respectively), which were designed for Seattle, WA, as part of the SAC steel project [21] using pre-Northridge codes [43], considering a site class S2, similar to Site Class D [44]. In the buildings under analysis, the external frames were designed to resist the lateral (seismic) loads and the interior frames were designed as gravity frames. As shown in Figure 5, the three-story building presents no basement, while the nine-and 20-story buildings have one nine-and two basement levels, respectively. The height of the frames is constant and equal to 3.96m, except for the two taller buildings, which have a first level with a height of 5.49m. A detailed description of the buildings is available in Gupta and Krawinkler [44].
Two-dimensional centerline nonlinear finite element models of a N-S external frame of each of the three buildings are developed in OpenSees and used for the structural analysis. Similar to the approach followed by Ribeiro et al. [45, 46] and Barbosa et al. [47], strong-column weak-beam ductile behavior is assumed for all structures. Brittle mechanisms and connection fracture modes are not considered. Geometric nonlinearities are accounted for during the analysis by
considering a P-∆leaning column. A rigid diaphragm is assumed for each floor. Soil-structure
Copyright c0000 John Wiley & Sons, Ltd. Earthquake Engng Struct. Dyn. (0000)
0 1 2 3 4 5 6 0 1 2 3 4 Period (sec) Spectral Acceleration (g) Median
Median +/- Std.Dev.
(d)
0 1 2 3 4 5 6
0 1 2 3 4 Period (sec) Spectral Acceleration (g) Median
Median +/- Std.Dev.
(c)
0 1 2 3 4 5 6
0 0.5 1 1.5 2 2.5 3 Period (sec) Spectral Acceleration (g) Median
Median +/- Std.Dev.
(b)
0 1 2 3 4 5 6
0 1 2 3 4 5 Period (sec) Spectral Acceleration (g) Median
Median +/- Std.Dev.
[image:6.595.123.466.76.329.2](a)
Figure 3. Comparison of the response spectra associated with the Suduction Zone and Shallow Crustal ground motions sets: (a) unscaled Subduction ground motions; (b) unscaled Crustal ground motions; (c) selected 10 Subduction ground motions (unscaled); and (d) selected and scaled Crustal ground
motions.
0 50 100 150
-1 -0.5 0 0.5 Time (sec) Ground Acceleration (g)
(b) Crustal Ground Motion
0 50 100 150
-0.5 0 0.5 Time (sec) Ground Acceleration (g)
(c) Subduction Ground Motion.
D
5-75= 4.3 sec
PGA = 0.51 g CAV = 8.63 m/s IA = 2.14 m/s
PGA = 0.44 g CAV = 53.60 m/s IA = 8.49 m/s D
5-75= 33.7 sec
0 1 2 3 4 5 6
0 0.2 0.4 0.6 0.8 1 1.2 1.4 1.6 1.8 2 Period (sec) Spectral Acceleration S a (T 1 ) (g)
(a) Response Spectrum
T1 SEA9 = 3.17sec Crustal Subduction Period range of interest Crustal GM:
Santa Barbara (1978) - Mag.=5.9 Station: Cachuma Dam toe Subduction GM: Maule, Chile (2010) - Mag.=8.8 Station: Hualane
S
a(T1) Crustal= 0.065g
S
a(T1) Subduction= 0.076g
Figure 4. SEA9 Building: Comparison of the Suduction Zone and Shallow Crustal ground motion pair number 8: (a) Response Spectra; (b) Shallow Crustal Ground Motion; and (c) Subduction Zone
Ground Motion
interaction is not considered. Floor masses are applied to beam-column joints whereas loads are applied to beam-columns joints and beam spans following the distribution of loads used in [45]. Rayleigh damping proportional to the mass and to committed stiffness is assigned to the
models considering a damping ratio of 2% at the fundamental periodT1of the intact structure
of each building (shown in Table III) and at T = 0.2 sec for SEA3 and SEA9 buildings, and
[image:6.595.120.468.406.533.2]IN F L U E N C E O F E A R T H Q U A K E GR O U N D -M O T IO N D U RA T IO N O N D A M A GE E S T IM A T IO N 7
Table II. Database of Shallow Crustal and Subduction Zone Earthquake Ground Motions
Pair Subduction Crustal
Earthquake Year Station Comp. Mag. R PGA D5-75 Earthquake Year Station Comp. Mag. R PGA D5-75 SF
(km) (g) (s) (km) (g) (s) SEA 3 SEA 9 SEA 20
1 Valparaiso (Chile) 1985 El Almendral L 7.8 63.8 0.22 18.3 Chalfant Valley-02 1986 Zack Brothers Ranch 360 6.2 7.6 0.40 2.6 0.73 0.68 0.58
2 Valparaiso (Chile) 1985 Llolleo L 7.8 41.8 0.33 19.4 Livermore-02 1980 San Ramon-East. Kodak 180 5.4 18.3 0.28 0.7 1.47 2.04 1.92
3 Valparaiso (Chile) 1985 Laligua 200 7.8 44.0 0.13 19.3 Mammoth Lakes-02 1980 Convict Creek 90 5.7 9.5 0.16 2.6
4 Valparaiso (Chile) 1985 San Fernando EW 7.8 75.0 0.34 12.6 Gazli, USSR 1976 Karakyr 0 6.8 5.5 0.70 4.6
5 Maule (Chile) 2010 Angol EW 8.8 65.6 0.70 30.2 Irpinia, Italy-01 1980 Brienza 0 6.9 22.6 0.22 4.0 3.38 3.04 2.88
6 Maule (Chile) 2010 Constitucion L 8.8 38.6 0.54 31.8 Managua, Nicaragua-01 1972 Managua, ESSO 90 6.2 4.1 0.36 4.9 1.99 1.94 1.92
7 Maule (Chile) 2010 Curico NS 8.8 65.1 0.47 37.2 Coalinga-01 1983 Parkfield - St. Corral 3E 90 6.4 34.0 0.11 5.4 5.00 5.00 5.00
8 Maule (Chile) 2010 Hualane T 8.8 50.0 0.45 33.7 Santa Barbara 1978 Cachuma Dam Toe 250 5.9 27.4 0.10 4.3 5.00 5.00 5.00
9 Maule (Chile) 2010 Papudo L 8.8 116.2 0.30 20.1 Lytle Creek 1970 Cedar Springs Pmp. 126 5.3 23.9 0.06 1.1
10 Maule (Chile) 2010 Vina del Mar EW 8.8 66.4 0.34 18.9 San Fernando 1971 Lake Hughes No.1 21 6.6 27.4 0.15 4.4
11 Tohoku (Japan) 2011 Miyakoji EW 9.0 64.0 0.84 67.6 Parkfield-02, CA 2004 Parkfield-Cholame 5W 90 6.0 6.9 0.25 1.8 2.79 2.38 2.43
12 Tohoku (Japan) 2011 Takahata EW 9.0 122.0 0.20 81.7 Coyote Lake 1979 Gilroy Array No4 360 5.7 5.7 0.25 5.0 0.83 0.87 1.03
13 Tohoku (Japan) 2011 Fukushima EW 9.0 99.0 0.32 77.2 Friuli, Italy-02 1976 San Rocco 0 5.9 14.5 0.06 2.8 3.82 3.93 3.99
14 Tohoku (Japan) 2011 Iwanuma EW 9.0 85.0 0.26 70.3 L’Aquila, Italy 2009 Celano NS 6.3 21.4 0.09 3.9 3.42 2.95 2.76
15 Tohoku (Japan) 2011 Tsukidate EW 9.0 75.1 1.25 56.6 Imperial Valley-06 1979 Compuertas 15 6.5 15.3 0.19 12.1
16 Tohoku (Japan) 2011 Sakura NS 9.0 122.3 0.49 28.6 Tabas, Iran 1978 Dayhook L 7.4 13.9 0.32 6.7
17 Tohoku (Japan) 2011 Haga EW 9.0 95.1 0.24 30.0 Parkfield 1966 Cholame-Shandon No.12 50 6.2 17.9 0.06 14.3
18 Tohoku (Japan) 2011 Chiba EW 9.0 138.4 0.14 43.6 San Francisco 1957 Golden Gate Park 10 5.3 13.7 0.09 1.1
19 Tohoku (Japan) 2011 Hirata NS 9.0 73.7 0.35 64.7 Hollister-03 1974 Hollister City Hall 181 5.1 11.5 0.09 3.7
20 Southern Peru 2010 Moquegua EW 8.4 76.7 0.30 22.2 San Fernando 1971 Pasadena-CIT Ath. 0 6.6 27.2 0.10 6.0
21 Southern Peru 2010 Arica Casa NS 8.4 142.8 0.28 10.4 Imperial Valley-06 1979 Coachella Canal No.4 L 6.5 50.1 0.12 4.7
22 Chi-Chi (Taiwan) 1999 CWB ALS NS 7.6 10.8 0.18 13.6 Irpinia, Italy-02 1980 Bisaccia 0 6.2 16.3 0.06 9.6
µ 36.8 4.8 2.77 2.78 2.69
σ 22.6 3.4 1.63 1.60 1.57
min 10.4 0.7 0.46 0.34 0.28
max 81.7 14.3 5.00 5.00 5.00
Story
Columns Beams
Mass (kg) Section Model Section Model θp(rad) θpc(rad) Λ=E /Mtot y
B2 W24x229
NL-FB-H
W12x14
NL-FMRB
0.038 0.114 0.602
-B1 W24x229 W30x132 0.019 0.150 1.252
-1 W24x229/W24x229 W30x132 0.019 0.150 1.252 5.64x10 5
2 W24x229 W30x132 0.019 0.150 1.252 5.52x10⁵
3 W24x229/W24x229/ W30x132 0.019 0.150 1.252 5.52x10⁵
4 W24x229 W30x132 0.019 0.150 1.252 5.52x10⁵
5 W24x229/W24x192 W30x132 0.019 0.150 1.252 5.52x10⁵
6 W24x192 W30x132 0.019 0.150 1.252 5.52x10⁵
7 W24x192/W24x192 W30x132 0.019 0.150 1.252 5.52x10⁵
8 W24x192 W30x116 0.018 0.127 1.026 5.52x10⁵
9 W24x192/
W24x192 W30x116 0.018 0.127 1.026 5.52x10⁵
10 W24x192 W27x114 0.020 0.151 1.264 5.52x10⁵
11 W24x192/W24x192 W27x114 0.020 0.151 1.264 5.52x10⁵
12 W24x192 W27x94 0.017 0.118 0.927 5.52x10⁵
13 W24x192/W24x162 W27x94 0.017 0.118 0.927 5.52x10 5
14 W24x162 W27x94 0.017 0.118 0.927 5.52x10⁵
15 W24x162/W24x162 W27x94 0.017 0.118 0.927 5.52x10⁵
16 W24x162 W24x62 0.019 0.128 0.953 5.52x10⁵
17 W24x162/W24x131 W24x62 0.019 0.128 0.953 5.52x10⁵
18 W24x131 W21x57 0.022 0.151 1.125 5.52x10⁵
19 W24x131/W24x131 W21x57 0.022 0.151 1.125 5.52x10⁵
20 W24x131 W21x57 0.022 0.151 1.125 5.52x10⁵
(f) Story
Columns Beams
Mass (kg) Exterior Interior Model Section Model θp(rad) θpc(rad) Λ=E /Mtot y
1 W14x159 W14x176
NL-FB-H
W24x76 NL-FMR
B
0.019 0.116 0.889 9.58x10⁵
2 W14x159 W14x176 W24x84 0.021 0.131 1.029 9.58x10⁵
3 W14x159 W14x176 W18x40 0.030 0.149 0.852 1.04x10⁶
Story
Columns Beams
Mass (kg) Section Model Section Model θp(rad) θpc(rad) Λ=E /Mtot y
B1 W24x229
NL-FB-H
W30x108
NL-FMRB
0.017 0.110 0.871
-1 W24x229 W30x108 0.017 0.110 0.871 1.01x10⁶
2 W24x229/W24x229 W30x116 0.018 0.122 0.978 9.92x10⁵
3 W24x229 W30x108 0.017 0.110 0.871 9.92x10⁵
4 W24x299/W24x207 W27x94 0.018 0.112 0.873 9.92x10⁵
5 W24x207 W27x94 0.018 0.112 0.873 9.92x10⁵
6 W24x207//W24x162 W24x76 0.019 0.116 0.887 9.92x10⁵
7 W24x162 W24x76 0.019 0.116 0.887 9.92x10⁵
8 W24x162/W24x131 W24x62 0.122 0.019 0.889 9.92x10⁵
9 W24x131 W24x62 0.122 0.019 0.889 1.07x10⁶
(d) (b)
(c).
(e)
NL-FB-H N l F B H
NL-FMRB N l F L M -R B
[image:8.595.112.483.64.588.2]- on inear orce- ased Beam-Column Element with Fiber Section with 3% strain- ardening - on inear inite- ength odified Gauss adau Beam-Column Element with ilinear Flexural Hinge Model
Figure 5. Two-Dimensional Models of Steel Moment Resisting Frames Buildings in Seattle : (a) SEA3 Building; (b) SEA3 Sections, Model Parameters, and Floor Masses; (c) SEA9 Building; (d) SEA9 Sections, Model Parameters, and Floor Masses; (e) SEA20 Building; (f) SEA20 Sections, Model
INFLUENCE OF EARTHQUAKE GROUND-MOTION DURATION ON DAMAGE ESTIMATION 9
4.2. Component Modeling
Two variations of a nonlinear finite element model are developed in OpenSees for the buildings. In both models, columns are modeled using nonlinear force-based fiber-section beam-column elements in which an elasto-plastic constitutive law with a 3% kinematic hardening is assigned to each fiber. Beams are modeled using a force-based finite length plastic-hinge beam-column element [48, 49], which models plastic hinge length explicitly and separates the behavior of beam in the span from that of beam-column connections. Both models use the modified Gauss-Radau integration scheme.
The difference between the two models lies in the modeling of the plastic-hinge employed for beams, which can be: (i) an elasto-plastic with hardening constitutive law; or (ii) bilinear model with strength deterioration. Here the first model is labeled FMRH (Finite-length Modified Gauss-Radau with Hardening), while the second model is labeled FMRB (Finite-length Modified Gauss-Radau with Bilinear Model). The second model is also known as the modified Ibarra-Medina-Krawinkler deterioration model [50, 51], ModIMK model in short, and is a bilinear model that accounts for strength degradation. It was chosen for its versatility in modeling degrading hysteretic response of structural elements. This model was empirically calibrated for reproducing the moment-rotation relation of steel structural components [51]. The ModIMK model is based on a backbone curve defining the reference monotonic behavior and a set of rules defining the hysteretic behavior between the positive and negative backbone curves. The backbone curves are defined by three strength parameters: (i) effective yield
moment,My, (ii) capping moment,Mc, and (iii) residual moment,Mr; and four deformation
parameters: (iv) yield rotation, θy, (v) pre-capping plastic rotation capacity, θp, (vi)
post-capping plastic rotation capacity,θpc, and (vii) ultimate rotation capacity,θu.
This model defines four modes of cyclic deterioration: (i) basic strength, (ii) post-yield hardening ratio, (iii) post-capping strength, and (iv) unloading stiffness, controlled by a
characteristic total hysteretic energy dissipation capacity Etot and an energy-based rule
developed by Rahnama and Krawinkler [52]. When a finite length plastic hinge element is
used, a plastic hinge length ofLp=L/6(whereLis the beam span) should be used to recover
the exact solution for the case of a fixed-fixed beam column element [53]. Otherwise, a plastic-hinge calibration approach is warranted for recovery of the elastic and inelastic stiffness [49]. All other model parameters are defined as proposed by Lignos and Krawinkler [51, 54]. Axial and shear behavior is assumed to be linear elastic. Joint shear deformations [44] and fracture due to low cycle fatigue [55] are not considered in this work.
4.3. Model Validation
The model validation performed here includes the comparison of results of nonlinear static pushover analysis and periods of the buildings models developed here using OpenSees with the FEMA355 M1 models [21]. The building periods available associated with the FEMA355 M1 models correlate well with the ones obtained in the FE models developed here, as shown in Table III. The FEMA355 models were developed using DRAIN-2DX [56]. The elements used in the DRAIN-2DX models correspond to concentrated plastic hinge models with a linear
P-M interaction surface for compressive axial loads greater than 0.15Pmax.P−∆ effects were
considered through modeling of a leaning column. Thus, the main differences between the FEMA355 models and the ones developed here are: (i) columns are now modeled using fiber section distributed plasticity elements and therefore account explicitly for the P-M interaction; and (ii) finite-length plastic hinge are modeled in two different ways: (a) similar to the FEMA models, assuming that the hinges do not have strength and stiffness degradation (FMRH models); and (b) considering degradation through use of the ModIMK model (FMRB model). In all buildings the nonlinear static pushover analyses were performed assuming that the
lateral load pattern applied is proportional to the 1st mode of vibration of each structure.
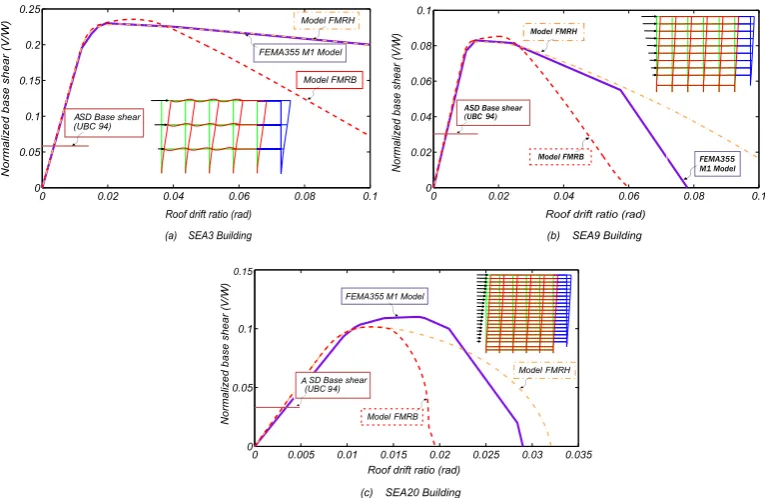
Figure 6 shows the pushover curves for each of the three buildings and three finite element models (FMRH, FMRB, and FEMA355 M1 models). For reference, figures also show the design base shear quantified according to the allowable stress design method (ASD) of the
Copyright c0000 John Wiley & Sons, Ltd. Earthquake Engng Struct. Dyn. (0000)
Table III. Periods of Vibration for OpenSees Models and FEMA355 Model
SEA3 Building SEA9 Building SEA20 Building
OpenSees FEMA355 OpenSees FEMA355 OpenSees FEMA355
1st Mode 1.36 1.36 3.15 3.17 3.82 3.92
2nd Mode 0.43 0.43 1.12 1.13 1.37 1.40
3rd Mode 0.22 0.22 0.60 0.61 0.81 0.82
1994 Uniform Building Code [43]. In Figure 6, for the SEA3 building, it can be observed that the pushover curve of the model that does not consider strength deterioration (FMRH) matches relatively well the pushover curve of the FEMA model. For the SEA9 building, a good match is also found up to approximately 6% of roof drift ratio (RDR). At this RDR, the moment gradient of the columns is substantially reduced due to simplified axial force-bending moment
P−M interaction surface considered in FEMA 355 M1 models, leading to a faster decrease
in base shear. At this level of RDR (6%), the peak base shear has reduced by more than 80%, allowing for a validation of the model up to failure, if failure is described to correspond to the drift at which the strength capacity is reduced by 20% or more, as commonly assumed in earthquake engineering analyses. For the SEA20 building, significant differences are observed over the entire range. Such differences are expectable as a consequence of alternative modeling assumptions such as beam-column joint modeling.
In Figure 6(b), it can also be observed that the model FMRB, which considers the strength degradation in beams, has considerably greater strength deterioration. Note that the model has zero residual strength at about 6% RDR. Therefore, the results indicate that this model is valid until collapse, since it is only at this level of RDR that the column bending moment gradient would start playing an important role.
In summary, the model validation performed here is considered to be sufficient for the FMRH models. Although no direct validation of the FMRB models with experimental or numerical results is possible, the definition of component degradation is consistent with experimental results from a large database of component tests and P-M interaction is explicitly considered.
5. ANALYSIS METHODOLOGY
Following model validation, first, the buildings are analyzed under all ground motions described in Table II without considering any ground motion scaling. The objective of this first analysis is to evaluate the importance of duration on the damage indices. However, results obtained in this first analysis are both dependent of duration, D5-75, and the ground motion intensity,
Sa(T1). Then, a second analysis is performed in which two groups of ten (10) ground motions
are scaled to identical intensities in IDA analysis. This second analysis isolates the effect of ground motion duration, as for each intensity considered in the IDA analysis, the ground motions are selected to have identical response spectral values and shapes. IDA is performed at at least twenty intensity levels. Response measures recorded are the peak drift, residual drift, energy dissipated, and number of inelastic excursions at every beam section. The spectral acceleration at the fundamental period of the intact structure is taken as the intensity measure of the ground motions.
In this study, the damage indices are computed at the section level for each beam hinge and at the global level by aggregating the damage data for all beams. Structural damage is computed based on the performance of beams only, since these provide the largest contribution to the damage, as the design of these buildings was based on a strong column-weak beam concept.
The section damage index is computed considering the curvature (χ) and moment (M) as the
INFLUENCE OF EARTHQUAKE GROUND-MOTION DURATION ON DAMAGE ESTIMATION 11
0 0.005 0.01 0.015 0.02 0.025 0.03 0.035
0 0.05 0.1
0 0.02 0.04 0.06 0.08 0.1
0 0.02 0.04 0.06 0.08 0.1
0 0.02 0.04 0.06 0.08 0.1
0 0.05 0.1 0.15 0.2 0.25
FEMA355 M1 Model
ASD Base shear (UBC 94)
Model FMRH
Model FMRB
Normalized base shear (V/W)
Roof drift ratio (rad) Roof drift ratio (rad)
Normalized
base
shear
(V/W)
FEMA355 M1 Model ASD Base shear
(UBC 94)
Model FMRH
Model FMRB
Roof drift ratio (rad)
Normalized base shear (V/W)
FEMA355 M1 Model
A SD Base shear (UBC 94)
Model FMRH
Model FMRB 0.15
(a) SEA3 Building (b) SEA9 Building
[image:11.595.100.483.71.320.2](c) SEA20 Building.
Figure 6. Nonlinear Static Pushover Capacity Curves Considering a 1st Mode Lateral Load Pattern: (a) SEA3 Building; (b) SEA9 Building; (c) SEA20 Building
the maximum of the section damage index of both hinges in a beam element, which is modeled as a finite-length concentrated plasticity finite element.
If some conditions are met, namely a regular distribution of mass, strength and stiffness in plan and height, such as the case of the buildings considered herein, a global value of the damage indices can be used to characterize damage in ductile members of steel frames [57]. Following the approach in IDARC2D [23], the damage index of the global structure is defined as the average of the element’s damage indices weighted by their hysteretic energy dissipated, as:
DIstructural= nelement
X
i=1
λelement,i×DIelement,i (3)
whereDIelement,i is the damage index associated with elementiandλelement,i is the ratio of
the energy dissipated by element i to total element energy dissipated by all elements, given
by:
λelement,i=
R
Ehelement,i
Pnelement j=1
R
Ehelement,j (4)
where R
Ehelement,i is the hysteretic energy dissipated by elementi. If an element remains on an elastic state, its hysteretic energy dissipated is zero and according to Equations 3 and 4 it does not affect the structural damage index. On the other hand, if a single member has a damage index of 1.0 locally, the global index may not reach 1.0.
Using definitions in Equations 1 to 4, the following damage indices are recorded during the analysis: (i) damage index for each element, (ii) maximum element damage index over all floors, and (iii) structural damage index obtained through Equation 3. The second damage measure corresponds to the maximum among the damage indices computed for all beams and all floors. This value is intended to represent the damage state of the beam in worst condition. The
Copyright c0000 John Wiley & Sons, Ltd. Earthquake Engng Struct. Dyn. (0000)
value is saved regardless of the beam/floor where it was attained. The third and last measure corresponds to a hysteretic energy dissipated weighted average of the observed damage over all beams at all floor levels. For each of the twenty ground motion intensities considered in this study, median values are computed for each damage measure.
It is worth noting that, when the hysteretic energy dissipated,R
Eh, exceeded the reference
low inelastic cyclic energy dissipation capacity defined by Reinhorn and Valles [23] (Equation 2)
as 4×(du−dy)×My, it is assumed thatDIRV = 1.0. Although non-converged analyses can
be incorporated in the collapse risk assessment when a fragility/collapse analysis is performed [58], the scope of this study is to compare the structural damage due to shallow crustal and subduction zone earthquakes, thus non-converged analyses are ignored.
In all analyses, the Newmark average acceleration method was employed. A maximum time step of 0.002 sec was used during analysis. This time step was deemed sufficient following a convergence study where the accuracy of roof acceleration time-history response due to large intensity shaking was studied using five time steps between 0.01 sec and 0.00005 sec. It was observed that a time step of 0.002 sec produces negligible errors (when compared to a time step of 0.00005 sec) and no significant changes in the response are observed when smaller time steps are used. The Newton-Raphson method is used to solve the nonlinear system of dynamic equations of equilibrium at each time step. An iterative scheme, which reduces the time-step, changes the solving algorithm, or slightly increases the tolerance criterion when a convergence issue was found, was implemented in the OpenSees analysis procedure.
6. RESULTS
6.1. Preliminary Results and Damage Assessment Calibration
6.1.1. Unscaled Ground Motions
The structural response of the three buildings was initially evaluated using all the unscaled records present in the database. Figures 7 and 8 show the structural response in terms of
peak interstory drift ratio and Park and Ang structural damage index DIstructural
P A for the
three buildings as a function of the spectral acceleration and significant duration. Figure
9 shows similar plots for the remaining damage indices (DIstructural
RV , DI
max−member
P A , and
DImax−member
RV ) for the SEA3 building. In these figures, 44 points associated with each
performed analysis, are represented together with a multiple linear regression surface that best fits the data. Spectral acceleration is transformed so that the corresponding axis is in log-scale. In all figures a black line is also shown representing the maximum recorded response. Figure 7 shows that there is a clear trend throughout all buildings. At first, for low values of spectral acceleration, there is no visible influence of ground motion duration on peak IDR. This is expected due to the existence of very few structural nonlinearities introduced by ground motions. Second, for intermediate spectral acceleration values the influence of ground motion duration increases as longer duration motions tend to induce larger peak IDR. Finally, for large intensity ground motions, long duration motions lead to significantly larger peak IDR. The coefficients of determination indicate that the performed multiple linear regression fit reasonably well the recorded data.
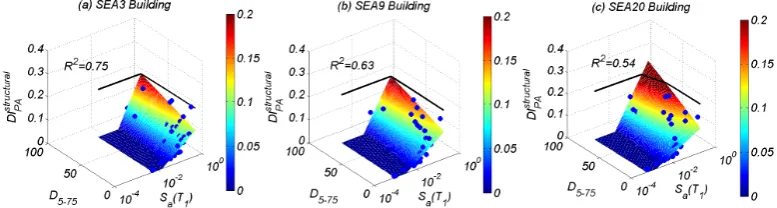
Figure 8 indicates that the trends identified in the previous figure hold for the case of this damage index for the three buildings. Since the obtained regression surfaces associated with the Park and Ang structural damage indices are similar for the three buildings, in Figure 9 results for the remaining damage indices are only represented for the SEA3 Building. In
this Figure similar trends are identified. Comparison betweenDIstructuralandDImax−member
INFLUENCE OF EARTHQUAKE GROUND-MOTION DURATION ON DAMAGE ESTIMATION 13
Figure 7. Peak interstory drift ratio as a function of the significant duration D5−75 and spectral acceleration Sa(T1)for the 44 unscaled ground motions for: (a) SEA3 Building; (b) SEA9 Building;
[image:13.595.105.494.238.342.2]and (c) SEA20 Building
Figure 8. Park and Ang Structural Damage indexDIP Astructuralas a function of the significant duration D5−75 and spectral accelerationSa(T1) for the 44 unscaled ground motions for: (a) SEA3 Building;
(b) SEA9 Building; and (c) SEA20 Building
Figure 9. SEA3 Building: Damage indices as a function of the significant durationD5−75and spectral acceleration Sa(T1)for the 44 unscaled ground motions: (a) Park and Ang maximum damage index DIP Amax,element; (b) Reinhorn and Valles Structural Damage indexDIRVstructural; and (c) Reinhorn and
Valles maximum damage indexDIRVmax,element
6.1.2. Scaled Ground Motions
The structural response of the three buildings was then evaluated using selected scaled ground motion pairs. Results of the spectrally equivalent earthquake pair number 6 for SEA3 and pair number 8 for SEA9 building are shown next. Figure 10 shows the time-history results for the SEA3 building in terms of IDR and ratio between energy dissipated and total energy
dissipation capacity (Eh/Etot) for a left most plastic hinge at each story level. This figure
shows that the difference in the peak IDR is not significant, where 2.95% is observed for the shallow motion against 3.09% for the subduction motion. However, the difference in terms of energy dissipation in the beam of the upper floor is significant, being 5.6% for the shallow
Copyright c0000 John Wiley & Sons, Ltd. Earthquake Engng Struct. Dyn. (0000)
[image:13.595.107.496.404.511.2]motion and 20.4% for the subduction motion. Figure 11 shows results for SEA9 building. Only results of floors 1, 7, 8, and 9 are shown as these are the most critical floors, where higher IDRs are attained and more energy is dissipated. This figure shows that a peak IDR of 3.17% is induced by the subduction motion, while a peak IDR of 1.65% is induced by the crustal motion. Simultaneously, energy dissipated is considerably different for all the beams. Energy dissipation ratio is 12.0% for the subduction motion, while only 2.11% is attained for the crustal motion for the upper floor beam.
In summary, results in Figures 10 to 11 indicate that ground motion duration is an important factor that needs to be considered. Moreover, in the next subsection, structural response of the three buildings is evaluated using IDA.
0 20 40 60 80
-5 0 5
IDR (%)
0 20 40 60 80
-5 0 5
IDR (%)
0 20 40 60 80
-2 0 2
IDR (%)
0 50 100 150 200
-5 0 5
IDR (%)
0 50 100 150 200
-2 0 2
IDR (%)
0 50 100 150 200
-5 0 5
IDR (%)
0 50 100 150 200
0 20 40 Eh /E tot (%)
0 50 100 150 200
0 2 4 Eh /E tot (%)
0 50 100 150 200
0 5 10 Eh /E tot (%)
0 20 40 60 80
0 5 10 Eh /Etot (%)
0 20 40 60 80
0 2 4 Eh /E tot (%)
0 20 40 60 80
0 2 4 Eh /E tot (%) 3 Floor rd 2 Floor nd 1 Floor st 2.95% 0.68% 5.62% 2.15% 0.36% 1.92% 1.33% 0.11% 3.13% 3.09% 0.89% 20.36% 2.37% 0.46% 2.51% 1.88% 0.23% 6.99%
Earthquake Free Vibration Earthquake Free Vibration
DI =0.23PA
DI =0.16RV
DI =0.14PA
DI =0.08RV
DI =0.15PA
DI =0.07RV
DI =0.12PA
DI =0.04RV
DI =0.14PA
DI =0.08RV
DI =0.19PA
DI =0.12RV
Crustal Ground Motion Subduction Ground Motion
[image:14.595.116.501.204.494.2]Time (sec) Time (sec)
Figure 10. SEA3 Building: Response obtained with ground motion pair number 6 (with scaled crustal ground motion) in terms of Interstory Drift Ratio and ratio between energy dissipated and total energy
dissipation capacity (Eh/Etot) for a specific plastic hinge at each story level
6.2. Deformation and Energy Demands
INFLUENCE OF EARTHQUAKE GROUND-MOTION DURATION ON DAMAGE ESTIMATION 15
0 5 10 15 20 25 30 35
-2 0 2
IDR (%)
0 5 10 15 20 25 30 35
-2 0 2
IDR (%)
0 5 10 15 20 25 30 35
-2 0 2
IDR (%)
0 5 10 15 20 25 30 35
-1 0 1
IDR (%)
0 5 10 15 20 25 30 35
0 2 4 Eh /E tot (%)
0 5 10 15 20 25 30 35
0 1 2 Eh /E tot (%)
0 5 10 15 20 25 30 35
0 2 4 Eh /Etot (%)
0 5 10 15 20 25 30 35
0 1 2 Time (sec) Eh /E tot (%)
0 50 100 150 200
-5 0 5
IDR (%)
0 50 100 150 200
-5 0 5
IDR (%)
0 50 100 150 200
-5 0 5
IDR (%)
0 50 100 150 200
-2 0 2
IDR (%)
0 50 100 150 200
0 10 20 Eh /E tot (%)
0 50 100 150 200
0 5 10 Eh /E tot (%)
0 50 100 150 200
0 2 4 Eh /E tot (%)
0 50 100 150 200
0 1 2 Time (sec) Eh /E tot (%) 9 Floor th 8 th Floor 7 Floor th 1 Floor st
DI =0.09PA
DI =0.03RV
0.01% 0.09% 0.06% 0.01% 0.41% 0.02% 2.11% 0.02% 1.65% 1.55% 1.34% 0.84%
Earthquake Free Vibration Crustal Ground Motion
Earthquake Free Vibration Subduction Ground Motion
DI =0.06PA
DI =0.00RV
DI =0.18PA
DI =0.12RV
DI =0.08PA
DI =0.01RV
DI =0.20PA
DI =0.14RV
DI =0.10PA
DI =0.04RV
DI =0.26PA
DI =0.22RV
DI =0.12PA
DI =0.05RV
[image:15.595.117.489.62.337.2]1.10% 0.07% 2.78% 0.80% 6.09% 0.95% 12.00% 1.09% 3.17% 3.05% 2.52% 1.12%
Figure 11. SEA9 Building: Response obtained with ground motion pair number 8 (with scaled crustal ground motion) in terms of Interstory Drift Ratio and ratio between energy dissipated and total energy
dissipation capacity (Eh/Etot) for a specific plastic hinge at each story level
paragraphs. It is worth noting that a similar trend was obtained by [59] for concentrically braced steel frames.
The residual interstory drift ratio (RIDR) has been referred as a good measure of the cumulative damage achieved by the structure and, consequently, a good indicator of the post-earthquake resistant capacity [14]. Figure 12(d) shows the incremental dynamic analysis (IDA) curve for the RIDR for the twenty story building. Obtained results indicate that, for low intensities of shaking, shallow crustal ground motions tend to induce larger RIDRs than long duration subduction zone ground motions. The tendency of the longer duration motions to reduce the RIDR for lower intensities is related to the self-centering nature of the model, which has been discussed in detail by Barbosa et al. [47]. As the earthquake ground motion intensity increases, subduction ground motions induce larger residual deformations due to the increase in cumulative damage that is sustained by the structural members. Similar tendency, although less pronounced, is also observed for the 3-story building (not shown here). It is worth noting that RIDR is affected by the modeling approach used, especially when modeling structures to collapse. However, in the interest of the length of this paper, and because damage indices do not account for the RIDR, detailed discussion of the RIDR is left for future works.
Figure 13 shows the median ratio between the energy dissipated (Eh) and the total energy
dissipation capacity (Etot) in each plastic hinge at floor levels for each building. Results are
shown forSa(T1) = 0.56g for the SEA3 building, forSa(T1) = 0.21g for the SEA9 building, and
Sa(T1) = 0.15g for the SEA20 building. These values correspond to the spectral acceleration at the fundamental period of vibration of the buildings, based on Seattle MCE response spectrum.
Note that an increase in theEh/Etotratio corresponds to a reduction in the residual structural
resistant capacity of the members. Figure 13 also shows the median interstory drift ratio (IDR) at each story for the same ground motion intensity levels, on the right side of each building. For the three buildings, it can be seen that the energy dissipated during subduction zone ground motions is significantly greater than that dissipated in shallow crustal ground motions,
Copyright c0000 John Wiley & Sons, Ltd. Earthquake Engng Struct. Dyn. (0000)
0 1 2 0
0 1 2 3 4 5 6 7 8 9 10
0 0.5 1 1.5 2 2.5
Peak Interstory Drift Ratio IDR (%)
Spectral
Acceleration S
a
(T
1
) (g)
(a) SEA3 Building - Peak IDR Median Crustal
Median Subduction Crustal #6 Subduction #6
0 1 2 3 4 5 6 7 8 9 10
0 0.05 0.1 0.15 0.2 0.25 0.3 0.35 0.4
Peak Interstory Drift Ratio IDR (%)
Spectral
Acceleration S
a
(T
1
) (g)
(b) SEA9 Building - Peak IDR Median Crustal
Median Subduction Crustal #8 Subduction #8
0 1 2 3 4 5 6 7 8 9 10
0 0.1 0.2 0.3 0.4 0.5
Peak Interstory Drift Ratio IDR (%)
Spectral
Acceleration S
a
(T1
) (g)
(c) SEA20 Building. - Peak IDR
Median Crustal Median Subduction Crustal #6 Subduction #6
0 1 2 3 4 5 6 7 8 9 10
0 0.05 0.1 0.15 0.2 0.25 0.3 0.35 0.4 0.45 0.5
Peak Residual Interstory Drift Ratio IDR (%)
Spectral
Acceleration S
a
(T1
) (g)
(d) SEA20 Building - Residual IDR Median Crustal
[image:16.595.104.485.74.375.2]Median Subduction Crustal #6 Subduction #6
Figure 12. Incremental Dynamic Analysis: Capacity Curves Obtained Through of (a) SEA3 Building; (b) SEA9 Building; (c) SEA20 Building and (d) Residual Interstory Drift Ratio (RIDR) for SEA20
as a result of longer durations. In Figure 13(a), for the SEA3 building, the maximum ratio
between the energy dissipated and the total energy dissipation capacity (Eh/Etot) is reached
at level 3, with a value of 16%. In Figure 13(b) it can be seen that building SEA9 is capable of redistributing deformations across a wide range of floors, where the peak ratios tend to be
similar at multiple floors. In this building, the maximum ratio Eh/Etot is 65%. Figure 13(c),
for the SEA20, shows that the maximum energy dissipated in a plastic hinge is achieved in
the SEA20 building, where the energy dissipation is concentrated in the 18th and19th floors.
For this building, the maximum ratioEh/Etot is 68%. For each ground motion type, a strong
correlation between the energy dissipated at each floor and the interstory drift ratio is found. Building SEA20, in particular, presents a high concentration of energy dissipated in higher floors, where peak interstory drift ratios are also recorded, thus showing that this building may be more vulnerable after the earthquake. Possible reasons for the concentration of damage in higher floors are: (1) contribution of higher modes, and (2) smaller cross-sections of the beams in the upper two to three stories (see Figures 5c and 5d for building SEA9 and Figures 5e and 5f for building SEA20). It is worth noting, however, that even though a greater demand is expected from the subduction events, the distribution of the demand over the building height is similar for both groups of earthquakes.
INFLUENCE OF EARTHQUAKE GROUND-MOTION DURATION ON DAMAGE ESTIMATION 17
(a) SEA3 Building
(b) SEA9 Building
(c) SEA20 Building.
Median E /E (%)h tot Median IDR (%)
68 54 40 26 13
0
3.2 2.6 1.9 1.3 0.6
0 65
52 39 26 13
0
4.5 3.6 2.7 1.8 0.9
0 16
13 10 7 3
0
3.2 2.6 1.9 1.3 0.6
0
SEA9
SEA20
E /Eh tot IDR (%)
Cr. Sub. Sub.Cr.
E /Eh tot IDR (%)
Cr. Sub. Sub.Cr.
E /Eh tot IDR (%)
Cr. Sub. Sub.Cr.
[image:17.595.156.441.65.438.2]SEA3
Figure 13. Median Ratio of the Energy Dissipated to the Total Energy Dissipation Capacity (Eh/Etot) at Each Plastic Hinge Section and Median Interstory Drift Ratio (IDR) at Each Story for a Spectral Acceleration Corresponding to the Seattle MCE intensity levels: (a) SEA3 Building atSa(T1) = 0.56
g; (b) SEA9 Building atSa(T1) = 0.21g; and (c) SEA20 Building atSa(T1) = 0.15g
6.3. Damage Assessment
As mentioned before, three groups of results are obtained for each damage index (DIP A and
DIRV): (i) median damage index for each beam; (ii) median maximum beam damage index
(regardless of the beam at which the maximums were recorded); and (iii) median structural damage index. The results for each damage index shown next were obtained using 10 ground motion pairs underlined in Table II.
Figure 14 shows the median DIP A damage index recorded at three different intensities,
Sa(T1) = 0.56g,Sa(T1) = 0.21g, andSa(T1) = 0.15g for SEA3, SEA9, and SEA20 buildings,
respectively. The subduction ground motions consistently lead to higher damage indices, thus proving to be more damaging than crustal ground motions. The maximum damage index is achieved in the SEA20 building, which is consistent with conclusions drawn from Figure 13. At the elements where the maximum damage index is recorded in SEA9 and SEA20 buildings, the index associated with crustal ground motions is, at most, 60% of the corresponding value for subduction ground motions.
Figure 15(a) shows the median structural damage indices obtained for subduction ground motions plotted versus the indices obtained for the crustal ground motions for all IDA intensity
Copyright c0000 John Wiley & Sons, Ltd. Earthquake Engng Struct. Dyn. (0000)
(a) SEA3 Building
(b) SEA9 Building
(c) SEA20 Building.
Median DIPA
0 0
0.22 0.18 0.14 0.09 0.04
0
SEA9
SEA20
0.50 0.40 0.30 0.20 0.10
0.84 0.67 0.50 0.34 0.17
Cr. Sub.
Cr. Sub. Cr. Sub.
[image:18.595.188.410.69.422.2]SEA3
Figure 14. Median Park and Ang Damage Index at Each Element for a Spectral Acceleration Corresponding to the Seattle MCE Intensity Levels: (a) SEA3 Building atSa(T1) = 0.56g; (b) SEA9
Building atSa(T1) = 0.21g; and (c) SEA20 Building atSa(T1) = 0.15g
levels. Every pair of results for ground motion types were obtained at the same ground motion intensity levels, as can be seen for an example pair of the IDA results shown in Figure 12. A similar plot is presented in Figure 15(b) but here considering the median maximum damage index recorded. In both figures, damage indices associated with subduction ground motions are always greater than the ones associated with crustal ground motions. Damage indices associated with building SEA20 are consistently larger than the ones associated with the other
two buildings, namely for the structural damage index. In addition to this, damage indexDIRV
is always greater thanDIP A, showing that building response presents high sensitivity to energy
dissipation, which can be considered as a proxy for cumulative damage. For the subduction
zone ground motions, a large number of elements exceeds the threshold value of DIP A= 0.4,
which according to Park et al. [35] indicates a non-repairable damage state. For the shallow crustal ground motions this threshold is only exceeded in the SEA20 building.
6.4. Influence of Duration on Deformation-Damage Relationships
Figures 16 to 19 show the damage indices associated with subduction and crustal ground motions plotted as a function of the peak IDR, for the 10 ground motion pairs underlined in Table II. Figure 16 shows, for the SEA9 building, the computed median results of the four
INFLUENCE OF EARTHQUAKE GROUND-MOTION DURATION ON DAMAGE ESTIMATION 19
0 0.1 0.2 0.3 0.4 0.5
0 0.2 0.4 0.6 0.8 1
(a) DIstructural Damage Index for Crustal GMs
Damage Index for Subduction GMs
SEA3 - DIPA SEA9 - DI
PA
SEA20 - DIPA SEA3 - DI
RV
SEA9 - DIRV SEA20 - DI
RV
1 1
0 0.1 0.2 0.3 0.4 0.5
0 0.2 0.4 0.6 0.8 1
(b) Maximum DIelement Damage Index for Crustal GMs
Damage Index for Subduction GMs
SEA3 - DIPA
SEA9 - DIPA
SEA20 - DIPA
SEA3 - DIRV
SEA9 - DIRV
SEA20 - DIRV
1
[image:19.595.104.491.68.218.2]1
Figure 15. Comparison of the Median Damage Indices Recorded in the Analyses Carried Out With Shallow Crustal and Subduction Zone Ground Motion: (a) Structural Index; and (b) Median Maximum
Element Value
DIRV index, and maximumDIRV index, respectively. Figure 17 show the individual results,
associated with ground motion pair number 8, of the same damage indices for the SEA9
building. Figure 18 shows the median Park and Ang DIP A index for the SEA3 and SEA20
buildings. Finally, Figure 19 show the individual results of this damage index associated with ground motion pair number 6 for these buildings.
The coefficients of variation (CoV) of each damage index were estimated for all IDR levels presented in Figures 16 and 18. It was found that the CoV increase monotonically. However, for higher values of the IDR, the CoV is strongly influenced by the number of analysis that lead to collapse, losing some significance. r a threshold value this increase is exponential due to the larger dispersion in the results, namely because the analyses that lead to collapse. In the tables presented in this Figure is presented the threshold IDR that precede the exponential increase and the associated CoV. These values may be used in future probabilistic studies. After these threshold IDR values the CoV values are actually larger than those presented in the tables.
Similar trends are observed throughout these figures, i.e. similar damage indices are obtained for both subduction zone and shallow crustal motions for peak IDR lower than 2.0%, in terms of the median but also for individual pairs of ground motions. Up to this point, in most cases, subduction ground motions induce slightly larger damage indices, but the differences are not significant. However, beyond 2.0% IDR, the differences are significant and results clearly show that longer durations impose much larger damage indices at similar levels of peak IDR. For example, for a peak IDR of 4.0%, the damage index associated with subduction ground motion is at least 50% higher than that associated with crustal ground motions. Moreover, it is worth noting that smaller IDR tend to lead to smaller damage indices. However, in some cases larger IDR can be associated with lower damages (as seen of the top right of Figure 19b). This phenomenon, denoted "resurrection from death", was first identified by [60] when analyzing IDR under IDA. Figures 16 and 18 also show that the same damage index can be expected from a subduction earthquake with an intensity significantly lower than the corresponding crustal earthquake intensity. This difference tends to increase as the peak IDR increases since the slope of the two lines, corresponding to the two types of earthquakes, is significantly different. Figures 16 and 18 also show tables with the CoVs of the peak IDR at two reference damage index values, i.e. 0.2 and 0.4. Results indicate that the CoV for subduction records are always greater or equal to that of crustal records. This highlights the limitations of the IDR as a surrogate for quantifying damage for subduction earthquakes.
As a conclusion, it can be stated that damage measures based on the peak IDR underestimate the potential consequences of long duration earthquakes. To accurately compute structural
Copyright c0000 John Wiley & Sons, Ltd. Earthquake Engng Struct. Dyn. (0000)
damage, it is paramount to define more accurate performance measures to use with both crustal and subduction earthquakes.
(a) Median Park and Ang Damage Index (b) Median Reinhorn and Valles Damage Index
0 2 4 6 8 10
0 0.2 0.4 0.6 0.8 1
Median Peak Interstory Drift Ratio (%)
Damage Index
Crustal DIPAstructural
Subduction DIPAstructural
Crustal DIPAmax-element
Subduction DI
PA max-element
0 2 4 6 8 10
0 0.2 0.4 0.6 0.8 1
Median Peak Interstory Drift Ratio (%) Damage Index Crustal DI
RV structural
Subduction DI
RV structural
Crustal DIRVmax-element
Subduction DIRVmax-element
CoV DI
Structural DImax-member
DI=0.2 DI=0.4 DI=0.2 DI=0.4
Sub. 52% 53% 18% 58% Cr. 17% 37% 16% 41%
CoV DI
Structural DImax-member
DI=0.2 DI=0.4 DI=0.2 DI=0.4
[image:20.595.104.486.104.254.2]Sub. 62% 60% 49% 62% Cr. 20% 39% 15% 23%
Figure 16. SEA9 Building: Median Damage Indices as a Function of the Median Peak Interstory Drift Ratio for Shallow Crustal and Subduction Zone Ground Motions: (a) Park and Ang Damage Index
(DIP A); and (b) Reinhorn and Valles Damage Index (DIRV)
0 2 4 6 8 10
0 0.2 0.4 0.6 0.8 1
Peak Interstory Drift Ratio (%)
Damage Index
Crustal DIPAstructural
Subduction DIPAstructural
Crustal DI
PA max-element
Subduction DIPAmax-element
0 2 4 6 8 10
0 0.2 0.4 0.6 0.8 1
Peak Interstory Drift Ratio (%) Damage Index Crustal DI RV structural
Subduction DI
RV structural
Crustal DI
RV max-element
Subduction DIRVmax-element
(a) Park and Ang Damage Index - GM Pair #8 (b) Reinhorn and Valles Damage Index - GM Pair #8
Figure 17. SEA9 Building: Damage Indices as a Function of the Peak Interstory Drift Ratio for Ground Motion Pair Number 8: (a) Park and Ang Damage Index (DIP A); and (b) Reinhorn and Valles Damage
Index (DIRV)
7. CONCLUSION
Structural damage estimation in civil engineering infrastructure due to long duration ground motions has received less attention than short duration earthquakes. As a result, present codes as well as performance-based design methodologies are typically based on response and damage measures calibrated to short duration shallow crustal earthquakes. Subduction zone earthquakes are responsible for developing ground motions longer than those expected to develop due to shallow crustal earthquakes. Even though some recent studies have shown that longer duration ground motions may lead to greater collapse risk, an extensive assessment of the influence of ground motion duration on structural damage is still lacking in the earthquake engineering literature. This paper aims at partially bridging that knowledge gap.
[image:20.595.104.488.317.468.2]![Table I. Physical Interpretation of the Damage Indices [35]](https://thumb-us.123doks.com/thumbv2/123dok_us/8595662.371596/3.595.174.420.568.627/table-i-physical-interpretation-damage-indices.webp)