Mixed Method Approach in Designing Flight Decks
with Touch Screens: A Framework
Huseyin Avsar, Joel E. Fischer, Tom Rodden Mixed Reality Lab
The University of Nottingham
{psxha6, joel.fischer, tom.rodden}@nottingham.ac.uk
Abstract— Touch screen technology’s first public appearance was in the early 2000s. Touch screens became a part of the daily life with the invention of smartphones and tablets. Now, this technology has the potential to be the next big change in flight deck design. To date, mobile devices are deployed by several air carriers to perform a host of non-safety critical pre-flight and in-flight tasks. Due to high safety requirements requested by authorities, new technologies cannot be adopted as fast as in other settings. Flight deck evolution, which is briefly presented in this paper, is reflecting this natural time delay. Avionics manufacturers are exploring and working on future concepts with touch screen displays. This paper investigates the potential benefits and challenges of touch screen technology on flight decks by means of a variety of qualitative and quantitative research methods (mixed method approach). On the basis of this, a framework was constructed showing the relation between various aspects that could impact the usability of touch screens on the flight deck. This paper concludes with a preliminary questionnaire that can help avionic designers to evaluate whether a touch screen is an appropriate user interface for their system.
Keywords— Flight Deck Design, Avionics System, Mixed Method, Framework, Touch Screen, Usability, Evaluation
I. INTRODUCTION
Cambridge dictionary defines the “flight deck” (or cockpit) as the part (located in front) of an aircraft where the pilot sits and where the controls (and instruments) are. It is a safety critical environment where pilots can see various instruments (information output) to monitor the state of the aircraft (e.g., speed, altitude and attitude) and use controls (input) to change the state. To serve the purpose of this paper the flight deck evolution described in the following sections will largely focus on how pilots retrieved information and interacted with the aircraft system.
In 1903 Wright brothers made the first controlled, sustained powered flights. At that time there were only three instruments on board and there was no enclosed cockpit. The pilot was only able to control the aircraft for 59 seconds and covered 260 meters [1]. The demand for more flight information increased once aircraft were able to fly higher, faster and farther. Avionic systems made it possible to navigate through airspaces and to communicate with other aircraft and ground units. Systems and instrumentation in this period were analogue electro-mechanical or only electro-mechanical designs. Every meter, gauge, indicator and readout provided one particular information from
a (in few cases multiple) sensor and needed its own space in the cockpit. The number of instruments grew exponentially, which caused physical constraints on the flight deck. There were significant improvements in performance. For example, Lockheed SR-71 (1966-1998) was able to fly beyond three times the speed of sound at an altitude of 25 000 meters [2]. However, the appearance of instruments and the way of interaction on the flight deck has barely changed between 1930 and 1980.
The number of instrumentation was so enormous that large commercial aircraft like Boeing 314 Clipper (1938-1941) was flown by a crew of five: two pilots, a flight engineer, a navigator and a radio operator. In the following 30 years, automation and advancement in avionics systems reduced the number of crewmembers from five to three. However, towards the end of the 1970s the number of mechanical instruments and controls in a commercial aircraft was more than one hundred [3]. Computer based technology which could increase the level of automation was available at that time, but they did not meet the safety requirements. This technology required another 10 years until it found its way into the cockpit.
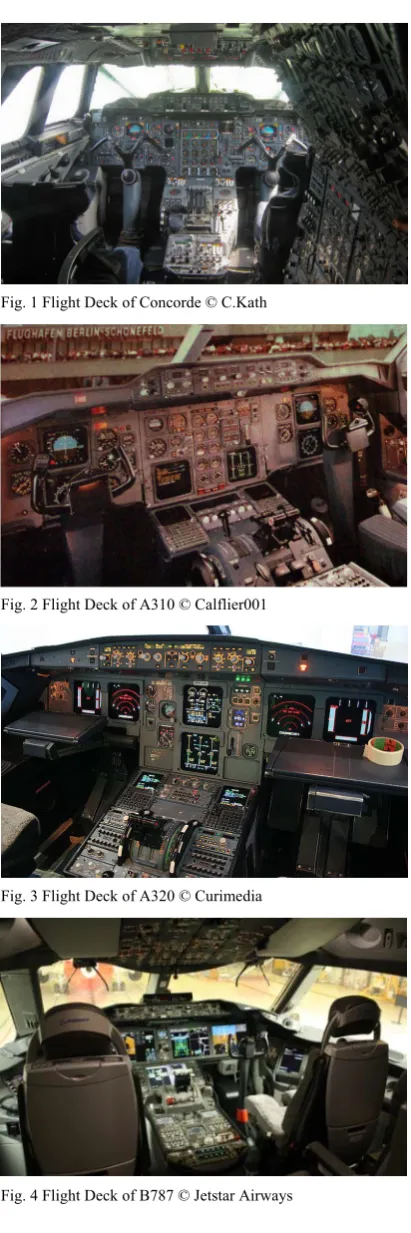
The flight deck of the Concorde (1969-2003) can be categorized as a classical or conventional flight deck [4]. Fig. 1 shows the flight deck layout of the Concorde [5]. This cockpit was packed with analogue instruments and gauges, and compared to current flight decks there was almost no automation, which required more active flying by the pilots. Pilots were overwhelmed with information which result in increased crew workload and attention demand. This prevented a further reduction in the minimum number of crewmembers.
pilots to create their flight plan through a keyboard, which is illustrated on the map display. There were also other avionic systems that had a digital readout, however controls were still mechanical.
The second generation of “glass cockpit”, which include A320 (1987), had a higher level of automation. The flight deck of the A320 is shown on Fig. 3 [7]. Previously pilots had to actively fly and monitor the state of aircraft. Some models of this generation enabled coupling of autopilot with FMS. The majority of the workload was transferred from flying the aircraft to monitoring automatics. CRTs were replaced by active matrix liquid crystal displays (LCDs) that are thinner, generate less heat and consume less power [8]. The number of displays were similar to the first generation “glass cockpit”. The reduction of analogue instruments on the dashboard is remarkable. Mechanical gauges and warning lights in previous generation were replaced, although there were some analogue instruments as backups in case of display failure. Significant changes were made on information output. Automation reduced the number of input devices; however, controls (input) were still implemented using hard controls like buttons, switches and sliders.
The Boeing 777 (1995) was the first commercial aircraft that incorporated “cursor control”, allowing pilots to use a touchpad to interact with “soft buttons” on certain displays [9]. The Boeing 787 (2011) has one of the newest flight decks (Fig. 4 [10]). It has fewer but larger displays and there are few hard controls installed on the dashboard. A significant advancement in terms of information retrieval replaced paper documents with integrated Electronic Flight Bags (EFB). Pilots had access to various paper charts and checklist through the EFB, which reduced the search time significantly (located on the diagonal of both pilots) [11]. In the area of avionics systems more advances were made in the past two decades than previous 90 years. Comparing this flight deck with its predecessors the consolidation of input and output devices is noticeable.
Touch screen technology offers a new way of intuitive interaction, which can push this trend to its limits where the majority of interaction occurs through interactive displays. All information and input keys can be accessed through the same interface, so there is less physical or space constraints [12]. Touch screens are adaptable to any configuration by changing the underlying software, and they do not require removing and reconfiguring physical input devices [13]. Zero displacement between input and output, control and feedback, hand action and eye gaze, make touch screens very intuitive to use. In addition, it helps users to keep their attention, reduce cognitive effort, search time and motor movement [14]. A comparative study between various input devices revealed the touch screen as the most effective input method for navigations through subsystems [15]. However, compared to their physical counterparts the biggest drawback of touch screen interaction is unwanted and accidental touches [16]. Another significant drawback is the absence of tactile feedback which request users to focus solely on the screen [11].
More recently, Original Equipment Manufacturers (OEM) have recognized the potential benefits of this technology and started to explore opportunities for the integration of touch screens in and around the flight deck. This applies both for military and commercial aviation. An example for military is
Fig. 1 Flight Deck of Concorde © C.Kath
Fig. 2 Flight Deck of A310 © Calflier001
[image:2.595.54.260.104.722.2]Fig. 3 Flight Deck of A320 © Curimedia
the flight deck of the Lockheed Martin F-35 [17] and for commercial aviation is the flight deck of the Gulfstream G500/600 [18].
Advancement in avionics systems cannot prevent that ‘human error’ is the primary cause for fatal accidents. According to Boeing [19] more than 80% of accidents are caused by the flight crew, which makes reduction in the potential for these errors through good interface design even more important. The aim of this paper (and research project) is to explore the potential benefits and challenges of touch screens in flight deck environments. In conjunction with avionics experts (GE Aviation) and pilots (Spanish Maritime Rescue Agency) foundation of a framework was constructed, which served as a guide for qualitative and quantitative research. The complete framework, which is discussed in this paper, can be used to study and evaluate the suitability of touch screens on flight decks. The main part of this paper will draw on applied methodology and research conducted within this research project (EPSRC ICase PhD Studentship) and related work essential to design usable flight decks with touch screen interfaces in order to develop the framework.
II. RESEARCH QUESTIONS
Within this research project a number of research questions are addressed, which have been iteratively developed from the literature and empirical findings:
1. What is the impact of inflight vibrations on error rates and usability?
2. Is there a difference in performance for device placement (display fixed or mobile)?
3. What is an appropriate size for interactive elements (button size) on a touch screen installed in a flight deck?
4. What is the preferred hold strategy in mobile placement? 5. What should be the physical shape of the display, so it
supports usability?
6. Which areas on the display have an increased error rate? 7. Is there a difference in performance for different display
positions?
8. Is there a difference for display displacement in vertical and horizontal direction?
9. Does the handedness effect the usability?
10. What are physical and interface countermeasures for handedness?
11. What features, functionality and content are pilots expecting from a mobile device?
12. What are physical expectations from a mobile device? 13. How will pilots use mobile devices on the flight deck? 14. What are interface design guidelines for one handed thumb
operation?
15. What is the impact of increased G-Force on error rates and usability?
16. How are fatigue symptoms affected with increased G-Force?
17. Can experience and fitness influence overall performance? 18. Which input method provides the best and safest
interaction method for radio frequency changes?
After the mixed method approach is introduced, findings from applying the approach will be used to address these research questions in the same order. The framework is then synthesized from the findings in order to show the relationships between independent and dependent variables.
III. METHODOLOGY
This section will focus on the methodology that underlies the research presented in this paper. Applying one particular research method would not suffice to address the research questions that were required to understand potential benefits and challenges of touch screens on the flight deck. Therefore, a mixed method [20] approach is adopted where qualitative and quantitative data collection is integrated. The technique of using multiple sources to generate new knowledge (triangulation) will answer research questions from a number of perspectives [21].
At the beginning of the project, variables were unknown that could affect touch screen usability on the flight deck. A two-phase ‘Exploratory Design’ was selected where the results of the first method (qualitative) were used to develop the second method (quantitative) [22]. Experienced researchers in Human Factors or in Human-Computer-Interaction are often able to hypothesise whether an independent variable can cause a significant effect on a dependent variable. The more interesting challenge is to find the ‘effect size’ that shows the strength of the difference between the levels of independent variables [23]. Thus, a ‘taxonomy development model’ was applied where, the initial qualitative study is conducted to identify important variables and relations, and the following quantitative phase to test these results more in detail [24].
The taxonomy development model was applied twice in this research project. Sections A, B and C (in Chapter IV) show the first approach and section D and E show the second approach. Both approaches start with a qualitative research (A and D) where the outcomes are used to create the empirical experiment (quantitative). The last section F is a user study where all findings from previous research were used to create the study. Applied qualitative and quantitative research methods will be introduced;
1) Interviews
Semi-structured interviews were conducted during initial conversations with avionic experts, after each experiment and the study described in section D. The interviews served the function of defining important variables, creating scenarios and questionnaires.
2) Pilot Studies
With the aim to identify and correct problem areas, evaluate the feasibility of task, adjust levels of independent variables pilot studies were conducted with at least three participants.
A major contribution of the pilot study was the modification of task design in the field study (section B [25]). Two-dimensional Fitts’ Law Experiment (as stated in ISO 9241-9 [26]) is one of the common methods to evaluate (or compare) input device in various conditions. The task is to tap targets located around a circle in a sequential order. Since the location of the next target was predictable, participants tended to hover over the next target with one hand while tapping the current target with the other hand. Restricting participants to use only one hand would have conflicted with the goal of seeing how participants would use the device in a real world situation. Thus, it was decided to modify the task in which the size and the distance of the targets changed dynamically after each tap.
Another contribution was shaping the levels that defined display positions in the lab experiment described in section C [27]. Initially, it was envisioned to have more distinct display positions, however the pilot study revealed that participants cannot cope with this experimental setting. Therefore, levels of various independent variables were reduced so it was possible to conduct the experiments within two days (per participant).
In the lab study described in section E [28], which explored the potential impact of increased G-Force on touch screen usability, participants who piloted this study determined the level of simulated G-Forces to be tested in the real experiment.
3) Field Trials
In a real world setting (search and rescue helicopters) the impact of in-flight vibration on touch screen usability was investigated (section B). The investigator controlled the order of the experiment and recorded his observations. This was a semi-controlled task where the crew conducted the experiments at their own discretion, in periods of downtime from their primary activities. If participants exceed a certain amount of time on task the investigator asked to stop the task.
4) Lab Experiment
The majority of reviewed studies that compared or evaluated touch screen usability were conducted in a lab environment. This type of experiment can be easily controlled and more accurate measurements can be achieved. Research questions about the impact of display position and increased G-Force on touch screen usability were addressed with data collected and analysed from lab experiments.
5) Questionnaires
In addition to empirical measurements, an independent rating scale was used to assess subjective impressions in the lab studies. The independent rating scale taken from ISO-9241-9 have two group of indices; general and fatigue indices. On a 7-point scale the questionnaire was formatted in a positive direction, with the highest values being associated with the
most positive impressions. These data were used to understand and support quantitative data.
After the experiments the investigator conducted a semi-structured interview with participants about their experience and observations. After all participants finished the experiment, all statements were collected and a post-experiment questionnaire was created. On a five-point Likert scale participants rated if they would agree with the issues that other participants mentioned.
A similar approach was also applied during interviews with pilots where the aim was to explore features, content and functionality of mobile devices on flight decks (section D [29]). The investigator took note of statements that pilots made from the previous interview. These statements were asked to other pilots whether they would agree with their colleagues. Information gained from these interviews were used to create a scenario. The scenario describes the daily life and routine of a pilot and how he uses his tablet device to complete various tasks. Participants task will be to tick the features and functionality that they would like to see on a mobile device in the future.
6) Simulation
There are four different simulation methods; live, virtual, constructive and hybrid [30]. Live simulations involve live people using real systems. In example, the field trial described in section B. The lab studies described in section C and E are examples for virtual simulation where live people use a simulated system. In constructive simulation both people and system are simulated. In section D, participants were asked about their physical expectations from a mobile device. A digital human modelling software was used to determine the optimal size of a mobile device which can be used by the majority of pilots. A hybrid simulation is a combination of these simulation methods, where real people use proposed operational equipment in a simulated operational environment [31]. The second part of section E describes the human-centrifuge project where pilots used the same equipment as pilots do in a fast jet aircraft.
7) User Study
Findings from previous research was used to create a new user interface, that pilots could use to manipulate radio frequencies [32]. The aim was to compare input methods and to figure out flaws in the interface design.
IV. RESEARCH
Fig.
5 Fr
am
ewor
k
of the Resear
ch for
T
ouchscr
een I
nteg
ration on Flight Decks
Qu
an
titativ
e Fi
nd
in
g
Qu
alitativ
e Fi
nd
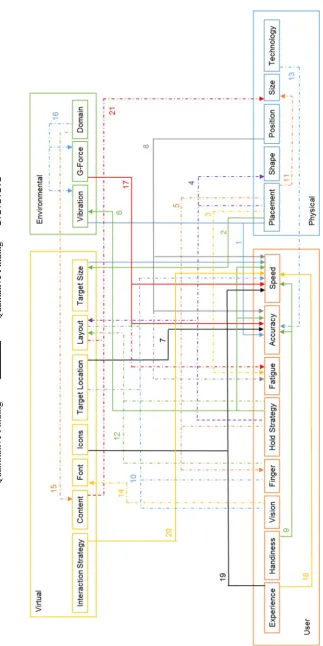
[image:5.595.137.461.61.709.2]Solid lines are quantitative findings, derived from empirical measurements and statistical analyses. Dotted lines are qualitative findings from interviews, questionnaires and informal conversations with experts and participants. In the following sections studies will be introduced briefly and findings will be summarised to provide the rationale for the framework. Superscriptions (numbers) at the end of each finding are provided in Fig. 5.
A. Initial Interviews with experts and pilots
Initial conversations with avionics experts and pilots revealed that in-flight vibration, placement of the display and interface could have a significant impact on touch screen usability. Except inflight vibration (environmental) all other factors are broad terms which need to be operationalised in more specific terms. Broadly formulated there are two types of display placements; mobile and fixed. The position of fixed displays within the cockpit is another factor that needed further investigation. Interface elements are: size of interactive elements (target size), layout, font type/size and icons. Environmental, physical and virtual factors are independent variables that can influence user performance. The performance is subdivided into speed of interaction, accuracy and fatigue. We had the opportunity to conduct experiments in search and rescue helicopters in Spain. It was not possible to include all independent variables in this experiment. It was decided to investigate the impact of inflight vibration, target size and device placement during the field trials and conduct a separate lab study to explore the impact of display position on usability. These both studies are presented in section B and C.
B. Inflight Vibrations (Questions 1-6)
In this study the impact of inflight vibrations on touch screen usability was investigated. A 2x3x4 within-subjects design with repeated measures was used for the experiment [25]. Independent variables in this experiment were device placement (2 levels - mobile and fixed), vibration (3 levels – cruise, transition and hover) and target size (4 levels – 5 mm, 10 mm, 15 mm and 20 mm). This was the first in-flight study in which touch screens were evaluated under real conditions. For safety reasons pilots did not participate in this study. Participants were hoist operators and rescue swimmers on board of the helicopter. 14 male crew members conducted the experiment. Their age ranged from 27 to 52 years (M=35.6, SD=11.8). On a tablet device participants performed a modified Fitts’ Law Experiment. Tasks were performed with two different device placements; mobile and fixed. In the mobile condition, participants hold the device while performing the task. In the fixed condition, the tablet was attached to a suction cup holder.
Main implications for the framework are: device placement, vibration and target size have significant effects on targeting accuracy and performance (1). However, increasing target size eliminates the negative effects of placement and vibration in most cases. The findings suggest that 15 mm targets are sufficiently large for non-safety critical Electronic Flight Bag (EFB) applications. For interaction with fixed displays where
pilots have to extend their arms, and for safety critical tasks it is recommended to use interactive elements of about 20 mm (2). Degrading effect on touch screen performance in non-stationary environments were also detected in other studies; walking [33] motion platform [34], tractor [35], car simulator [36], car [37] and flight simulator [13].
It was observable and it was reported by participants that conducting experiments in fixed setting was more fatiguing than performing the experiments in mobile placement (3). Participants tried to stabilize (hold) their hands while interacting with the device in fixed placement. This phenomenon was also observed by pilots interacting with the aircraft system installed on the pedestal (centre console). Fixed displays should be designed such a way that it enables pilots to stabilize their hands from all directions and interactive elements should be placed along the sides (4). In mobile placement participants held the device always in landscape mode. The majority of participants held the device with their non-dominant hand and performed the experiments with their dominant hand’s index finger. In few cases participants hold the device with both hands and used their thumbs to conduct the experiments (5). Vibration measurements revealed that the human body is able to absorb a certain amount of vibration. In mobile placement participants were able to use the device inside the “zone of convenient reach [38]” causing the device to vibrate similarly to their body. Results revealed that participants were significantly faster and more accurate in mobile placement (6). This finding is coherent with Hong et. al [39] that compared various input devices in a military vehicle. Participants had a higher accuracy on tapping targets displayed on the centre of the display. The error rate increased for target displayed near the edge of the screen (7). This finding was consistent with previous research [40]–[42].
C. Display Positions (Questions 7-10)
The display position within the cockpit was identified as a potential factor that could affect touch screen usability, which was confirmed by a lab study [27]. This was the first experiment that investigated the impact of various display positions on performance following Fitts’ Law Experiment (ISO 9241-9) [26]. A 5x2x2 within-subjects design with repeated measures was used for the experiment. The primary independent variable in this study was display position which was defined by the angular display position (5 levels - on angles with 45° increments), displacement in vertical (2 levels- near and far) and horizontal direction (2 levels – high and low). 10 participants (2 female) were recruited from the local university campus. Two were female and two participants were left-handed. The mean age was 27.4 (SD=3.4). Participants performed the tapping task on a 10-inch tablet attached to a tripod.
positions. There was no significant difference found for vertical displacement. Subjective experience for general and fatigue indices were analogue to empirical results (8). The impact of display position on touch screen performance was also found by Chourasia et al. [43]. There was a significant difference for experiments in performance and accuracy conducted with dominant and non-dominant hand (9). This was also found by Perry and Hourcade [44]. Participants mentioned that in some display positions their hand occluded the next target and they mentioned that this slowed down their movement. Placing interactive elements along the edges (except top edge) and preserving the centre of the display to display information, as suggested in the field trials, would prevent occlusions (10).
D. Content, Features and Functionality (Questions 11-14)
Many air carriers have recognized the potential benefits of paperless cockpit and adopted (or are in transition phase) tablets to replace conventional flight bags. A study was conducted with the aim to explore and understand potential benefits and challenges of an Electronic Flight Bag (mobile device) [29] in a search and rescue (SAR) environment. The primary aim of this research was to define features and functionalities of a mobile device within a flight deck environment. A review of related work, operational observations and interviews with SAR pilots were conducted to understand and specify the use of context within this particular area. Interviews were conducted with 8 pilots from Spanish Maritime Safety Agency. Flights were recorded for further analyses.
Physical expectations from a portable EFB are maximised screen real estate, while minimising overall weight. It should fit properly onto the knee and there should be room on the thigh to rest the arms. A Digital Human Modelling Software was used to determine physical constraints of the device. Results revealed that 8.5 inch tablets attached to a kneeboard would meet these requirements (11). For flight decks with dedicated mounting device it is recommended to have bigger tablets. In the field studies it was suggested to use 20 mm targets for fixed devices, this is approximately 33% larger than recommended target size for mobile devices. This will decrease the area on the display which can be used to display information. Another request was that the device should be usable with one hand (thumb), because pilots would use the other hand to hold the control stick. The majority of pilots could reach up to 5 cm away from the display edge. Placing interactive elements within this limits would enhance supported one hand operation (12). Pilots suggested to have a kneeboard that can be tilt up to adjust viewing angle and a design that prevent heat transformation from the tablet onto the knee. Pilots mentioned that in addition to in-flight vibrations, increased G-Force might have a decremented effect on touch screen usability. To avoid accidental touches pilots suggested to use a pressure activated touch screen technology. Dodd et al. [13] compared capacitive and resistive touch technology in a simulator. Results revealed that users are likely to make more errors on more sensitive capacitive touch screen (13). Pilots stated that in high vibration periods it is difficult to retrieve information from the head down displays therefore it is recommended to apply appropriate large fonts (12-14 pt.) (14).
A scenario was generated with the aim to figure out features, content, and functionality that pilots would like to see in their EFB, which will be distributed to other pilots. It is predictable that each domain (military, commercial or parapublic operations) will have their own specific requirements and expectations (15). It is intended to be a future work to investigate other domains to see differences in expectations. For new applications system designers should involve pilots from the beginning of planning and development phase. Each stage of the development should be evaluated with user studies. An example for user studies is given below in section F.
E. Increased G-Force (Questions 15-17)
In the previous study pilots stated that increased G-Force might have an impeding factor on touch screen usability. A lab study was conducted to understand the potential impact of increased G-Force on touch screen usability (fixed display position) [28], which was unexplored at that time. The magnitude of in-flight vibration and alternating G-Force depends on the domain, operational conditions, weather and size/type of the aircraft (16). A 3x2x3 within-subjects design with repeated measures was used for the experiment. Primary independent variable in this lab experiment was simulated G-Force (3 levels – 1-G, 2-G and 3-G). Secondary independents variables included target width (2 levels – 55 px (15 mm) and 75 px (20mm)) and target distance (3 levels – 100, 300 and 900 px). 10 male participants were recruited from the local campus. Their age ranged from 23 to 33 years (M=25, SD=2.87). A weight adjustable wristband was used to mimic increased G-Force. On a 17-inch resistive touch screen display participants performed a two-dimensional tapping task (designed after ISO 9241-9). The weight of the wristband was increased to simulate 2G and 3G conditions.
The key finding is that increased G-Force has a large effect on performance and fatigue indices. While the simulated G-Force increased linearly, performance decreased exponentially, and movement time increased exponentially. This was also reflected by subjective ratings across all conditions. Controversially the error rate was better with increasing G-Force, due to the unusual condition that slowed participant’s movement speed down (17). Personal fitness and experience with touch screen usage was found to be a compensating factor (18).
Since the lab study did not simulate increased G-Force in a realistic way it was recommended to transfer this setting to a human centrifuge where ecological valid results can be achieved.
F. Comparative user study (Question 18)
52 (M=42.2, SD=5.6). Logged flight hours ranged from 2 500 to 7 800 (M=4560, SD=1637). An 8-inch tablet was used for input via virtual keyboard and drag & drop strategy. The FMS was used for input via physical keyboard. The task was to configure the avionics system (set and manipulate radio frequencies) to simulate departure and approach from/to airports.
The interface was constructed from findings mentioned in previous sections. Interface elements which were out of scope of the research area were colour and icon (symbology) usage. Advisory circular 25-11B explain colour coding in aviation and the functional meaning related with each colour [45]. To avoid distraction grayscale was used in a pronounced form and other used colours comply with this standard. Using symbols have potential benefits like fast recognition [46], reduction of the necessity to read, saving space and supporting learning of a system. To achieve these benefits symbols must be immediately recognizable to the targeted user population [47]. Therefore, the experience of pilots plays a key role in selecting appropriate icons. Some icons were used in the interface which were selected with pilots and avionics experts (19).
Analyses of task completion time showed that touch interface is significantly faster and error proof than conventional input methods (via physical and virtual keypad). Results revealed that designing user interfaces that represent their real-word counterparts (skeuomorphism) will not improve the usability and that the design of user interface plays a key role in performance (20). Post interviews with pilots revealed that an 8-inch tablet is not sufficiently large for this task and interface. Pilots said that searching on a small area was difficult (21). This was also found by Hamblin [48].
V. QUESTIONNAIRE
This section will list a series of questions that designers can use to evaluate whether touch screen technology is a suitable input device for their system.
Does the task require pilots to focus solely on the screen? Touch screen technology requires users to look always at the screen while interacting with it. For operations conducted under instrument flight rules (IFR), this might be not an issue. Except at take-off and landing pilots are not relying on looking outside. This could raise a bigger problem for operations (e.g. SAR and military) where pilots have to look outside frequently. Generally, helicopter operations require looking outside. An analogue system is a better solution if pilots are likely to use the system while they are looking outside.
Is the magnitude of vibration/turbulence acceptable?
In-flight vibration and turbulence degrade the speed of interaction and more important the accuracy. For future designs it is recommended to explore the environment in which pilots will interact with touch screens. The type and weight of an aircraft, operation altitude, speed and weather are major factors that will determine the magnitude of movements (e.g. vibrations) within the flight deck. Preferable, evaluation experiments should be conducted under worst case (turbulent, vibrating) conditions.
Pilots do not have to wear gloves? The majority of
commercial and general aviation pilots do not wear gloves. Other domains like military or SAR operations require pilots to wear heat resistant gloves. Current, capacitive touch screen technology should be avoided if pilots are likely to use gloves during operation. It is predictable that wearing gloves will increase errors which is asked in the following question.
Are accidental touches acceptable? Previous studies
showed that the biggest drawback of using touch screens are unwanted and accidental touches. Therefore, safety critical tasks should receive a safety layer in form of a confirmation box or replaced with traditional physical switches.
Will the device be large enough for interactive elements
and information? Recommended size for interactive elements
for interactive displays are significantly larger than interfaces designed for mouse or trackpad usage. This will consequently decrease the space for displaying information. As a result, designers will require a larger space (display).
Will the position of the screen provide adequate
ergonomics? The position of the display has a significant
impact on performance and fatigue. The number and frequency of interaction will play a significant role in addressing this problem. Since the flight deck has a limited space an interface which will be used rarely can be positioned at a place which is uncomfortable to view and use.
Can pilots stabilize their hands while interacting? Pilots are likely to hold the device to stabilize their hands while interacting with the system. Another solution is to design a padding underneath the arms. Providing a design that enables hand stabilization would improve the accuracy. It would be beneficial if the touch screen technology can perform palm rejection as then pilot could stabilize their hands against the screen. This would be an advantage for larger screens where not all areas of the screen can be operated whilst stabilizing against the bezel.
Answering “Yes” to many of the questions above suggest that a touch screen interface is a suitable solution for the intended device. Answering “No” to a given question does not mean that touch screen technology is not a suitable solution. It should be considered how the associated factor might affect the device usability and safety. Potential countermeasures to mitigate degrading factors are given in the previous sections. These questions should provide avionics designers with an initial idea whether a touch screen interface is worth considering.
VI. DISCUSSION
The findings from the study presented in this paper are discussed in the cited papers ([25], [27]–[29], [32]). This discussion will focus solely on the methodology and framework.
data, and then quantitative data is a logical and intuitive approach [49]. This is especially true for research areas where important variables and relationships are unknown. Findings from qualitative research has been validated through quantitative research which provided a better understanding of the topic. All mentioned findings could not be achieved with only quantitative or qualitative methods alone.
Qualitative research at the beginning was done with semi-structured interviews with experts and pilots. It was possible to ask for clarification and to add questions which enabled going deeper into the topic and to receive valuable information. Interviewees shared their ideas, expectations and insight views. Since these interviews were done with multiple participants, more information was gathered from discussions between participants. Such information could not be captured in a survey. Analysing open-ended questions, and discussions made the interviews the most challenging part to analyse. It was even harder than the field study where the investigator had a limited control over the experiment.
Pilot studies played a key role in evaluating experimental settings. Problem areas that were identified saved significant time. Problems in lab experiments may cause a moderate setback. However, in the field studies (in-flight and human-centrifuge study) we had limited access and time, so an issue in experimental design could have caused a significant problem.
Participants might behave differently in a lab experiments due to the fact of being observed and in a different environment. Being observed can cause participants to make short-term improvements which would not be the case in a real world situation [50]. Therefore, results achieved in a field study have a higher ecological validity. The biggest limitation is that the investigator has less control over the experiment, which makes it difficult for another researcher to replicate the study.
Lab based experiments have the advantage of conducting the experiment in a controlled environment. Compared to field trials the investigator has the freedom to decide where and when the experiment will be conducted. Since a standardized procedure is used it is easier for other researcher to replicate a laboratory experiment. As mentioned before the majority of touch screen evaluation experiments is conducted in a lab environment. Therefore, it is easier to compare the results with other studies and to position the work in the literature.
International Standard Organisation (ISO) questionnaires dealing with general and fatigue indices supported the understanding and interpretation of quantitative data in lab-based studies. Especially, questionnaires that were generated with participant statements and distributed to participants once the empirical work was finished provided a more comprehensive understanding of the overall outcome.
The findings from all the research conducted within this research project and other relevant studies were used to create the interface which was used in the comparative user study. In each conducted experiment touch screen technology proofed to have the potential to be a good input device, if certain aspects
are considered in the design process. The user study showed that touch screen interface (even if it had room for improvement) compared to conventional input methods is a better solution for frequency manipulation tasks.
The complete framework shows that there are many factors that impact user performance. Findings suggest many countermeasures to mitigate potential negative effects. The current state of the framework illustrates the beginning of a long journey of future work that could apply, refine and extend the framework.
VII.CONCLUSION
Potential benefits and challenges of touch screen on the flight deck were explored with various qualitative and quantitative studies. Findings from these studies were used to construct a framework that shows the relations between the four key factors (environment, physical, virtual and user). A preliminary questionnaire that avionics designer can use to determine whether touch screen technology is a suitable interface for their system was presented.
VIII.ACKNOWLEDGMENTS
I would like to thank the Spanish Maritime Safety Agency and INAER for opening their facilities. Especially, Nestor Perales Gomez who organized my visits, flights and approved required permissions. I would like to thank GE Aviation Systems Ltd., which is the industrial partner of my EPSRC ICase (EP/K504506/1) PhD Program. I would like to thank Veronika Stibane for proof-reading this paper.
IX. REFERENCES
[1] Wright Brothers Aeroplane Company, “Wright Flyer,” 2010. [Online]. Available: http://www.wright-brothers.org/. [Accessed: 05-May-2016]. [2] LockheedMartin, “Cretaing the blackbrid,” 2013. [Online]. Available:
http://www.lockheedmartin.co.uk/us/100years/stories/blackbird.html. [Accessed: 28-May-2016].
[3] L. Wallace, “Airborne Trailblazer: Two decades with NASA Langley’s 737 flying laboratory,” 1994.
[4] C. Spitzer, U. Ferell, and T. Ferrell, Digital Avionics Handbook. CRC, 2000.
[5] C. Kath, “Concorde flight deck layout,” 2006. [Online]. Available: www.wikipedia.org/wiki/Concorde. [Accessed: 28-May-2016]. [6] Califlier001, “Interflug Airbus A310,” 2014. [Online]. Available:
https://www.flickr.com/photos/calflier001/13155123603. [Accessed: 07-Jul-2016].
[7] Curimedia, “Airbus A320-214,” 2011. [Online]. Available: https://www.flickr.com/photos/calflier001/13155123603. [Accessed: 07-Jul-2016].
[8] D. Harris, Human factors for civil flight deck design. Gower Publishing, Ltd., 2004.
[9] K. H. Abbott, The Avionics Handbook, Chapter 9: Human factors
engineering and flight deck design. Boca Raton: CRC press LLC, 2001.
[10] J. Airways, “Boeing 787 Dreamliner flight deck,” 2011. [Online]. Available: https://www.flickr.com/photos/jetstarairways/6769120147/. [Accessed: 07-Jul-2014].
[11] S. Kaminani, “Human computer interaction issues with touch screen interfaces in the flight deck,” in AIAA/IEEE Digital Avionics Systems
Conference - Proceedings, 2011, pp. 6B4–1–6B4–7.
IGI Global, 2013, pp. 270–297.
[13] S. Dodd, J. Lancaster, A. Miranda, S. Grothe, B. DeMers, and B. Rogers, “Touch screens on the flight deck: The impact of touch target size, spacing, touch technology and turbulence on pilot performance,” Proc.
Hum. Factors Ergon. Soc. Annu. Meet., vol. 58, no. 1, pp. 6–10, Sep.
2014.
[14] P.-A. Albinsson and S. Zhai, “High precision touch screen interaction,”
in Proceedings of the SIGCHI Conference on Human Factors in
Computing Systems - CHI ’03, 2003, p. 105.
[15] D. Jones, “Three input concepts crew interaction presented electronic for flight with information on a large-screen cockpit display,” 1990. [16] A. Degani, E. A. Palmer, and K. G. Bauersfeld, “‘Soft’ Controls for hard
displays: still a challenge,” in Proceedings of the Human Factors and
Ergonomics Society Annual Meeting, 1992, vol. 36, pp. 52–56.
[17] LockheedMartin, “F-35 simulator comes to Marana,” 2014. [Online]. Available: https://www.f35.com/news/detail/f-35-simulator-comes-to-marana. [Accessed: 15-Feb-2016].
[18] Gulfstream, “Gulfstream symmetry flight deck,” 2015. [Online]. Available: http://www.gulfstream.com/technology/symmetry-flight-deck. [Accessed: 01-May-2015].
[19] Boeing, “MEDA Investigation Process,” Aeromagazine , pp. 15–16, 2007.
[20] J. Creswell and V. Clark, “Designing and conducting mixed methods research,” 2007.
[21] J. Lazar, J. H. Feng, and H. Hochheiser, Research methods in
human-computer interaction. Wiley, 2010.
[22] J. C. Greene, V. J. Caracelli, and W. F. Graham, “Toward a conceptual framework for mixed-method evaluation designs,” Educ. Eval. Policy Anal., vol. 11, no. 3, pp. 255–274, Jan. 1989.
[23] S. B. Green, N. J. Salkind, and T. M. Akey, Using SPSS for windows :
analyzing and understanding data. Prentice Hall, 1997.
[24] A. Tashakkori and C. Teddlie, Mixed methodology : combining
qualitative and quantitative approaches. Sage, 1998.
[25] H. Avsar, J. Fischer, and T. Rodden, “Target size guidelines for interactive displays on the flight deck,” in 2015 IEEE/AIAA 34th Digital
Avionics Systems Conference (DASC), 2015, pp. 3C4–1–3C4–15.
[26] International Standard Organisation, “ISO 9241-9 Ergonomic requirements for office work with visual display terminals,” 2007. [27] H. Avsar, J. Fischer, and T. Rodden, “Physical and environmental
considerations for touchscreen integration on the flight deck,”
Unpublished, 2016.
[28] H. Avsar, J. Fischer, and T. Rodden, “Future flight decks: impact of +Gz on touchscreen usability,” in International Conference on Human
Computer Interaction in Aerospace: HCI-Aero, 2016.
[29] H. Avsar, J. Fischer, and T. Rodden, “Designing touch-enabled electronic flight bags in sar helicopter operations,” in International
Conference on Human Computer Interaction in Aerospace: HCI-Aero,
2016.
[30] D. Andrews, J. Brown, J. Byrnes, J. Chang, and R. Hartman, “Enabling technology: analysis of categories with potential to support the use of modeling and simulation in the united states air force.,” Mesa, AZ, 1998. [31] P. Hancock, D. Vincenzi, J. Wise, and M. Mouloua, Human factors in
simulation and training. 2008.
[32] H. Avsar, J. Fischer, and T. Rodden, “Designing touch screen user interfaces for future flight deck operations,” in 2016 IEEE/AIAA 35th
Digital Avionics Systems Conference (DASC), 2016.
[33] J. Conradi, O. Busch, and T. Alexander, “Optimal touch button size for
the use of mobile devices while walking,” Procedia Manuf., vol. 3, pp. 387–394, 2015.
[34] C. J. Lin, C. N. Liu, C. J. Chao, and H. J. Chen, “The performance of computer input devices in a vibration environment,” Ergonomics, vol. 53, no. 4, pp. 478–490, Apr. 2010.
[35] T. Baldus and P. Patterson, “Usability of pointing devices for office applications in a moving off-road environment,” Applied Ergonomics, vol. 39, no. 6. pp. 671–677, 2008.
[36] H. Kim, S. Kwon, J. Heo, H. Lee, and M. K. Chung, “The effect of touch-key size on the usability of in-vehicle information systems and driving safety during simulated driving,” Appl. Ergon., vol. 45, no. 3, pp. 379– 388, 2014.
[37] B. I. Ahmad, P. M. Langdon, S. J. Godsill, R. Hardy, L. Skrypchuk, and R. Donkor, “Touchscreen usability and input performance in vehicles under different road conditions,” in Proceedings of the 7th International Conference on Automotive User Interfaces and Interactive Vehicular
Applications - AutomotiveUI ’15, 2015, pp. 47–54.
[38] S. Pheasant and C. Haslegrave, Bodyspace: Anthropometry, ergonomics
and the design of work. 2005.
[39] T. C. Hong, N. A. Kuan, T. K. Kiang, and S. K. T. John, “Evaluation of Input Devices for Pointing, Dragging and Text Entry Tasks On A Tracked Vehicle,” Proc. Hum. Factors Ergon. Soc. Annu. Meet., vol. 55, no. 1, pp. 2078–2082, Sep. 2011.
[40] N. Henze, E. Rukzio, and S. Boll, “100,000,000 taps: analysis and improvement of touch performance in the large,” Proc. 13th Int. Conf.
Hum. Comput. Interact. with Mob. Devices Serv. - MobileHCI ’11, p.
133, 2011.
[41] Y. S. Park and S. H. Han, “Touch key design for one-handed thumb interaction with a mobile phone: Effects of touch key size and touch key location,” Int. J. Ind. Ergon., vol. 40, no. 1, pp. 68–76, 2010.
[42] D. Avrahami, “The effect of edge targets on touch performance,” in
Proceedings of the 33rd Annual ACM Conference on Human Factors in
Computing Systems - CHI ’15, 2015, vol. 1, pp. 1837–1846.
[43] A. Chourasia, D. Wiegmann, K. Chen, and M. Sesto, “Effect of sitting orientation on touchscreen performance, touch characteristics, user preference, and workload,” IIE Trans. Occup. Ergon. Hum. Factors, vol. 1, no. 4, pp. 235–245, Oct. 2013.
[44] K. Perry and J. Hourcade, “Evaluating one handed thumb tapping on mobile touchscreen devices,” Proc. Graph. Interface 2008, pp. 57–64, 2008.
[45] Federal Aviation Administration (FAA), “AC 25-11B - Electronic flight displays,” 2014.
[46] R. N. Shepard, “Recognition memory for words, sentences, and pictures,” J. Verbal Learning Verbal Behav., vol. 6, no. 1, pp. 156–163, 1967.
[47] W. Horton, “The icon book: visual symbols for computer systems and documentation,” New York: John Wiley & Sons, 1994. .
[48] Hamblin C, “Electronic Flight Bags (EFBs) with small screens significantly increase information retrieval times,” in Proceedings of
12th International Symposium on Aviation Psychology, 2003, pp. 463–
468.
[49] A. Onwuegbuzie and N. Leech, “Linking research questions to mixed methods data analysis procedures 1,” Qual. Rep., vol. 11, no. 3, 2006. [50] H. Landsberger, “Hawthorne revisited: management and the worker, its