1
2
3
Running head: Complexity of subcortical structures 4
5
6
7
Age-related differences in the structural complexity 8
of subcortical and ventricular structures 9
10
Christopher R. Madan† & Elizabeth A. Kensinger 11
Department of Psychology, Boston College 12
13
14
15
16
17
18
19
20
† Corresponding author. 21
Email address: [email protected] 22
Boston College, Department of Psychology, 23
McGuinn 300, 140 Commonwealth Ave., 24
Chestnut Hill, MA, USA 02467 25
Abstract 27
It has been well established that the volume of several subcortical structures decreases in relation 28
to age. Different metrics of cortical structure (e.g., volume, thickness, surface area, gyrification) 29
have been shown to index distinct characteristics of inter-individual differences; thus, it is 30
important to consider the relation of age to multiple structural measures. Here we compare age-31
related differences in subcortical and ventricular volume to those differences revealed with a 32
measure of structural complexity, quantified as fractal dimensionality. Across three large 33
datasets, totalling nearly 900 individuals across the adult lifespan (18-94 years old), we found 34
greater age-related differences in complexity than volume for the subcortical structures, 35
particularly in the caudate and thalamus. The structural complexity of ventricular structures was 36
not more strongly related to age than volume. These results demonstrate that considering shape-37
related characteristics improves sensitivity to detect age-related differences in subcortical 38
structures. 39
40
Keywords: 41
brain morphometry; age; atrophy; fractal dimensionality; thalamus; hippocampus; putamen; 42
ventricles 43
44
45
Acknowledgements 46
Portions of this research were supported by a grant from the National Institutes of Health 47
(MH080833; to EAK), a fellowship from the Canadian Institutes of Health Research (FRN-48
146793; to CRM), and by funding provided by Boston College. 49
MRI data used in the preparation of this article were obtained from: (1) the Open Access 50
Series of Imaging Studies (Marcus et al., 2007); (2) the Information eXtraction from Images 51
(IXI) dataset (funded by Engineering and Physical Sciences Research Council [EPSRC] of the 52
UK [EPSRC GR/S21533/02]); and (3) the BC data was acquired with the support of funding 53
from the Searle Foundation, the McKnight Foundation, and the National Institutes of Mental 54
1. Introduction 56
The structure of the brain changes with age, and these changes can be measured in vivo using 57
magnetic resonance imaging (MRI) (Creasey & Rapoport, 1985; Drayer, 1988; Kemper, 1994; 58
Raz & Rodrigue, 2006). While age-related differences are apparent throughout the brain, 59
differences are particularly evident in the volume of subcortical structures (Allen et al., 2005; 60
Goodro et al., 2012; Greenberg et al., 2008; Gunning-Dixon et al., 1998; Inano et al., 2013; 61
Jernigan et al., 2001; Long et al., 2012; Potvin et al., 2016; Raz et al., 2004, 2005; Tamnes et al., 62
2013; Walhovd et al., 2005, 2011; Yang et al., 2016). Accompanying these changes, the 63
ventricles also enlarge with age (Apostolova et al., 2012; Barron et al., 1976; Kaye et al., 1992; 64
LeMay, 1984; Walhovd et al., 2011; Nestor et al., 2008). Here we investigated age-related 65
changes in the shape of these same subcortical structures and tested if this additional information 66
could explain variance beyond that explained by volumetric changes. 67
Walhovd et al. (2011) conducted a comprehensive review of the literature examining age-68
related differences in subcortical structures. In their review, along with their own multi-sample 69
analyses, they found strong age-related differences in the volume of the putamen, thalamus, and 70
accumbens; other regions, including the caudate and amygdala, were relatively unaffected by 71
aging. Walhovd et al. also found volumetric differences in the lateral ventricles and third 72
ventricle to also be strongly related to age, but no age-related differences in the fourth ventricle. 73
In a supplemental figure (Walhovd et al., 2011, Figure S2), the authors additionally illustrated 74
age differences in the shape of these subcortical structures, though there was no accompanying 75
quantitative analysis of shape. 76
While it is known that there are age-related differences in cortical thickness and 77
gyrification (Hogstrom et al., 2013; Fjell et al., 2009; McKay et al., 2014; Salat et al., 2004), 78
many other morphological measures can also be examined (e.g., sulcal depth, span, and 79
curvature [Fischl et al., 1999; Pienaar et al., 2008]). Recently we demonstrated that age-related 81
differences in the shape, i.e., structural complexity, of cortical regions were more pronounced 82
than in cortical thickness or gyrification (Madan & Kensinger, 2016). Moreover, we found that 83
complexity statistically accounted for all of the age-related differences associated with cortical 84
thickness and gyrification. Although it is currently unclear what features of brain morphology are 85
captured by this metric of complexity, the results underscore that—at least for cortical regions— 86
complexity is a particularly robust metric for assessing age-associated differences. Of course, 87
explaining the ‘most’ age-related variability is not always desired, as this may leave less 88
remaining variance to account for other sources of inter-individual variability (e.g., cognitive 89
abilities); but the extant research suggests that if the goal is to estimate effects of age on brain 90
morphology, metrics of structural complexity may be of particular utility. 91
Here we sought to extend this research by assessing the extent by which complexity can 92
improve the characterization of age-related differences in brain structure beyond the cortex, by 93
examining subcortical and ventricular structures. A number of studies have demonstrated that the 94
shape of subcortical structures can differ between patients and healthy controls. For instance, 95
autism has been associated with differences in the shape of the amygdala (Chung et al., 2008), 96
Alzheimer’s disease has been related to differences in several structures, particularly the 97
hippocampus, amygdala, and lateral ventricles (Tang et al., 2014), and schizophrenic patients 98
have shown differences in hippocampal and thalamus shape (Zhao et al., 2016; also see Smith et 99
al., 2011, and Qiu et al., 2009). Though these studies provide evidence that shape characteristics 100
can be a relevant measure for subcortical structures, it is possible that these systematic 101
differences only occur in the presence of neurological or psychiatric disorders. Furthermore, 102
increased explained variance may not always be desired, instead, we propose that the use of 103
Here we used fractal dimensionality to measure the structural complexity of the 105
investigated subcortical and ventricular structures. This approach was inspired by the innovative 106
work of Mandelbrot (1967), where fractal geometry principles were applied to quantify the 107
complexity of complex natural structures. While Mandelbrot initially applied fractal 108
dimensionality to geographic data (coast lines), neuroimagers have previously considered the 109
notion of using fractal dimensionality to quantify the complexity of the brain (e.g., Free et al., 110
1996; Kiselev et al., 2003). More broadly, fractal dimensionality have been used in neuroscience 111
from the scale of individual neurons to the whole brain (see Di Ieva et al., 2014, 2015, for a 112
review). 113
Using three large datasets, here we first replicated the age-related differences in volume 114
of subcortical and ventricular structures, then further calculated age-related differences in their 115
structural complexity. The present study addressed two primary questions: (1) are there 116
systematic age-related differences in the shape of subcortical structures, as indexed by structural 117
complexity, using the same approach as in Madan and Kensinger (2016) and (2) how do these 118
differences compare to volumetric age-related differences in these structures. Different structural 119
measures may also serve complimentary roles—where different measures may index distinct 120
population-level characteristics; as such we additionally assessed the collinearity of the measures 121
and the unique variance they can explain with respect to age-related variability. 122
123
2. Procedure 124
2.1. Datasets
125
Three datasets were used to evaluate age-related differences in subcortical and ventricular 126
structure. 127
Sample 1 (OASIS) consisted of 314 healthy adults (196 females), aged 18-94, from the publicly 128
2007; http://www.oasis-brains.org). Participants were recruited from a database of individuals 130
who had (a) previously participated in MRI studies at Washington University, (b) were part of 131
the Washington University Comminity, or (c) were from the longitudinal pool of the Washington 132
University Alzheimer Disease Research Center. Participants were screened for neurological and 133
psychiatric issues; the Mini-Mental State Examination (MMSE) and Clinical Dementia Rating 134
(CDR) were administered to participants aged 60 and older. In the current sample, participants 135
with a CDR above zero were excluded; all remaining participants scored 25 or above on the 136
MMSE. Multiple T1 volumes were acquired using a Siemens Vision 1.5 T with a MPRAGE 137
sequence; only the first volume was used here. Scan parameters were: TR=9.7 ms; TE=4.0 ms; 138
flip angle=10°; voxel size=1.25×1×1 mm. 139
Sample 2 (IXI) consisted of427 healthy adults (260 females), aged 20-86, from the publicly 140
available Information eXtraction from Images (IXI) dataset (
http://brain-development.org/ixi-141
dataset/). This is the same set of individuals we used previously to investigate age-related 142
differences in the cortex (Madan & Kensinger, 2016). These individuals were scanned at one of 143
three hospitals in the London, UK (Guy’s Hospital, Hammersmith Hospital, and Institute of 144
Psychiatry) in 2005-2006. Details on how these individuals were recruited is unavailable, nor are 145
details on how mental health was assessed. See Madan and Kensinger (2016) for further details. 146
Sample 3 (BC) consisted of 176 healthy adults (89 females), aged 18-83, recruited by the 147
Cognitive and Affective Laboratory at Boston College (BC) in 2012-2015. All participants were 148
screened for neurological and psychiatric issues, and to have scored above 26 on the MMSE. T1 149
volumes were acquired using a Siemens Trio 3 T with a MEMPRAGE sequence optimized for 150
morphometry studies (van der Kouwe et al., 2008; Wonderluck et al., 2009). Scan parameters 151
were: TR=2530 ms; TE=1.64, 3.50, 5.36, 7.22 ms; flip angle=7°; voxel size=1×1×1 mm. 152
2.2. Segmentation and volumetric analyses
All structural MRIs were processed using FreeSurfer 5.3.0 on a machine running CentOS 6.6 154
(Fischl, 2012; Fischl & Dale, 2000; Fischl et al., 2002). FreeSurfer’s standard pipeline was used 155
(i.e., recon-all). FreeSurfer’s segmentation procedure produces labels for seven subcortical 156
structures (thalamus, hippocampus, amygdala, caudate, putamen, accumbens, palladium) and 157
four ventricular structures (lateral, inferior lateral, third, fourth) all within a common 158
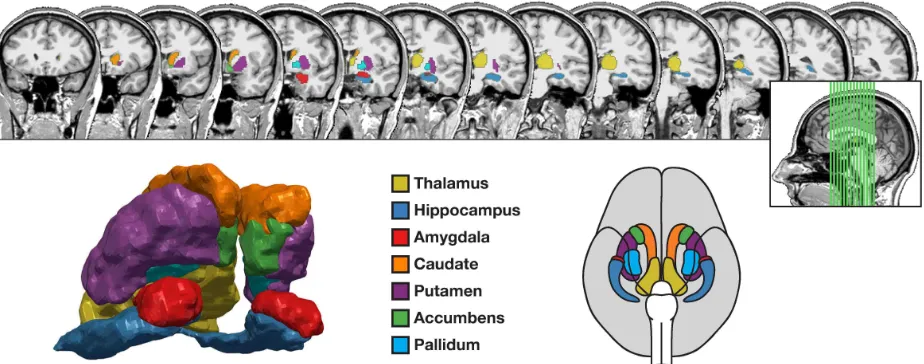
segmentation volume (Fischl et al., 2002, 2004). Figure 1 shows the subcortical structures 159
investigated here. Volumes for subcortical and ventricular structures were obtained directly from 160
FreeSurfer. 161
Validation studies have shown that this automated segmentation procedure corresponds 162
well with manual tracing (e.g., Fischl et al., 2002; Jovicich et al., 2009; Keller et al., 2012; 163
Lehmann et al., 2010; Mulder et al., 2014; Pardoe et al., 2009; Tae et al., 2008; Wenger et al., 164
2014). FreeSurfer has been used in a large number of studies investigating age-differences in 165
subcortical structures (e.g., Inano et al., 2013; Jovicich et al., 2009; Long et al., 2012; Potvin et 166
al., 2016; Tamnes et al., 2013; Walhovd et al., 2005, 2011; Wenger et al., 2014; Yang et al., 167
2016). 168
Intracranial volume (ICV) was also estimated using FreeSurfer (Buckner et al., 2004), 169
which has also been shown to correspond well with manual tracing (Sargolzaei et al., 2015). 170
171
172
174
Figure 1. Coronal slices, 3D reconstruction, and 2D illustration of the seven subcortical 175
structures examined. Coronal slices, with anterior slices on the left, are shown at 5-mm spacing 176
from a representative participant; positions of the displayed coronal slices are marked on the 177
inset sagittal slice. The 3D reconstruction is based on the same participant’s MRI as the coronal 178
slices (following from Madan, 2015). The 2D illustration was adapted from Toro et al. (2014). 179
180
2.3 Fractal dimensionality analyses
181
The complexity of each structure was calculated using the calcFD toolbox (Madan & Kensinger, 182
2016; http://cmadan.github.io/calcFD/). This toolbox calculates the ‘fractal dimensionality’ of a 183
3D structure, and is specifically designed to use intermediate files from the standard FreeSurfer 184
analysis pipeline, here aparc.a2009s+aseg.mgz. The toolbox has previously been used with 185
parcellated cortical structure, as well as validated using several benchmark volumes (Madan & 186
Kensinger, 2016). 187
We use fractal dimensionality as a measure of the complexity of a 3D structure, i.e., a 188
subcortical structure. Unlike volume, which corresponds to the ‘size’ of any 3D structure, fractal 189
dimensionality measures shape information and is scale invariant (Madan & Kensinger, 2016). 190
In fractal geometry, several approaches have been proposed to quantify the ‘dimensionality’ or 191
complexity of a fractal; the approach here calculates the Minkowski–Bouligand or Hausdorff 192
dimension (see Mandelbrot, 1967). This structural property can be measured by considering the 193
the structure, referred to as the ‘box-counting algorithm’ (Caserta et al., 1995; Mandelbrot, 195
1982). By then using another grid size (i.e., changing the box width), the relationship between 196
the grid size and number of counted boxes can be determined. Here we used box sizes (in mm) 197
corresponding to powers of 2, ranging from 0 to 4 (i.e., 2k [k = 0, 1, 2, 3, 4] = 1, 2, 4, 8, 16 mm).
198
The slope of this relationship in log-log space is the fractal dimensionality of the structure. Thus, 199
the corresponding equation is: 200
201
There are two distinct fractal dimensionality values that can be calculated: If only the boxes 202
overlapping with the edge/surface of the structure are counted, this slope represents the fractal 203
dimensionality of the surface, denoted as FDs. If the boxes within the structure are also counted, 204
the resulting slope represents the fractal dimensionality of the filled volume, denoted as FDf. 205
As the relative alignment of the grid space and the structure can influence the obtained 206
fractal dimensionality value using the box-counting algorithm, we instead used a dilation 207
algorithm that is equivalent to using a sliding grid space and calculating the fractal 208
dimensionality at each alignment (Madan & Kensinger, 2016), but can be calculated much faster 209
as it is less computationally demanding. This was implemented using a 3D-convolution 210
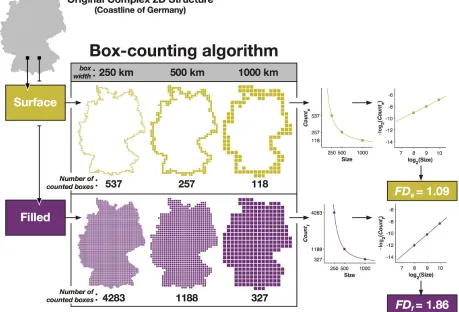
operation (convn in MATLAB). As an example, Figure 2 illustrates the calculation of fractal 211
dimensionality for a complex 2D structure. 212
214
Figure 2. Illustration of how fractal dimensionality is measured from a 2D structure. 215
Reprinted from Madan and Kensinger (2016) with permission. Copyright 2016, Elsevier. 216
217
2.4. Data Analysis
218
All volume measurements were ICV-corrected prior to conducting the regression analyses. 219
Specifically, ICV-corrected volumes were calculated as the residual after the volume data was 220
regressed for ICV (as in Walhovd et al., 2011). Formal comparisons of procedures used to adjust 221
for ICV suggest that results generalize across differing procedures (Greenberg et al., 2008). 222
Age differences in the subcortical and ventricular structures was first assessed using 223
regression models examining the linear and quadratic relationships between age and volume (or 224
fractal dimensionality) of the structure, with the amount of variance explained (i.e., R2) as the 225
statistic. All of the regression models reported controlled for effects of sex (and site, in the case 226
To directly assess if fractal dimensionality explained more age-related variability than 228
volume, we formally compared model fits based on either measure, for each structure, using the 229
Bayesian Information Criterion (BIC). This approach allows us to compare different regression 230
models and determine which model fits the data best, or if models perform comparably. 231
Additionally, models with more parameters are penalized for these additional degrees of 232
freedom. As a rule of thumb, if the difference in BIC between two models is less than two, 233
neither of the models’ fit to the data is significantly better (Burnham & Anderson, 2002, 2004). 234
As absolute BIC values are arbitrary, we subtract the BIC value for the best model considered 235
from all BIC values and report ΔBIC for each of the models, as is common practice. As a result, 236
the best model considered is ΔBIC=0.00 by definition. 237
238
3. Results 239
3.1. Age-related differences in subcortical structures
240
We used the OASIS dataset as our primary sample because Walhovd et al. (2011) previously 241
examined age-related differences in volumetric measures in this sample (Samples 4a and 4b in 242
their analyses). As such, the volumetric analyses here were intended to serve as a replication of 243
their findings. 244
The subcortical structures investigated here were the thalamus, hippocampus, amygdala, 245
caudate, putamen, accumbens, and pallidum; a representative reconstruction of the structures 246
from a participant’s MRI is shown in Figure 1. As shown in Table 1, linear and quadratic 247
relationships between age and volumes of subcortical structures closely matched the amount of 248
variance explained (i.e., R2) reported by Walhovd et al. for the same sample. Briefly, age-related 249
differences were most pronounced in the thalamus, putamen, accumbens, and pallidum—each 250
in the volume of the hippocampus and amygdala, whereas caudate volume was the least related 252
to age-related differences. The upper half of Figure 4 shows the quadratic fits for each structure. 253
We calculated the fractal dimensionality, both FDs and FDf, of the structures for each 254
individual to additionally measure age-related differences in their structural complexity. Fractal 255
dimensionality of the surface (FDs) captured more variability than volume for some of the 256
structures; for instance, 64% for the thalamus and 66% for the accumbens. There was a smaller 257
increase in variability explained by FDs relative to volume in the amygdala (31%) and there was 258
effectively no additional age-related differences explained in the caudate (16%). However, less 259
variability was explained by FDs than by volume in other structures, such as the hippocampus 260
(20%), putamen (31%), and pallidum (36%). Importantly, FDs captures shape-related, but not 261
volumetric, characteristics of the surface structure. In contrast, FDf, while scale invariant, is 262
influenced by a combination of shape- and volumetric-related characteristics of the structure. 263
Age-related differences in FDf were larger than those for volume across all seven subcortical 264
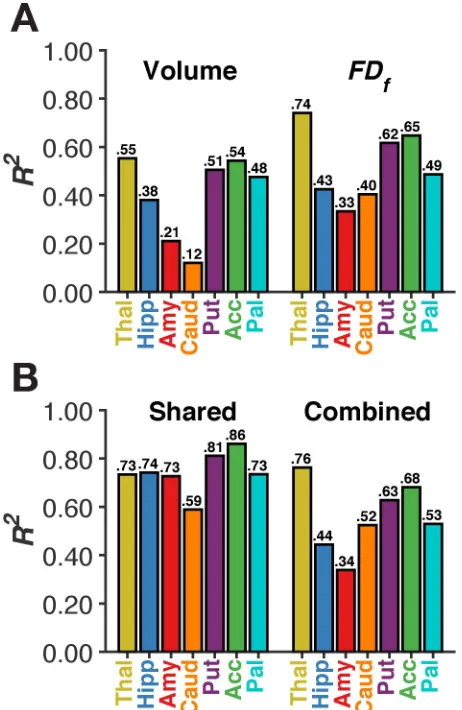
structures, as shown in Table 1 and Figure 3A; differences were also larger than for FDs for all 265
but one structure, though that comparison was only nominally smaller [accumbens, quadratic R2: 266
FDs = 66%; FDf = 65%]. Relative to volume, the amount of variability explained in FDf was 267
much higher for the thalamus and caudate (74% and 40% variance explained with the quadratic 268
model, respectively; versus 55% and 12% with volume, respectively). More moderate increases 269
(of approximately 10% more variance explained) were found for the amygdala, putamen, and 270
accumbens. The lower half of Figure 4 shows the quadratic fits for the structures; relationships 271
are generally consistent as those with volume, though generally there is less unexplained 272
variability (i.e., the residual). 273
Figure 3B illustrates that volume and structural complexity are highly collinear. Volume 274
and structural complexity were the most distinct for the caudate, with 59% shared variance. 275
volume and structural complexity within the same model marginally increased the total amount 277
of variance explained (Figure 3B) relative to the FDf models, with increases ranging from 1-4% 278
for six of the structures. However, the inclusion of volume led to a 12% additional variance 279
explained for the caudate, suggesting that age-related differences in volume and complexity were 280
distinct for this region. 281
The two fractal dimensionality measures were slightly more collinear, with shared 282
variances of: thalamus (77%), hippocampus (71%), amygdala (85%), caudate (76%), putamen 283
(63%), accumbens (99%), and pallidum (72%). In almost all cases, the combined variance 284
explained by the two fractal dimensionality measures was increased by less than 5% relative to 285
the FDf-only regression model; the only exception to this was the caudate, where the combined 286
model explained 56% of age-related variability. 287
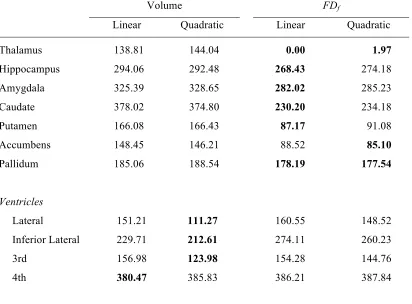
Formal model comparisons are reported in Table 2. In contrast to the analyses presented 288
in Figures 3-4 and Table 1, where the structural measures were used as the dependant variable 289
(DV), here we used age as the DV such that we could compare how well the various structural 290
measures were able to explain variability in this common DV. Here we found that fractal 291
dimensionality explained more age-related variability than volume for all of the subcortical 292
structures. 293
294
296
Figure 3. Amount of variance explained (R2) by quadratic modelsof age in volume and 297
structural complexity for each subcortical structure (Panel A). Panel B shows the amount 298
of variance common to both volume and complexity (i.e., collinearity), as well as combined 299
variance explained by including both volume and complexity. 300
301 302
303
Figure 4. Scatter plots of age-related differences in volume and structural complexity for 304
each subcortical structure along with best-fitting quadratic models. 305
[image:14.612.72.542.536.668.2]307
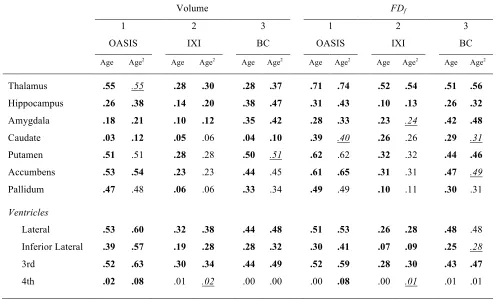
Volume FDf
1 2 3 1 2 3
OASIS IXI BC OASIS IXI BC
Age Age2 Age Age2 Age Age2 Age Age2 Age Age2 Age Age2
Thalamus .55 .55 .28 .30 .28 .37 .71 .74 .52 .54 .51 .56
Hippocampus .26 .38 .14 .20 .38 .47 .31 .43 .10 .13 .26 .32
Amygdala .18 .21 .10 .12 .35 .42 .28 .33 .23 .24 .42 .48
Caudate .03 .12 .05 .06 .04 .10 .39 .40 .26 .26 .29 .31
Putamen .51 .51 .28 .28 .50 .51 .62 .62 .32 .32 .44 .46
Accumbens .53 .54 .23 .23 .44 .45 .61 .65 .31 .31 .47 .49
Pallidum .47 .48 .06 .06 .33 .34 .49 .49 .10 .11 .30 .31
Ventricles
Lateral .53 .60 .32 .38 .44 .48 .51 .53 .26 .28 .48 .48
Inferior Lateral .39 .57 .19 .28 .28 .32 .30 .41 .07 .09 .25 .28
3rd .52 .63 .30 .34 .44 .49 .52 .59 .28 .30 .43 .47
[image:15.612.55.551.87.388.2]4th .02 .08 .01 .02 .00 .00 .00 .08 .00 .01 .01 .01
Table 1.Effects of age on volume and fractal dimensionality for the structures examined. 308
Volume measures were ICV-corrected; effects of site were regressed out for the IXI sample. 309
Values in the Age2 columns indicate amount of explained variance (R2) for the model consisting 310
of Age+Age2 and are printed in bold/italic+underline only if the addition of the quadratic term 311
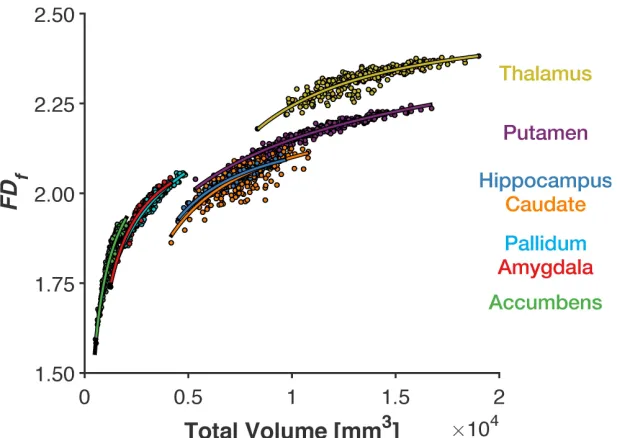
3.2. Limitations to scale invariance of fractal dimensionality
313
While fractal dimensionality is mathematically scale invariant, constraints of MRI data 314
acquisition may introduce a lower limit to this theoretical property. Specifically, smaller 315
structures are inherently more ‘rectangular’ due to voxel resolution constraints and thus will have 316
lower structural complexity as a result. A lower limit on the scale invariance of fractal 317
dimensionality would appear as a steep relationship with volume, indicating that the resolution of 318
the 3D structure’s shape was insufficient to yield additional contributions from shape-related 319
properties. 320
Here we examined the relationship between total volume (without ICV-correction) and 321
FDf and found some evidence of a limitation in scale invariance (Figure 5). Specifically, smaller 322
subcortical structures (e.g., accumbens, pallidum) had steeper relationships between volume and 323
FDf and less ‘off-axis’ variability than larger structures (e.g., thalamus, caudate). This indicates 324
that (1) FDf for smaller structures was influenced more by volumetric characteristics than in the 325
larger structures, and (2) FDf for smaller structures was more correlated with volume, while FDf
326
for larger structures additionally indexed other sources of variability (i.e., shape-related 327
characteristics). This increase in off-axis variability was not true of all larger structures, 328
specifically the putamen, though this could be related to biological constraints in the variability 329
in shape of the structure. 330
These results indicate that future applications of structural complexity will be limited for 331
structures that are inherently small (e.g., hippocampal subfields), though this limitation can be 332
attenuated by acquiring MRI data with higher-resolution imaging protocols (i.e., decreasing the 333
voxel size during acquisition). As noted in the Methods section, the MRI data in the datasets 334
analyzed here were acquired with a voxel size of 1 mm3-isotropic or slightly larger. However, 335
images with voxel dimensions on the scale of 0.5 mm in-plane (e.g., Hrybouski et al., 2016; La 337
Joie et al., 2010; Palombo et al., 2013; Reagh & Yassa, 2014; Yushkevich et al. 2015). 338
339
[image:17.612.153.464.151.370.2]340
Figure 5. Scatter plot of total volume and structural complexity along with best-fitting 341
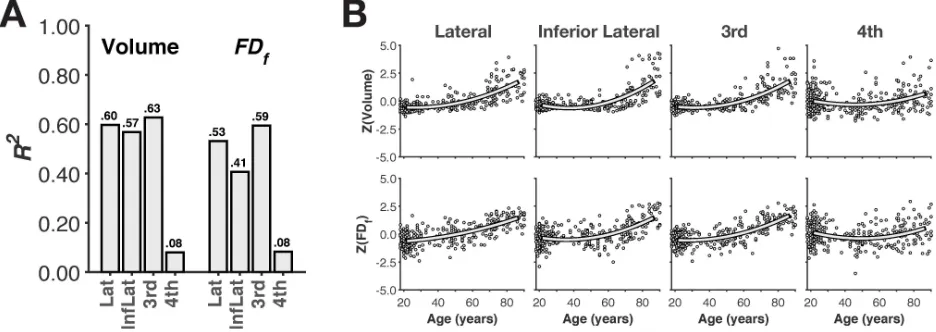
3.3. Age-related differences in the ventricles
343
We also examined age-related differences in the volume and structural complexity of the 344
ventricles, as shown in Figure 6. The amount of variability in volume explained by age-related 345
differences was consistent with Walhovd et al. (2011). Interestingly, variability in the fractal 346
dimensionality (FDf) of the structures was more weakly associated with age-related differences 347
than volume, unlike the subcortical structures (see Table 1). When formally compared (see 348
below), volume explained more age-related variability than fractal dimensionality for all of the 349
ventricular structures (Table 2). 350
351
352
[image:18.612.73.541.347.513.2]353
Figure 6. Age-related differences in volume and structural complexity of ventricular 354
structures. (A) Bar plot of amount of variance explained (R2) by quadratic models of age. (B) 355
357
Volume FDf
Linear Quadratic Linear Quadratic
Thalamus 138.81 144.04 0.00 1.97
Hippocampus 294.06 292.48 268.43 274.18
Amygdala 325.39 328.65 282.02 285.23
Caudate 378.02 374.80 230.20 234.18
Putamen 166.08 166.43 87.17 91.08
Accumbens 148.45 146.21 88.52 85.10
Pallidum 185.06 188.54 178.19 177.54
Ventricles
Lateral 151.21 111.27 160.55 148.52
Inferior Lateral 229.71 212.61 274.11 260.23
3rd 156.98 123.98 154.28 144.76
4th 380.47 385.83 386.21 387.84
[image:19.612.93.505.101.405.2]
Table 2.Model fitness in comparing the effects of volume and fractal dimensionality in 358
explaining age, for each of the structures examined, based on the OASIS dataset. Values in 359
the Quadratic columns indicate model fitness (ΔBIC) for the regression model consisting of both 360
linear and quadratic terms. Models with BIC values with a difference greater than two suggest 361
that the model with the lower BIC value is a significantly better fit than the other models. Best 362
fitting models for each structure are denoted in bold. 363
3.4. Replication in independent samples
365
To assess the reproducibility of our findings of age-related differences in the structural 366
complexity of the subcortical and ventricular structures, we conducted similar analyses in two 367
additional samples. 368
In the IXI sample, we generally found less age-related differences in both volume and 369
fractal dimensionality; however, the volumetric differences observed here were within the inter-370
sample variability observed in Walhovd et al. (2011). Importantly, the same regions were found 371
to show the strongest age-related differences in volume (e.g., thalamus, putamen, lateral 372
ventricles; though not the pallidum). Fractal dimensionality (FDf) was again more closely related 373
to age-related differences. Results in the BC sample were consistent with those observed in the 374
OASIS and IXI samples, and magnitudes of explained variance on age-related differences in 375
volume and fractal dimensionality were generally in-between those observed in each of the other 376
datasets. 377
378
4. Discussion 379
When examining age-related differences in brain structure, it is important to consider the most 380
appropriate measure. With cortical structure, it has been established that age-related differences 381
are reflected most in cortical thickness, rather than surface area or volume (Hogstrom et al., 382
2013; Fjell et al., 2009; McKay et al., 2014; Salat et al., 2004); however, we recently 383
demonstrated that structural complexity of the cortex is more sensitive to age-related differences 384
than thickness (Madan & Kensinger, 2016). In the present study, we found systematic age-385
related differences in the structural complexity of subcortical regions that was not captured by 386
volumetric measures. Additionally, we found that structural complexity was not more closely 387
related to age-related differences across all brain structures: this measure showed a weaker 388
considering the shape of subcortical structures provides additional information about age-related 390
atrophy beyond ICV-corrected volume, but only when the ‘contents’ of the structure are 391
themselves meaningful—i.e., neural tissue, rather than CSF. 392
Evidence of age-related differences in fractal dimensionality in subcortical structures (as 393
well as cortical structures; Madan & Kensinger, 2016) demonstrates that current approaches of 394
measuring age-related differences in volume (and cortical thickness) only partially characterize 395
how the structural properties of the brain relate to age. While the neurobiological basis (i.e., 396
cellular through systems level) of these differences is unclear, these differences are demonstrably 397
evident at the macro-level of brain structures that is measured using structural MRIs. Further 398
research is needed to establish how these shape-related differences manifest in more precise 399
measures of neural structure (e.g., differences in neuronal composition or density). Indeed, the 400
use of fractal dimensionality to measure complexity at the micro- and meso-level structures 401
within neuroscience has already been established (Di Ieva et al., 2014, 2015) and may prove 402
useful in examining age-related differences within these subcortical structures, such as in the 403
composition of neurons. Nonetheless, the present results provide evidence of an additional metric 404
for evaluating inter-individual differences in physiological brain age. 405
Prior work in young and older adults has demonstrated that fractal dimensionality can 406
index inter-individual differences in brain morphology that relate to cognition and differs 407
between healthy adults and patient populations. While the current work applies fractal 408
dimensionality analyses to subcortical structures, others have used fractal dimensionality to 409
characterize the structural complexity of segmented grey or white matter structure (e.g., King et 410
al., 2009; Madan & Kensinger, 2016; Mustafa et al., 2012; Sandu et al., 2008). Using these 411
approaches, fractal dimensionality has been related to inter-individual differences in measures of 412
fluid intelligence (Mustafa et al., 2012; Sandu et al., 2014), IQ (Im et al., 2006), and performance 413
Fractal dimensionality has also been shown to differ between healthy adults and a number of 415
patient populations, particularly in Alzheimer’s disease (King et al., 2009, 2010; Thompson et 416
al., 1998) and schizophrenia (Ha et al., 2005; Narr et al., 2004; Nenadic et al., 2014; Sandu et al., 417
2008; Yotter et al., 2011; Zhao et al., 2016). Thus, while we have demonstrated the benefits of 418
using fractal dimensionality to index age-related differences in subcortical structure, as well as 419
cortical structure (Madan & Kensinger, 2016), the variability of this morphological measure also 420
is related to inter-individual differences in cognitive measures and may hold promise as a 421
biomarker for some neurological disorders. However, it is important to consider that more inter-422
individual variability explained by age may not always be desired, as this leaves less variance 423
available to be related to other factors, e.g., performance on cognitive measures, so volume may 424
still be a preferable measure depending on the research question. As such, we advocate for the 425
use of multiple brain morphology measures when examining inter-individual differences. 426
Though we measured structural complexity here using fractal dimensionality, this is not 427
the only approach to quantify these shape-related properties; other related approaches such as 428
spherical harmonics (Chung et al., 2008, 2010; Yotter et al., 2011) and Laplace-Beltrami spectra 429
(Reuter et al., 2006; Wachinger et al., 2015) may similarly be able to capture these structural 430
differences. Seo and Chung (2011) demonstrated that Laplace-Beltrami eigenfunctions can yield 431
better fits to the original structure than spherical harmonics, when reconstructing cortical and 432
subcortical surfaces. This difference was attributed to Laplace-Beltrami spectra not necessitating 433
spherical parameterization. As of yet, no comparison has been done between Laplace-Beltrami 434
spectra and the current approach of using fractal dimensionality. 435
In summary, the present results reveal that metrics of fractal dimensionality can capture 436
age-associated variance within subcortical structures that is missed when using only volumetric 437
measures. This result represents an important extension of prior research examining cortical 438
with age even in relatively small, subcortical structures. Moreover, these results emphasize the 440
benefits of including metrics of fractal dimensionality in assessments of structural differences 441
References 443
Allen, J. S., Bruss, J., Brown, C. K., & Damasio, H. (2005). Normal neuroanatomical variation 444
due to age: The major lobes and a parcellation of the temporal region. Neurobiology of
445
Aging, 26, 1245–1260. doi:10.1016/j.neurobiolaging.2005.05.023 446
Apostolova, L. G., Green, A. E., Babakchanian, S., Hwang, K. S., Chou, Y.-Y., Toga, A. W., & 447
Thompson, P. M. (2012). Hippocampal Atrophy and Ventricular Enlargement in Normal 448
Aging, Mild Cognitive Impairment (MCI), and Alzheimer Disease. Alzheimer Disease &
449
Associated Disorders, 26, 17–27. doi:10.1097/wad.0b013e3182163b62 450
Barron, S. A., Jacobs, L., & Kinkel, W. R. (1976). Changes in size of normal lateral ventricles 451
during aging determined by computerized tomography. Neurology, 26, 1011–1011. 452
doi:10.1212/wnl.26.11.1011 453
Buckner, R. L., Head, D., Parker, J., Fotenos, A. F., Marcus, D., Morris, J. C., & Snyder, A. Z. 454
(2004). A unified approach for morphometric and functional data analysis in young, old, 455
and demented adults using automated atlas-based head size normalization: Reliability and 456
validation against manual measurement of total intracranial volume. NeuroImage, 23, 724– 457
738. doi:10.1016/j.neuroimage.2004.06.018 458
Burnham, K. E., & Anderson, D. R. (2002). Model selection and multimodel inference (2nd ed.).
459
New York: Springer-Verlag. 460
Burnham, K. P., & Anderson, D. R. (2004). Multimodel inference: Understanding AIC and BIC 461
in model selection. Sociological Methods & Research, 33, 261–304. 462
doi:10.1177/0049124104268644 463
Caserta, F., Eldred, W. D., Fernandez, E., Hausman, R. E., Stanford, L. R., Bulderev, S. V., … 464
Stanley, H. E. (1995). Determination of fractal dimension of physiologically characterized 465
neurons in two and three dimensions. Journal of Neuroscience Methods, 56, 133–144. 466
doi:10.1016/0165-0270(94)00115-w 467
Chung, M. K., Nacewicz, B. M., Wang, S., Dalton, K. M., Pollak, S., & Davidson, R. J. (2008). 468
Amygdala surface modeling with weighted spherical harmonics. Lecture Notes in
469
Computer Science, 5128, 177–184. doi:10.1007/978-3-540-79982-5_20 470
Chung, M. K., Worsley, K. J., Nacewicz, B. M., Dalton, K. M., & Davidson, R. J. (2010). 471
General multivariate linear modeling of surface shapes using SurfStat. NeuroImage, 53, 472
491–505. doi:10.1016/j.neuroimage.2010.06.032 473
Creasey, H., & Rapoport, S. I. (1985). The aging human brain. Annals of Neurology, 17, 2–10. 474
doi:10.1002/ana.410170103 475
Di Ieva, A., Esteban, F. J., Grizzi, F., Klonowski, W., & Martin-Landrove, M. (2015). Fractals in 476
the neurosciences, Part II: Clinical applications and future perspectives. The
477
Neuroscientist, 21, 30–43. doi:10.1177/1073858413513928 478
Di Ieva, A., Grizzi, F., Jelinek, H., Pellionisz, A. J., & Losa, G. A. (2014). Fractals in the 479
neurosciences, Part I: General principles and basic neurosciences. The Neuroscientist, 20, 480
403–417. doi:10.1177/1073858413513927 481
Drayer, B. P. (1988). Imaging of the aging brain. Part I. Normal findings. Radiology, 166, 785– 482
Fischl, B., Salat, D. H., Busa, E., Albert, M., Dieterich, M., Haselgrove, C., … Dale, A. M. 484
(2002). Whole brain segmentation: Automated labelling of neuroanatomical structures in 485
the human brain. Neuron, 33, 341–355. doi:10.1016/s0896-6273(02)00569-x 486
Fischl, B., Sereno, M. I., & Dale, A. M. (1999). Cortical Surface-Based Analysis. NeuroImage,
487
9, 195–207. doi:10.1006/nimg.1998.0396 488
Fjell, A. M., Westlye, L. T., Amlien, I., Espeseth, T., Reinvang, I., Raz, N., … Walhovd, K. B. 489
(2009). High consistency of regional cortical thinning in aging across multiple samples. 490
Cerebral Cortex, 19, 2001–2012. doi:10.1093/cercor/bhn232 491
Free, S. L., Sisodiya, S. M., Cook, M. J., Fish, D. R., & Shorvon, S. D. (1996). Three-492
dimensional fractal analysis of the white matter surface from magnetic resonance images 493
of the human brain. Cerebral Cortex, 6, 830–836. doi:10.1093/cercor/6.6.830 494
Goodro, M., Sameti, M., Patenaude, B., & Fein, G. (2012). Age effect on subcortical structures 495
in healthy adults. Psychiatry Research: Neuroimaging, 203, 38–45. 496
doi:10.1016/j.pscychresns.2011.09.014 497
Greenberg, D. L., Messer, D. F., Payne, M. E., MacFall, J. R., Provenzale, J. M., Steffens, D. C., 498
& Krishnan, R. R. (2008). Aging, gender, and the elderly adult brain: An examination of 499
analytical strategies. Neurobiology of Aging, 29, 290–302. 500
doi:10.1016/j.neurobiolaging.2006.09.016 501
Gunning-Dixon, F. M., Head, D., McQuain, J., Acker, J. D., & Raz, N. (1998). Differential aging 502
of the human striatum: A prospective MR imaging study. American Journal of
503
Neuroradiology, 19, 1501-1507. 504
Ha, T. H., Yoon, U., Lee, K. J., Shin, Y. W., Lee, J.-M., Kim, I. Y., … Kwon, J. S. (2005). 505
Fractal dimension of cerebral cortical surface in schizophrenia and obsessive–compulsive 506
disorder. Neuroscience Letters, 384, 172–176. doi:10.1016/j.neulet.2005.04.078 507
Hogstrom, L. J., Westlye, L. T., Walhovd, K. B., & Fjell, A. M. (2013). The structure of the 508
cerebral cortex across adult life: Age-related patterns of surface area, thickness, and 509
gyrification. Cerebral Cortex, 23, 2521–2530. doi:10.1093/cercor/bhs231 510
Hrybouski, S., Aghamohammadi-Sereshki, A., Madan, C. R., Shafer, A. T., Baron, C. A., Seres, 511
P., … Malykhin, N. V. (2016). Amygdala subnuclei response and connectivity during 512
emotional processing. NeuroImage, 133, 98–110. doi:10.1016/j.neuroimage.2016.02.056 513
Im, K., Lee, J.-M., Yoon, U., Shin, Y.-W., Hong, S. B., Kim, I. Y., … Kim, S. I. (2006). Fractal 514
dimension in human cortical surface: Multiple regression analysis with cortical thickness, 515
sulcal depth, and folding area. Human Brain Mapping, 27, 994–1003. 516
doi:10.1002/hbm.20238 517
Inano, S., Takao, H., Hayashi, N., Yoshioka, N., Mori, H., Kunimatsu, A., … Ohtomo, K. 518
(2012). Effects of age and gender on neuroanatomical volumes. Journal of Magnetic
519
Resonance Imaging, 37, 1072–1076. doi:10.1002/jmri.23910 520
Jernigan, T. L., Archibald, S. L., Fennema-Notestine, C., Gamst, A. C., Stout, J. C., Bonner, J., 521
& Hesselink, J. R. (2001). Effects of age on tissues and regions of the cerebrum and 522
Kaye, J. A., DeCarli, C., Luxenberg, J. S., & Rapoport, S. I. (1992). The significance of age-524
related enlargement of the cerebral ventricles in healthy men and women measured by 525
quantitative computed X-ray tomography. Journal of the American Geriatrics Society, 40, 526
225–231. doi:10.1111/j.1532-5415.1992.tb02073.x 527
Keller, S. S., Gerdes, J. S., Mohammadi, S., Kellinghaus, C., Kugel, H., Deppe, K., … Deppe, 528
M. (2012). Volume estimation of the thalamus using FreeSurfer and stereology: 529
Consistency between methods. Neuroinformatics, 10, 341–350. doi:10.1007/s12021-012-530
9147-0 531
Kemper T. L. (1994) Neuroanatomical and neuropathological changes during aging and 532
dementia (pp. 3–67). In: Clinical neurology of aging, 2nd ed. (Eds. M. L. Albert, J. E. 533
Knoefel). New York: Oxford University Press. 534
King, R. D., Brown, B., Hwang, M., Jeon, T., & George, A. T. (2010). Fractal dimension 535
analysis of the cortical ribbon in mild Alzheimer’s disease. NeuroImage, 53, 471–479. 536
doi:10.1016/j.neuroimage.2010.06.050 537
King, R. D., George, A. T., Jeon, T., Hynan, L. S., Youn, T. S., Kennedy, D. N., & Dickerson, B. 538
(2009). Characterization of atrophic changes in the cerebral cortex using fractal 539
dimensional analysis. Brain Imaging and Behavior, 3, 154–166. doi:10.1007/s11682-008-540
9057-9 541
Kiselev, V. G., Hahn, K. R., & Auer, D. P. (2003). Is the brain cortex a fractal? NeuroImage, 20, 542
1765–1774. doi:10.1016/s1053-8119(03)00380-x 543
La Joie, R., Fouquet, M., Mézenge, F., Landeau, B., Villain, N., Mevel, K., … Chételat, G. 544
(2010). Differential effect of age on hippocampal subfields assessed using a new high-545
resolution 3T MR sequence. NeuroImage, 53, 506–514. 546
doi:10.1016/j.neuroimage.2010.06.024 547
Lehmann, M., Douiri, A., Kim, L. G., Modat, M., Chan, D., Ourselin, S., … Fox, N. C. (2010). 548
Atrophy patterns in Alzheimer’s disease and semantic dementia: A comparison of 549
FreeSurfer and manual volumetric measurements. NeuroImage, 49, 2264–2274. 550
doi:10.1016/j.neuroimage.2009.10.056 551
LeMay, M. (1984). Radiologic changes of the aging brain and skull. American Journal of
552
Roentgenology, 143, 383–389. doi:10.2214/ajr.143.2.383 553
Long, X., Liao, W., Jiang, C., Liang, D., Qiu, B., & Zhang, L. (2012). Healthy aging. Academic
554
Radiology, 19, 785–793. doi:10.1016/j.acra.2012.03.006 555
Madan, C. R. (2015). Creating 3D visualizations of MRI data: A brief guide. F1000Research, 4, 556
466. doi:10.12688/f1000research.6838.1 557
Madan, C. R., & Kensinger, E. A. (2016). Cortical complexity as a measure of age-related brain 558
atrophy. NeuroImage. doi: 10.1016/j.neuroimage.2016.04.029 559
Mandelbrot, B. B. (1967). How long is the coast of Britain? Statistical self-similarity and 560
fractional dimension. Science, 156, 636–638. doi:10.1126/science.156.3775.636 561
Mandelbrot, B. B. (1982). The Fractal Geometry of Nature. San Francisco: W.H. Freeman. 562
Marcus, D. S., Wang, T. H., Parker, J., Csernansky, J. G., Morris, J. C., & Buckner, R. L. (2007). 563
middle aged, nondemented, and demented older adults. Journal of Cognitive Neuroscience,
565
19, 1498–1507. doi:10.1162/jocn.2007.19.9.1498 566
McKay, D. R., Knowles, E. E. M., Winkler, A. A. M., Sprooten, E., Kochunov, P., Olvera, R. L., 567
… Glahn, D. C. (2014). Influence of age, sex and genetic factors on the human brain. 568
Brain Imaging and Behavior, 8, 143–152. doi:10.1007/s11682-013-9277-5 569
Mulder, E. R., de Jong, R. A., Knol, D. L., van Schijndel, R. A., Cover, K. S., Visser, P. J., … 570
Vrenken, H. (2014). Hippocampal volume change measurement: Quantitative assessment 571
of the reproducibility of expert manual outlining and the automated methods FreeSurfer 572
and FIRST. NeuroImage, 92, 169–181. doi:10.1016/j.neuroimage.2014.01.058 573
Mustafa, N., Ahearn, T. S., Waiter, G. D., Murray, A. D., Whalley, L. J., & Staff, R. T. (2012). 574
Brain structural complexity and life course cognitive change. NeuroImage, 61, 694–701. 575
doi:10.1016/j.neuroimage.2012.03.088 576
Narr, K. L., Bilder, R. M., Kim, S., Thompson, P. M., Szeszko, P., Robinson, D., … Toga, A. W. 577
(2004). Abnormal gyral complexity in first-episode schizophrenia. Biological Psychiatry,
578
55, 859–867. doi:10.1016/j.biopsych.2003.12.027 579
Nenadic, I., Yotter, R. A., Sauer, H., & Gaser, C. (2014). Cortical surface complexity in frontal 580
and temporal areas varies across subgroups of schizophrenia. Human Brain Mapping, 35, 581
1691–1699. doi:10.1002/hbm.22283 582
Palombo, D. J., Amaral, R. S. C., Olsen, R. K., Muller, D. J., Todd, R. M., Anderson, A. K., & 583
Levine, B. (2013). KIBRA polymorphism is associated with individual differences in 584
Hippocampal subregions: Evidence from anatomical segmentation using high-resolution 585
MRI. Journal of Neuroscience, 33, 13088–13093. doi:10.1523/jneurosci.1406-13.2013 586
Pardoe, H. R., Kucharsky Hiess, R., & Kuzniecky, R. (2016). Motion and morphometry in 587
clinical and nonclinical populations. NeuroImage, 135, 177–185. 588
doi:10.1016/j.neuroimage.2016.05.005 589
Pienaar, R., Fischl, B., Caviness, V., Makris, N., & Grant, P. E. (2008). A methodology for 590
analyzing Curvature in the developing brain from preterm to adult. International Journal of
591
Imaging Systems and Technology, 18, 42–68. doi:10.1002/ima.20138 592
Potvin, O., Mouiha, A., Dieumegarde, L., & Duchesne, S. (2016). Normative data for subcortical 593
regional volumes over the lifetime of the adult human brain. NeuroImage, 137, 9–20. 594
doi:10.1016/j.neuroimage.2016.05.016 595
Qiu, A., Zhong, J., Graham, S., Chia, M. Y., & Sim, K. (2009). Combined analyses of thalamic 596
volume, shape and white matter integrity in first-episode schizophrenia. NeuroImage, 47, 597
1163–1171. doi:10.1016/j.neuroimage.2009.04.027 598
Raz, N., & Rodrigue, K. M. (2006). Differential aging of the brain: Patterns, cognitive correlates 599
and modifiers. Neuroscience & Biobehavioral Reviews, 30, 730–748. 600
doi:10.1016/j.neubiorev.2006.07.001 601
Raz, N., Lindenberger, U., Rodrigue, K. M., Kennedy, K. M., Head, D., Williamson, A., Dahle, 602
C., Gerstorf, D., & Acker, J. D (2005). Regional brain changes in aging healthy adults: 603
General trends, individual differences and modifiers. Cerebral Cortex, 15, 1676–1689. 604
Raz, N., Rodrigue, K. M., Head, D., Kennedy, K. M., & Acker, J. D. (2004). Differential aging 606
of the medial temporal lobe: A study of a five-year change. Neurology, 62, 433–438. 607
doi:10.1212/01.wnl.0000106466.09835.46 608
Reagh, Z. M., & Yassa, M. A. (2014). Object and spatial mnemonic interference differentially 609
engage lateral and medial entorhinal cortex in humans. Proceedings of the National
610
Academy of Science USA, 111, E4264–E4273. doi:10.1073/pnas.1411250111 611
Reuter, M., Wolter, F.-E., & Peinecke, N. (2006). Laplace–Beltrami spectra as “Shape-DNA” of 612
surfaces and solids. Computer-Aided Design, 38, 342–366. doi:10.1016/j.cad.2005.10.011 613
Salat, D. H., Buckner, R. L., Snyder, A. Z., Greve, D. N., Desikan, R. S. R., … Fischl, B. (2004). 614
Thinning of the cerebral cortex in aging. Cerebral Cortex, 14, 721–730. 615
doi:10.1093/cercor/bhh032 616
Sandu, A.-L., Rasmussen, I.-A., Lundervold, A., Kreuder, F., Neckelmann, G., Hugdahl, K., & 617
Specht, K. (2008). Fractal dimension analysis of MR images reveals grey matter structure 618
irregularities in schizophrenia. Computerized Medical Imaging and Graphics, 32, 150– 619
158. doi:10.1016/j.compmedimag.2007.10.005 620
Sandu, A.-L., Staff, R. T., McNeil, C. J., Mustafa, N., Ahearn, T., Whalley, L. J., & Murray, A. 621
D. (2014). Structural brain complexity and cognitive decline in late life: A longitudinal 622
study in the Aberdeen 1936 Birth Cohort. NeuroImage, 100, 558–563. 623
doi:10.1016/j.neuroimage.2014.06.054 624
Sargolzaei, S., Sargolzaei, A., Cabrerizo, M., Chen, G., Goryawala, M., Pinzon-Ardila, A., … 625
Adjouadi, M. (2015). Estimating intracranial volume in brain research: An evaluation of 626
methods. Neuroinformatics, 13, 427–441. doi:10.1007/s12021-015-9266-5 627
Seo, S., & Chung, M. K. (2011). Laplace-Beltrami eigenfunction expansion of cortical 628
manifolds. IEEE International Symposium on Biomedical Imaging, 2011, 372-375. 629
doi:10.1109/isbi.2011.5872426 630
Smith, M. J., Wang, L., Cronenwett, W., Goldman, M. B., Mamah, D., Barch, D. M., & 631
Csernansky, J. G. (2011). Alcohol use disorders contribute to hippocampal and subcortical 632
shape differences in schizophrenia. Schizophrenia Research, 131, 174–183. 633
doi:10.1016/j.schres.2011.05.014 634
Tae, W. S., Kim, S. S., Lee, K. U., Nam, E.-C., & Kim, K. W. (2008). Validation of hippocampal 635
volumes measured using a manual method and two automated methods (FreeSurfer and 636
IBASPM) in chronic major depressive disorder. Neuroradiology, 50, 569–581. 637
doi:10.1007/s00234-008-0383-9 638
Tamnes, C. K., Walhovd, K. B., Dale, A. M., Østby, Y., Grydeland, H., Richardson, G., … Fjell, 639
A. M. (2013). Brain development and aging: Overlapping and unique patterns of change. 640
NeuroImage, 68, 63–74. doi:10.1016/j.neuroimage.2012.11.039 641
Tang, Y.-Y., Hölzel, B. K., & Posner, M. I. (2015). The neuroscience of mindfulness meditation. 642
Nature Reviews Neuroscience, 16, 213–225. doi:10.1038/nrn3916 643
Thompson, P. M., Schwartz, C., Lin, R. T., Khan, A. A., & Toga, A. W. (1996). Three-644
dimensional statistical analysis of sulcal variability in the human brain. Journal of
645
Thompson, P., Moussai, J., Zohoori, A., Khan, A. A., Mega, M. S., Cummings, J. L., & Toga, A. 647
W. (1998). Cortical variability and asymmetry in normal aging and Alzheimer’s disease. 648
Cerebral Cortex, 8, 492–509. doi:10.1093/cercor/8.6.492 649
Toro, R., Poline, J.-B., Huguet, G., Loth, E., Frouin, V., Banaschewski, T., … Bourgeron, T. 650
(2014). Genomic architecture of human neuroanatomical diversity. Molecular Psychiatry,
651
20, 1011–1016. doi:10.1038/mp.2014.99 652
van der Kouwe, A. J. W., Benner, T., Salat, D. H., & Fischl, B. (2008). Brain morphometry with 653
multiecho MPRAGE. NeuroImage, 40, 559–569. doi:10.1016/j.neuroimage.2007.12.025 654
Wachinger, C., Golland, P., Kremen, W., Fischl, B., & Reuter, M. (2015). BrainPrint: A 655
discriminative characterization of brain morphology. NeuroImage, 109, 232–248. 656
doi:10.1016/j.neuroimage.2015.01.032 657
Walhovd, K. B., Fjell, A. M., Reinvang, I., Lundervold, A., Dale, A. M., Eilertsen, D. E., … 658
Fischl, B. (2005). Effects of age on volumes of cortex, white matter and subcortical 659
structures. Neurobiology of Aging, 26, 1261–1270. 660
doi:10.1016/j.neurobiolaging.2005.05.020 661
Walhovd, K. B., Westlye, L. T., Amlien, I., Espeseth, T., Reinvang, I., Raz, N., … Fjell, A. M. 662
(2011). Consistent neuroanatomical age-related volume differences across multiple 663
samples. Neurobiology of Aging, 32, 916–932. doi:10.1016/j.neurobiolaging.2009.05.013 664
Wenger, E., Mårtensson, J., Noack, H., Bodammer, N. C., Kühn, S., Schaefer, S., … Lövdén, M. 665
(2014). Comparing manual and automatic segmentation of hippocampal volumes: 666
Reliability and validity issues in younger and older brains. Human Brain Mapping, 35, 667
4236–4248. doi:10.1002/hbm.22473 668
Wonderlick, J. S., Ziegler, D. A., Hosseini-Varnamkhasti, P., Locascio, J., J. Bakkour, A., van 669
der Kouwe, A., … Dickerson, B. C. (2009). Reliability of MRI-derived cortical and 670
subcortical morphometric measures: Effects of pulse sequence, voxel geometry, and 671
parallel imaging. NeuroImage, 44, 1324–1333. doi:10.1016/j.neuroimage.2008.10.037 672
Yang, Z., Wen, W., Jiang, J., Crawford, J. D., Reppermund, S., Levitan, C., … Sachdev, P. S. 673
(2016). Age-associated differences on structural brain MRI in nondemented individuals 674
from 71 to 103 years. Neurobiology of Aging, 40, 86–97. 675
doi:10.1016/j.neurobiolaging.2016.01.006 676
Yotter, R. A., Nenadic, I., Ziegler, G., Thompson, P. M., & Gaser, C. (2011). Local cortical 677
surface complexity maps from spherical harmonic reconstructions. NeuroImage, 56, 961– 678
973. doi:10.1016/j.neuroimage.2011.02.007 679
Yun, H. J., Im, K., Jin-Ju Yang, Yoon, U., & Lee, J.-M. (2013). Automated sulcal depth 680
measurement on cortical surface reflecting geometrical properties of sulci. PLOS ONE, 8, 681
e55977. doi:10.1371/journal.pone.0055977 682
Yushkevich, P. A., Pluta, J. B., Wang, H., Xie, L., Ding, S.-L., Gertje, E. C., … Wolk, D. A. 683
(2015). Automated volumetry and regional thickness analysis of hippocampal subfields 684
and medial temporal cortical structures in mild cognitive impairment. Human Brain
685
Zhao, G., Denisova, K., Sehatpour, P., Long, J., Gui, W., Qiao, J., … Wang, Z. (2016). Fractal 687
dimension analysis of subcortical gray matter structures in Schizophrenia. PLOS ONE, 11, 688