PREDICTING THE MISSING VALUE IN A KNOWLEDGE BASED SYSTEM USING
BAYESIAN CLASSIFICATION TECHNIQUE
*,1
Sayak Konar,
2Md. Abdur
1
Assistant Professor (CSE),
23
Assistant Professor (BCA),
ARTICLE INFO ABSTRACT
When machine learning algorithms are applied to data collected from the huge amount of data in the universe, it is generally accepted that the data has not been consistently collected. The absence of expected data elements is common and th
involves the informative relevance of that data element in a specific purpose. Therefore, the absence of data may have information value of its own. In the process of designing an application intend support a heart diseases system where we can predict the probability of heart attack of a patient on basis upon certain condition. Bayesian Classification is commonly used for presenting uncertainty and covariate interactions in an easily interpretab
predict the missing value in a database, it is an excellent choice for medical decision support systems in diagnosis, treatment, and prognosis. In applying this we will be able to predict whether
present in the database or not and give some idea about the probability of heart
Copyright © 2015 Sayak Konar et al. This is an open access article distributed under the Creative Commons Att distribution, and reproduction in any medium, provided the original work is properly cited.
INTRODUCTION
There is a big amount of data being collected across a wide variety of fields today and it is beyond our ability to reduce and analyze those data without the use of some kind of automated analysis techniques. There is much information hidde
various fields of data. It is very difficult to obtain this information. So, it is essential for new types of computational techniques and tools to extract the knowledge for the benefit of human from the rapidly growing voluminous digital data. Knowledge discovery in databases (KDD) is the field that is gradually develops into an important and active area of research because there are certain kinds of challenges associated with the problem of discovering decision making solutions from the huge data. Knowledge discovery and data mining is the rapidly growing research field which merges together database management, probability theory, statistics, computational intelligence and related areas. The basic aim of all these is at extracting useful knowledge and information from voluminous data. Data mining is the nontrivial process of identifying valid, novel, potentially useful and ultimately understandable pattern in data with the wide use of databases and the explosive growth in their sizes.
*Corresponding author: Sayak Konar, Assistant Professor (CSE), BIEMS, India.
ISSN: 0975-833X
Vol.
Article History:
Received 16th September, 2015 Received in revised form 24th October, 2015
Accepted 19th November, 2015 Published online 30th December,2015
Citation:Sayak Konar, Md. Abdur Rahaman,
knowledge based system using Bayesian classification technique”,
Key words:
Predictions, Missing data,
Data mining, Bayesian Classification.
RESEARCH ARTICLE
PREDICTING THE MISSING VALUE IN A KNOWLEDGE BASED SYSTEM USING
BAYESIAN CLASSIFICATION TECHNIQUE
Abdur Rahaman,
2Debasrita Roy and
3Shameek Mukhopadhyay
Assistant Professor (CSE), BIEMS, India
2
M.Tech (CSE), VIT University, India
Assistant Professor (BCA), The Heritage Academy, India
ABSTRACT
When machine learning algorithms are applied to data collected from the huge amount of data in the universe, it is generally accepted that the data has not been consistently collected. The absence of expected data elements is common and the mechanism through which a data element is missing often involves the informative relevance of that data element in a specific purpose. Therefore, the absence of data may have information value of its own. In the process of designing an application intend support a heart diseases system where we can predict the probability of heart attack of a patient on basis upon certain condition. Bayesian Classification is commonly used for presenting uncertainty and covariate interactions in an easily interpretable way. Because of their efficient inference and ability to predict the missing value in a database, it is an excellent choice for medical decision support systems in diagnosis, treatment, and prognosis. In applying this we will be able to predict whether
present in the database or not and give some idea about the probability of heart
is an open access article distributed under the Creative Commons Attribution License, which distribution, and reproduction in any medium, provided the original work is properly cited.
There is a big amount of data being collected across a wide variety of fields today and it is beyond our ability to reduce and analyze those data without the use of some kind of automated analysis techniques. There is much information hidden in the various fields of data. It is very difficult to obtain this information. So, it is essential for new types of computational techniques and tools to extract the knowledge for the benefit of human from the rapidly growing voluminous digital data. owledge discovery in databases (KDD) is the field that is gradually develops into an important and active area of research because there are certain kinds of challenges associated with the problem of discovering decision making Knowledge discovery and data mining is the rapidly growing research field which merges together database management, probability theory, statistics, computational intelligence and related areas. The basic aim of ge and information Data mining is the nontrivial process of identifying valid, novel, potentially useful and ultimately understandable pattern in data with the wide use of databases
Data mining refers to extracting or “mining” knowledge from large amounts of data. Data mining is the search for the relationships and global patterns that exist in large databases but are hidden among large amounts of data.
The essential process of Knowledge Discovery is the conversion of data into knowledge in order to aid in decision making, referred to as data mining. Knowledge discovery process consists of an iterative sequence of
integration, data selection, data mining pattern recognition and knowledge presentation. Data mining is the search for the relationships and global patterns that exist in large databases bur are hidden among large amounts of data.
Missing data is a common problem in knowledge discovery, data mining and statistical inference. Several approaches to missing data have been used in developing trained decision systems. [Tang and MacLennan
2002) has studied and categorized missing data into three types: missing completely at random, missing
not missing at random. The easiest way to missing values is to discard the cases with missing values and do the analysis based only on the complete data. Howeve
rule and missing data may have information value to predict the decision for our own business or to setup a new business.
International Journal of Current Research Vol. 7, Issue, 12, pp.24098-24103, December, 2015
INTERNATIONAL
Md. Abdur Rahaman, Debasrita Roy and Shameek Mukhopadhyay, 2015. Bayesian classification technique”, International Journal of Current Research,
PREDICTING THE MISSING VALUE IN A KNOWLEDGE BASED SYSTEM USING
Shameek Mukhopadhyay
India
When machine learning algorithms are applied to data collected from the huge amount of data in the universe, it is generally accepted that the data has not been consistently collected. The absence of e mechanism through which a data element is missing often involves the informative relevance of that data element in a specific purpose. Therefore, the absence of data may have information value of its own. In the process of designing an application intended to support a heart diseases system where we can predict the probability of heart attack of a patient on basis upon certain condition. Bayesian Classification is commonly used for presenting uncertainty and le way. Because of their efficient inference and ability to predict the missing value in a database, it is an excellent choice for medical decision support systems in diagnosis, treatment, and prognosis. In applying this we will be able to predict whether the data is present in the database or not and give some idea about the probability of heart-attack to the patient.
ribution License, which permits unrestricted use,
Data mining refers to extracting or “mining” knowledge from large amounts of data. Data mining is the search for the relationships and global patterns that exist in large databases
are hidden among large amounts of data.
The essential process of Knowledge Discovery is the conversion of data into knowledge in order to aid in decision making, referred to as data mining. Knowledge discovery process consists of an iterative sequence of data cleaning, data integration, data selection, data mining pattern recognition and knowledge presentation. Data mining is the search for the relationships and global patterns that exist in large databases bur are hidden among large amounts of data.
sing data is a common problem in knowledge discovery, data mining and statistical inference. Several approaches to missing data have been used in developing trained decision MacLennan, 2005] Little and Rubin (1976, categorized missing data into three types: missing completely at random, missing at random, and not missing at random. The easiest way to missing values is to discard the cases with missing values and do the analysis based only on the complete data. However, the absence of association rule and missing data may have information value to predict the decision for our own business or to setup a new business.
INTERNATIONAL JOURNAL OF CURRENT RESEARCH
“Predicting the missing value in a
In this paper we develop a model where we apply Bayesian Classification technique to predict the probability of heart-attack i.e. based upon some certain condition of a patient we can predict the heart-attack probability.
MATERIALS AND METHODS
Knowledge based Systems are rich with hidden information that can be used for intelligent decision making. Classification and prediction are two forms of data analysis that can be used to extract models describing important data classes or to predict future data trends. Such analysis can help provide us with a better understanding of the data at large. Whereas classification predicts categorical (discrete, unordered) labels, prediction models continuous-valued functions Han, Kamber (Ho, 2005).
Bayesian classifiers are statistical classifiers. They can predict class membership probabilities, such as the probability that a given tuple belongs to a particular class. Bayesian classification is based on Bayes’ theorem, described below. Studies comparing classification algorithms have found a simple Bayesian classifier known as the naïve Bayesian classifier to be comparable in performance with decision tree and selected neural network classifiers. Bayesian classifiers have also exhibited high accuracy and speed when applied to large databases.
Bayes’ theorem is named after Thomas Bayes, a nonconformist English clergyman who did early work in probability and decision theory during the 18th century. Let
X
be a data tuple. In Bayesian terms,X
is considered “evidence.” As usual, it is described by measurements made on a set of n attributes. LetH
be some hypothesis, such as that the data tupleX
belongs to a specified classC
. For classification problems, we want to determineP
(
H
|
X
)
, the probability that the hypothesisH
holds given the “evidence” or observed data tupleX
. In other words, we are looking for the probability that tupleX
belongs to classC
, given that we know the attribute description ofX
.)
|
(
H
X
P
is the posterior probability, or a posterior probability, of H conditioned onX
. For example, suppose our world of data tuples are confined to customers described by the attributes age and income, respectively, and thatX
is a 35-year-old customer with an income of Rs.40, 000. Suppose thatH
is the hypothesis that our customer will buy a computer. ThenP
(
H
|
X
)
reflects the probability that customerX
will buy a computer given that we know the customer’s age and income.In contrast,
P
(H
)
is the prior probability, or a priori probability, ofH
. For our example, this is the probability that any given customer will buy a computer, regardless of age, income, or any other information, for that matter. The posterior probability,P
(
H
|
X
)
, is based on more information (e.g.,customer information) than the prior probability,
P
(H
)
, which is independent ofX
.)
( X
P
is the prior probability ofX
. Using our example, it is the probability that a person from our set of customers is 35 years old and earns Rs.40,000. “How are these probabilities estimated?”P
(H
)
,P
(
X
|
H
)
, andP
( X
)
may be estimated from the given data, as we shall see below. Bayes’ theorem is useful in that it provides a way of calculating the posterior probability,P
(
H
|
X
)
, fromP
(H
)
,P
(
X
|
H
)
, and)
( X
P
.Bayes’ Theorem is
) (
) ( ) | ( ) | (
X P
H P H X P X H
P ……… (1)
Now that we’ve got that out of the way, we will look at how Bayes’ theorem is used in the Bayesian classification. The naïve Bayesian classifier, or simple Bayesian classifier, works as follows:
1. Let D be a training set of tuples and their associated class labels. As usual, each tuple is represented by an n-dimensional attribute vector,
X
=(
x
1,
x
2,...,
x
n)
, depicting nmeasurements made on the tuple from n attributes, respectively,
A
1,
A
2,
A
3,...,
A
n.2. Suppose that there are m classes
C
1,
C
2,...,
C
m. Given atuple
X
, the classifier will predict thatX
belongs to the class having the highest posterior probability, conditioned onX
. That is, the naïve Bayesian classifier predicts that tuple X belongs to the class Ci if and only if
P
(
C
i|
X
)
P
(
C
j|
X
)
for 1≤ j ≤m;
j
i
Thus we maximize
P
(
C
i|
X
)
. The class Ci for which is)
|
(
C
X
P
i maximized is called the maximum posteriori hypothesis. By Bayes’ theorem (Equation (1))
) (
) ( ) | ( ) | (
X P
C P C X P X C
P i i
i
3. As P(X) is constant for all classes, only
P
(
X
|
C
i)
P
(
C
i)
need be maximized. If the class prior probabilities are not known, then it is commonly assumed that the classes are
equally likely, that is,
P
(
C
1)
P
(
C
2)
...
P
(
C
m)
,and we would therefore maximize
P
(
X
|
C
i)
. Otherwise, wemaximize P (X|Ci) P (Ci). Note that the class prior probabilities
may be estimated by
P
(
C
i)
= |C
i, D|/|D|, where |C
i, D|is the number of training tuples of class Ci in D.presumes that the values of the attributes are conditionally independent of one another, given the class label of the tuple (i.e., that there are no dependence relationships among the attributes). Thus,
( | ) = ∏ ( | ) = ( 1| ) × ( 2| ) × … . .×
( | ).
We can easily estimate the probabilities
)
|
(
),...
|
(
),
|
(
X
1C
iP
X
2C
iP
X
nC
iP
from the trainingtuples. Recall that here
X
krefers to the value of attributeA
kfor tuple
X
. [image:3.595.38.290.272.377.2]Implementation
Table 1. Knowledge based database: This is the total database on which the missing value is to be predicted.
Here we develop a heart-attack decision support system based upon certain condition of a patient. In table 1 there are 9 attributes,
i.e.patient_ id,blood_sugar{Yes},
}, , , {
_pressure highnormallow
blood
}, , ,
{highnormallow
cholestrol smoking{past,current,never}, },
, {Yes No
obesity age{40,40and50,50},
}, ,
{male female
gender heart_attack{Yes,No}.
In the above table the heart attack depends only one value of blood_sugar attributes i.e. Yes, blood_pressure may be high, low or normal, cholesterol may be high, low or normal, the patient may be a smoker in past, currently or never, the patient can have problem of obesity or not, the age is chosen of the patient in three category i.e. below and equal to 40, greater than 40 but less than 50 and greater than equal to 50. a patient can be male or female and the last one is heart_attack attribute which tells that whether it is possible for a heart attack or not.
We implement the Bayesian Classification technique by using Java code. First we make the above database in Microsoft Access, then we connect the java code to this database through the sun.jdbc.odbc.JdbcOdbcDriver.
Some small snippets of the different classes are shown in Algorithm format down below.
At first we compute the probability of each value of the
heart_attack attribute of the above database i.e.
P
(
C
i)
.Algorithm
County and countn are the total count of yes/no present in database pcounty and pcountn are the total count of probability present (Yes and No)
Step 1 :- Initialize county,countn and total to 0 Step 2:- Initialize pcounty and pcountn to 0
Step 3:- When class= "Yes" Execute query by selecting all from heart_attack where heart_attack is total class SET
Step 4:- While result set value is present Increment county Step 5:- When class="No" Execute query by selecting all from
heart_attack where heart_attack is total class SET Step 6:- While result set value is present Increment countn Step 7:- Total=county+countn;
Step 8:- Pcounty=county/total; Step 9:- Pcountn=countn/total;
Then each value of the each attribute corresponding to the each value of heart_attack is computed i.e. P(X|Ci).(Algorithm for blood pressure is shown below).
Algorithm
countyh_bp is for high blood pressure people present in Knowledge based system, countynor_bp is for normal blood pressure and countyl_bp is for low blood pressure
Step 1: - If attribute value equals("high") Increment countyh_bp
else If temp equals("normal") Increment countynor_bp else If temp equals("low") Increment countyl_bp Step 2:- pcountyh_bp=countyh_bp/county
Step 3:- pcountynor_bp=countynor_bp/county
Step 4:- pcountyl_bp=countyl_bp/county
After that we calculate every combination that can be possible for the seven attributes i.e.
gender age obesity smoking cholestrol pressure
blood sugar
blood_ , _ , , , , ,
Here total combination will be (1333232)324.
Algorithm
pgiven_y and pgiven_n are equal to yes and no of probabilities found in database. pcountny_bs is for probability of blood sugar, pcountnh_bp is for probability for blood pressure ,pcountnh_cho is for probability of cholestrol, pcountnpst_smo is for smoking, pcountny is for obesity and so on for the seven attributes
If blood_sugar equals("Yes"))
If blood_pressure equals("high") If cholestrol equals("high") If smoking equals("past") If obesity equals("Yes") If age<=40
pgiven_y is equal to pcountyy_bs*pcountyh_bp*pcountyh_cho *pcountypst_smo*pcountyy_ob
* pcounty1_age*pcountym_gen
pgiven_n is equal to pcountny_bs*pcountnh_bp *pcountnh_cho*pcountnpst_smo*pcountny_ob* pcountn1_age*pcountnm_gen
Then we take a combination from the total combination – the combination presented in the database already i.e. an unseen combination or missing combination.
At last we calculate the probability that the unseen combination is belonged to which value of the heart_attack attributes i.e. Yes or No.
Algorithm
pgiven_ty is for probability of Yes seen in database while pgiven_tn is for probability of NO seen in database. pcounty and pcountn are probability of counted yes and no present in database respectively
Step 1:- Initialize pgiven_ty,pgiven_tn equal to 0
Step 2: - pgiven_ty is equal to pgiveny*pcounty
Step 3:- pgiven_tn is equal to pgivenn*pcountn
Step 4:- If pgiven_ty > pgiven_tn classn="Yes"
else classn="No"
RESULTS
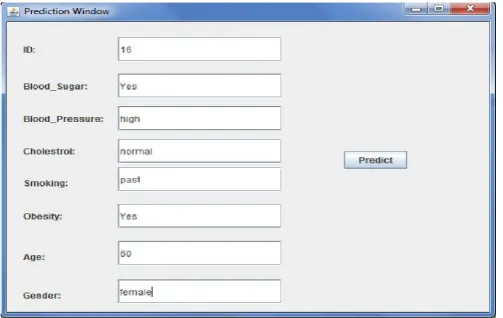
Let us take an unseen or missing sample i.e. the sample is not presented in the database, that is
, ,
, _
,
_sugar Yesblood pressure highcholestrol normalsmoking past
blood
Yes age gender female
obesity , 60,
Now we have to calculate the probability of each sample attribute corresponding to each value of heart_attack attribute.
i.e. for heart_attack attribute
15 7 ) (Yes
P
15 8 ) (No
P
Now, for heart_attack Yes
for blood _sugar:
7 7 ) | (Yes Yes
P
for blood _pressure:
7 4 ) | (high Yes
P
for
cholestrol
:7
1
)
|
(
normal
Yes
P
for
smoking
:7
2
)
|
(
past
Yes
P
for
obesity
:7
3
)
|
(
Yes
Yes
P
for
age
:7
3
)
|
60
(
Yes
P
for
gender
:7
5
)
|
(
female
Yes
P
Similarly for
heart
_
attack
No
for
blood _
sugar
:8
8
)
|
(
Yes
No
P
for
blood _
pressure
:8
1
)
|
(
high
No
P
for
cholestrol
:8
4
)
|
(
normal
No
P
for
smoking
:8
3
)
|
(
past
No
P
for
obesity
:8
4
)
|
(
Yes
No
P
for
age
:8
1
)
|
60
(
No
P
for
gender
:8
1
)
|
(
female
No
P
now,
) ,
60 , ,
,
, _
, _
| _
(
female gender age
Yes obesity past smoking normal cholestrol
high pressure blood
Yes sugar blood Yes attack heart P
=
)
7
5
7
3
7
3
7
2
7
1
7
4
7
7
(
)
0
.
001427
15
7
(
Similarly,
,
_
|
_
(
heart
attack
No
blood
sugar
Yes
P
,
,
_
pressure
high
cholestrol
normal
blood
)
,
60
,
,
obesity
Yes
age
gender
female
past
smoking
=)
8
1
8
1
8
4
8
3
8
4
8
1
8
8
(
)
0
.
00009765
15
8
(
Clearly, 0.001427>0.00009765
So, the above unseen sample is belonged to the Yes category of the heart_attack attribute i.e. there is a probability of heart attack if the above unseen condition is satisfied.
Fig. 1. Master Window:-It depicts the GUI interface that shows how the main window looks like
Fig. 2. Updation Form:- It gives us the portal to enter the details of a person
Fig.3. Dialog assertion box:- It gives the confirmation of the status of the patient at risk
[image:5.595.301.562.60.179.2]The creation of the database :
Fig.4. Heart Attack decision support system: It gives the whole database of heart attack decision support GUI
The system also predicts the missing value of the attributes. Let us see how this is work:
Fig.5. The missing attribute: It depicts the missing attribute in the database
We can see from table 3 that in ID=6 there is a missing value in blood_pressure attribute. Now we are going to predict this missing value by Bayesian Classification technique.
For blood_pressure attribute:
14 4 ) (high
P
14 3 ) (normal P
14 7 ) (low
P
Now, for blood_sugar=Yes
4 4 ) | (Yes high
P
3 3 ) |
(Yes normal
P
7 7 ) | (Yes low
P
For cholesterol=normal
4 3 ) | (normal high
P
3 2 ) |
(normal normal
P
7 3 ) |
(normal low
P
For smoking=current
4 1 ) |
(current high
P
3 0 ) |
(current normal
P
7 3 ) | (current low
P
For obesity=No
4 1 ) | (No high
P
3 3 ) |
(No normal
P
7 2 ) | (No low
P
For age=31 i.e. <=40
4 2 ) | 40
(age high
P
3 2 ) |
40
(age normal
[image:5.595.40.292.233.392.2] [image:5.595.36.293.564.697.2]
7 5 ) | 40 (age low
P
For gender=male
4 4 ) | (male high
P
3 1 ) |
(male normal
P
7 5 ) | (male low
P
For heart_attack=No
4 2 ) | (No high
P
3 1 ) |
(No normal
P
7 4 ) | (No low
P
Now,
, ,
, _
| _
(blood pressure high blood sugar Yescholestrol normal smoking current
P
) _
, ,
40
,age gender maleheart attck No
No
obesity =
0034 . 0 ) 14
4 ( ) 4 2 4 4 4 2 4 1 4 1 4 3 4 4
(
, ,
, _
| _
(blood pressure normal blood sugar Yescholestrol normal smoking current
P
) _
, ,
40
,age gender maleheart attck No
No
obesity =
0 ) 14
3 ( ) 3 1 3 1 3 2 3 3 3 0 3 2 3 3
(
and
, ,
, _
| _
(blood pressure lowblood sugar Yescholestrol normal smoking current
P
)
_
,
,
40
,
age
gender
male
heart
attck
No
No
obesity
=00764 . 0 ) 14
7 ( ) 7 4 7 5 7 5 7 2 7 3 7 3 7 7
(
so, easily we can see that 0.0034>0.00764>0
Therefore the missing value will be replaced by ‘high’ in the blood_pressure attribute.
After running the code the table is:
Fig.6. Prediction of the missing value. This table shows the prediction of the missing attribute
Conclusion
Decision Support in Heart Disease Prediction System is developed using Naive Bayesian Classification technique. The
system extracts hidden knowledge from a historical heart disease database. This is the most effective model to predict patients with heart disease. This model could answer complex queries, each with its own strength with respect to ease of model interpretation, access to detailed information and accuracy. DSHDPS can be further enhanced and expanded. For, example it can incorporate other medical attributes besides the above list. It can also incorporate other data mining techniques. Continuous data can be used instead of just categorical data. But applying Bayesian Classification in a large data base the complexity of the code is very much higher. So, we reduce some attributes related to the heart attack for simplicity of the program.
Acknowledgement
We are highly grateful to Prof. Venkatesan M., VIT Vellore, for his support and helpful suggestions in this project. We are also grateful to the esteemed institutions like Vellore Institute of Technology, Techno Group of Institutions and The Heritage Academy for their constant support and encouragement in every respect. Lastly, we are ever grateful to our parents, our better half’s and all other well wishers without whose support and good wishes this project would not have seen the light of the earth.
REFERENCES
Blake, C.L., Mertz, C.J. “UCI MachineLearning Databases”, http://mlearn.ics.uci.edu/databases/heartdisease/2004. Chapman, P., Clinton, J., Kerber, R. Khabeza, T., Reinartz, T.,
Shearer, C., Wirth, R.: “CRISP-DM 1.0: Step by step data mining guide”, SPSS, 1-78, 2000.
Han, J., Kamber, M.: “Data Mining Concepts and Techniques”,
Morgan Kaufmann Publishers, 2006.
Ho, T. J.: “Data Mining and Data Warehousing”, Prentice Hall, 2005.
Kaur, H., Wasan, S. K.: “Empirical Study on Applications of Data Mining Techniques in Healthcare”, Journal of
Computer Science, 2(2), 194-200, 2006.
Little RJA, Rubin DB. 2000. Statistical analysis with missing data, 2nd ed. Wiley-Interscience.
Rubin DB 1976. Inference and missing data. Biometrika; 63:581-92.
Sellappan Palaniappan, Rafiah Awang, Intelligent Heart Disease Prediction System Using Data Mining Techniques, 978-1-4244-1968- 5/08/$25.00 ©2008 IEEE.
Sellappan, P., Chua, S.L.: “Model-based Healthcare Decision Support System”, Proc. Of Int. Conf. on Information Technology in Asia CITA’05, 45-50, Kuching, Sarawak, Malaysia, 2005.
Shantakumar B. Patil, Y.S. Kumaraswamy, Intelligent and Effective Heart Attack Prediction System Using Data Mining and Artificial Neural Network, European Journal of Scientific Research ISSN 1450-216X Vol.31 No.4 (2009), pp.642-656 © Euro Journals Publishing, Inc. 2009. Tang, Z. H., MacLennan, J. 2005. “Data Mining with SQL
Server 2005”, Indianapolis: Wiley, 2005.
Wu, R., Peters, W., Morgan, M.W.: “The Next Generation Clinical Decision Support: Linking Evidence to Best Practice”, Journal Healthcare Information Management, 16(4), 50-55, 2002.