HPLC–ASSAY OF DICLOFENAC IN HUMAN PLASMA:
1
Rahul Kumar, *
,1Devendra
1
Department of Pharmacology and Therapeutics, King George’s Medical University UP Lucknow India
2
Center of Biomedical Research, Lucknow India
ARTICLE INFO ABSTRACT
A rapid and sensitive HPLC
human plasma using chlorzoxazone as internal standard.
extracted from the plasma sample using simple protein precipitation method separation was
0.1 % formic acid in TDW and
was validated with a linear range of 1.25 The intra
respectively, and intra 5.18%, respectively. in human plasma.
Copyright © 2015 Rahul Kumar et al. This is an open access article distributed under the Creative Commons Att distribution, and reproduction in any medium, provided the original work is properly cited.
INTRODUCTION
Diclofenac (Fig.1), chemically known as sodium {2 dichlorophenyl)- amino] phenyl} acetate, is a phenylacetic acid derivative non-steroidal anti-inflammatory drug (NSAID). It is used for the relief of pain and inflammation in various conditions: musculoskeletal and joint disorders such as rheumatoid arthritis and osteoarthritis, soft tissue disorders such as sprains, and other painful conditions such as renal colic, acute gout, dysmenorrhoea, migraine, and after some surgical procedures (Sweetman, 2005).
quantification of diclofenac in its various drug formulations and biological samples was addressed in many reports. Liquid chromatography using various detection modes has been widely applied. Examples of these reports are HPLC with UV detection (Kole et al., 2011) (El-Kommos
HPLC with mass spectrometric detection
2008), (Abdel-Hamid et al., 2001). In addition, other analytical techniques involved the use of potentiometric membrane sensors (Kormosh et al., 2009), spectrophotometry (El‐Didamony and Amin, 2004) (Mitic
chemometric spectrophotometry (Cantarelli
spectrofluorimetry [15], infrared and Raman spectroscopy (Mazurek andSzostak, 2011), gravimetry
Souza, 2005), and capillary zone electrophoresis
et al., 2012).
*Corresponding author: DevendraKumar,
Department of Pharmacology and Therapeutics, King George’s Medical University UP Lucknow India
ISSN: 0975-833X
Article History: Received 21st July, 2015
Received in revised form 19th August, 2015
Accepted 25th September, 2015
Published online 20th October, 2015
Key words:
Diclofenac, Human plasma, Protein binding.
Citation: Rahul Kumar, DevendraKumar,Neerja
Application for protein binding study”, International Journal of Current Research
RESEARCH ARTICLE
IN HUMAN PLASMA: APPLICATION FOR PROTEIN BINDING STUDY
Devendra
Kumar,
2Neerja Trivedi and
1Rakesh Kumar
Department of Pharmacology and Therapeutics, King George’s Medical University UP Lucknow India
Center of Biomedical Research, Lucknow India
ABSTRACT
A rapid and sensitive HPLC-PDA method was developed for the quanti
human plasma using chlorzoxazone as internal standard. The analyte and internal standard were extracted from the plasma sample using simple protein precipitation method
separation was achieved on a Thermo (250 × 4.6 mm, 5 µm) column
0.1 % formic acid in TDW and acetonitrile (40: 60, v/v with); at a flow rate of 1.0 ml /min was validated with a linear range of 1.25 – 40 µg /ml for diclofenac
The intra- and inter-day assay precision ranged from 2.03% to 6.69% respectively, and intra- and inter- day assay accuracy was between
5.18%, respectively. The method was successfully applied to the protein binding studies of diclofenac in human plasma.
is an open access article distributed under the Creative Commons Attribution License, which distribution, and reproduction in any medium, provided the original work is properly cited.
Diclofenac (Fig.1), chemically known as sodium {2-[(2,6- amino] phenyl} acetate, is a phenylacetic acid inflammatory drug (NSAID). It is used for the relief of pain and inflammation in various conditions: musculoskeletal and joint disorders such as rthritis, soft tissue disorders such as sprains, and other painful conditions such as renal colic, acute gout, dysmenorrhoea, migraine, and after some . Moreover, the quantification of diclofenac in its various drug formulations and biological samples was addressed in many reports. Liquid chromatography using various detection modes has been widely applied. Examples of these reports are HPLC with UV
et al., 2012) and
HPLC with mass spectrometric detection (Sparidans et al., . In addition, other analytical techniques involved the use of potentiometric membrane , spectrophotometry Mitic et al., 2007), Cantarelli et al., 2011), spectrofluorimetry [15], infrared and Raman spectroscopy , gravimetry (Tubino andDe , and capillary zone electrophoresis (Lachmann
Department of Pharmacology and Therapeutics, King George’s Medical
There are, however, a few simple precise and rapid methods for determining the plasma concentration of
they are much less those using hi
chromatography (HPLC). Most existing methods require tedious procedures or require special equipment. That is why the aim of this study was to standardize simple, precise selective, highly robust RP-
determining the concentration of
This method was applicable for protein binding study in human plasma.
MATERIALS AND METHODS
Chemicals and Materials
Diclofenac and Chlorzoxazone (Internal standard, IS) were obtained from Sigma Aldrich (St.Louis, MO).
acetonitrile and methanol were from Pvt Ltd (Mumbai, India). Sodium acetate acid AR, and ammonia solution (25%) Merck Pvt. Ltd (Mumbai, India). purchased from SRL pvt. Ltd Mumbai
obtained from a Milli-Q PLUS PF water purification system. Heparin sodium injection I.P. (1000 IU/mL) was purchased from Biologicals E. Limited
plasma was collected as per the guidelines of the institutional ethics committee.
International Journal of Current Research Vol. 7, Issue, 10, pp.21277-21281, October, 2015
INTERNATIONAL
Neerja Trivedi and Rakesh Kumar Dixit, 2015. “Hplc–assay of diclofenac in human plasma:
International Journal of Current Research, 7, (10), 21277-21281.
APPLICATION FOR PROTEIN BINDING STUDY
Rakesh Kumar Dixit
Department of Pharmacology and Therapeutics, King George’s Medical University UP Lucknow India
was developed for the quantification of diclofenac in The analyte and internal standard were extracted from the plasma sample using simple protein precipitation method. Chromatographic Thermo (250 × 4.6 mm, 5 µm) column with a mobile phase consisting at a flow rate of 1.0 ml /min. The assay diclofenac using 200 µL of plasma sample. 2.03% to 6.69% and 1.63 to 5.24 %, day assay accuracy was between from 1.86 to 6.7% and 2.85 % to essfully applied to the protein binding studies of diclofenac
ribution License, which permits unrestricted use,
There are, however, a few simple precise and rapid methods for determining the plasma concentration of diclofenac in patients, they are much less those using high performance liquid chromatography (HPLC). Most existing methods require tedious procedures or require special equipment. That is why the aim of this study was to standardize simple, precise HPLC method a method for ng the concentration of diclofenac in human plasma. This method was applicable for protein binding study in human
MATERIALS AND METHODS
Chlorzoxazone (Internal standard, IS) were Aldrich (St.Louis, MO). HPLC grade acetonitrile and methanol were from Sigma Aldrich Chemicals Sodium acetate AR, glacial acetic acid AR, and ammonia solution (25%) were purchased from E (Mumbai, India). Potassium chloride was purchased from SRL pvt. Ltd Mumbai Ultrapure water was Q PLUS PF water purification system.
I.P. (1000 IU/mL) was purchased from Biologicals E. Limited (Hyderabad, India). Human ed as per the guidelines of the institutional
INTERNATIONAL JOURNAL OF CURRENT RESEARCH
Instrumentation and chromatographic conditions
The method was developed using a Waters HPLC system (Milford USA) consisted of a binary pump (model 515), auto sampler (model 717) connected to waters 2996 Photo diode Array detector. The separation was achieved on Thermo (250 × 4.6 mm, 5 µm) column with a mobile phase consisting 0.1 % formic acid in TDW and acetonitrile (40:60, v/v); at a flow rate of 1 mL/ min. Detection range of PDA detector was 200-500nm. Detection was carried out with PDA at 279 nm wave lenght. Total run time was 14 min and volume of injection was 50 μL, prior to injection of analyte, the column was equilibrated for 30-40 min with mobile phase. Analysis was performed at ambient temperature. The data collection and analysis were performed using breeze - version 3.1 software.
Fig.1. Structure of diclofenac (analyte) and Chlorzoxazone (IS)
Preparation of Stock and standard Solution
Diclofenac and IS stock solutions for CS samples were prepared in acetonitril (normal concentrations 1.0 mg/ml). CS samples were prepared by spiking respective stock solutions in blank humanplasma at concentrations of 1.25 2.5, 5, 10, 20 and 40 µg/ml. CS samples were prepared from a blank plasma pool. Diclofenac stock solution for QC was prepared separately. QC samples at three different concentrations (1.25, 10 and 40 µg/ml as LLOQ, medium and high, respectively) were prepared separately in five replicates, independent of the calibration standards. Calibration curves were plotted as concentration of drugs versus peak area response. QC samples were prepared from different matrix pools on each day of analysis. All prepared plasma samples were stored at -15 ◦ C or below and all prepared stock solutions were stored at a 4 ◦C.
Sample Preparation
Calibration standard, QC and plasma-protein binding samples
were extracted using protein precipitation method (Bhatta
et al., 2010). An aliquot of sample mixture (200 µl) of blank
human plasma mixed with 10 µl of internal standard (5µg/ ml). In 180 µL of plasma add 10 µL of diclofenac (stock cc) and 10 µL of IS. Vortex it for 2 min. Prior to analysis, all frozen samples were thawed and allowed to equilibrate at room temperature. To an aliquot of 200 µl of spiked plasma sample and 20 ml internal standard (5 mg/ml) were added and vortexed for 20 s. Then, 600 ml of acetonitrile was added to precipitate plasma protein. The sample was then vortexed vigorously for 2 min and centrifuged at 12,000 rpm for 15 min. The supernatant organic layer was transferred to clean test tube, dried and finally reconstituted in 200 µl acetonitrile. The reconstituted
solution was transferred into a 300 µl autosampler vials and 50 µl was injected into HPLC.
Recovery
The recovery of diclofenac and IS, was determined by comparing the responses of the analytes extracted from replicate QC samples (n = 5) with the response of analytes from post-extracted plasma samples at equivalent concentration. Recoveries of diclofenac were determined at QC low, QC medium and QC high concentrations, viz., 1.25, 10 and 40 µg/ml, the recovery of the IS was determined at a single concentration of 5 µg/ml.
Validation procedure
The method was validated to demonstrate the specificity, linearity, matrix effect, accuracy, precision and stability (Guideline For Industry, FDA) (Food andAdministration, 2007). The specificity of the method was evaluated by analyzing blank human plasma samples collected from six different rats to investigate the potential interferences in the liquid chromatographic peak region for the analyte and IS using the proposed extraction procedure and chromatographic conditions. Linearity was tested at six concentration levels covering a range of 1.25 – 40 µg / ml. The calibration curve was obtained by plotting the peak area ratio (peak area analyte/peak area IS) versus concentration. The results were fitted to a linear regression analysis y = mx + c, a using weighing factor (1/x2).
The acceptance criteria for each back-calculated standard concentration were ± 15% deviation from the nominal value except at the LOQ, which was set at ± 20% . The lower limit of quantitation (LOQ) of the validation was assessed as the lowest concentration on the calibration curve that could be quantitatively determined with acceptable precision and accuracy within ± 20%. The LOQ was established based on six replicates on five consecutive days. The matrix effect was evaluated in human plasma by comparing the corresponding peak areas of the post extraction spiked samples to those of the standard solutions evaporated directly and reconstituted in mobile phase. Experiments were performed at the three QC levels. If the ratio was less than 85% or more than 115%, the matrix effect was regarded as being of significance.
Batches consisting of five calibration standards at each concentration and QC samples were analyzed on five days to complete the method validation. In each batch, QC samples at 1.25, 10 and 40 µg/ml were assayed in sets of five replicates to evaluate the intra- and inter- day precision and accuracy. The criteria for acceptability of the data included accuracy (% bias) and precision which must be within ± 15% of the nominal value and ± 20% at the LOQ. The accuracy was expressed as % bias:
%Bias = (observed conc. − nominal conc.) × 100 / nominal conc.
All stability studies were carried out at 1.25 and 40 µg/ml in five replicates. The freeze-thaw stability was determined after three freeze-thaw cycles (room temperature to -70 ± 10 °C).
The post extracted auto-sampler stability of diclofenac was examined at 4 °C for 72 h. The bench-top stability of diclofenac in biomatrix was evaluated at ambient temperature (25 ± 5 ºC) for 24 h. The long-term freezer stability was determined at -80 ± 10 °C over 30 days.
The method was validated in compliance with FDA guidelines, in terms of specificity, Selectivity, linearity, precision, accuracy, limit of quantification, limit of detection, robustness and other aspects of analytical validation.
Application of the method
Diclofenac plasma protein binding in human plasma was performed at three different concentrations (1.25 and 40 ng/mL). The bound and unbound fractions of diclofenac were separated from human plasma samples by ultra-filtration through the centrifuge micro partition system (Amicon, Centrifree device Inc., MA, USA) (Chhonker et al., 2013).
Samples in duplicates (0.5 mL) were placed in Centrifree devices and centrifuged at 1500g for 10 min to collect approximate 10% (100 mL) of the original volume of plasma as ultrafiltrate. Non-specific binding of diclofenac was determined by spiking test concentration into 0.01 M phosphate buffer (pH 7.4) and applied same procedure as plasma. The in-vitro samples and their respective ultra-filtrates were analyzed by HPLC. The non-specific binding and plasma protein binding were determined using the following equations:
Non-specific binding (%)
= 100-[(conc. in buffer ultrafiltrate)×100/conc. in buffer] Plasma protein binding (%)
=100-[(conc. in plasma ultrafiltrate) × 100/conc. in plasma].
RESULT AND DISCUSSION
HPLC method development
Analysis of diclofenac is a challenge owing to its high polarity and small molecular size, which lead to poor retention on reversed-phase liquid chromatographic columns. The chromatographic conditions were optimized with respect to specificity, resolution, and time of analysis. Hence we started the development activity with C18 stationary phase of various
manufacturers such as Zorbax, ODS (250 × 4.6 mm, 5 µm), Spherisorb ODS (250 × 4.6 mm, 5 µm) Symmetry shield C18
(250 mm × 4.6 mm, 5.0 μ), Phenomenex Luna C18 (250 ×4.6
mm, 5 µm), Spheri-5, CYANO column (30 × 4.6 mm, 5 µm ) and Thermo (250 × 4.6 mm, 5 µm) column . The last two columns were found to be suitable. However, Thermo (250 × 4.6 mm, 5 µm) column was used as a good resolution and minimum elution time were obtained. The stationary phase was not only the parameter which could give better resolution. Mobile phase, pH and organic modifies also played very important role which leads the best separation.
Different mobile phases containing acetonitrile, methanol, water and buffer were examined. Initially the methanol was used as an organic modifier which gives the poor baseline with baseline drift. Hence the response for the diclofenac was reduced. To improve the resolution and response, acetonitrile
was tried as an organic modifier. The base line was found good and response diclofenac was improved. Effects of pH (3–7) and ionic strength (5–50 mM) were investigated using phosphate and acetate buffer. It was found that at higher and lower pH the tailing of the rifampicin peak was more and also resolution was poor of the analyte. The effect of buffer concentration on the retention of diclofenac was also studied. The mobile phase containing acetonitrile: 0.1% formic acid in TDW (60: 40 v/v, pH 7), was selected as optimal for obtaining well-resolved peaks with acceptable system suitability parameters. Flow rates from 0.5 to 1.5 mL min-1 were tested.
Flow rates less than 0.5 ml/min led to an increase in retention times peak broadening and the time of analysis. High flow rates led to a remarkable increase in column pressure and decrease in resolution. It was found that 1 mL min-1 was optimal as it compromised between resolution and run time. Effect of the wavelength on the response factor was observed over the wavelength range 200–500. The detection wavelength, 279 nm was found optimal due to the high absorbtivity at this wavelength for rifampicin (Fig-2). Complete separation was achieved in < 14 min at ambient temperature (Fig. 2).
Fig.2. Representative Overlay chromatogram of analyte and IS after extraction of CS in human plasma
Sample extraction and recovery
Validation procedures
Selectivity and specificity
Six lots of blank human plasma were analyzed for the evaluation of selectivity and specificity. These samples did not show any significant interfering peaks at the retention times of either diclofenac the IS (Fig. 2).
Matrix effect
The adverse consequences of matrix effects on the results of quantitative HPLC analyses have been fully recognized and the assessment of matrix effects is becoming an integral part of method development and validation. The matrix effect for diclofenac at 1.25 and 40 µg/ ml concentration levels in human plasma was < ± 2%. Thus no significant matrix effect was observed.
Calibration curves
The peak area ratio of analyte to IS was linear over a concentration range of 1.25 -40 µg/ml for diclofenac. The calibration curve had a reliable reproducibility over the concentration range 1.25 -40 µg/ml. The average regression (n=3) was found to be 0.997 ± 0.0015. The lowest concentration with RSD < ± 20% was taken as the LOQ and this was found to be 1.25 µg/ml.
Accuracy and precision
Intra- and inter-assay precision was determined from the relative standard deviations (%RSD) of the quality control samples (LQC, MQC, and HQC). The intra-day assay precision and intra-assay accuracy were within the limits and ranges from 2.03% to 6.69% and 1.63 to 5.24 %, respectively (Table 1). The inter-day assay precision and accuracy ranged from 1.86 to 6.7% and 2.85 % to 5.18%, respectively. Both intra and inter-day precision and accuracy were found to be within the accepted variable limits.
Stability
The predicted concentrations for diclofenac at 1.25 and 40 µg /ml samples deviated within the nominal concentrations in a battery of stability tests, viz., auto sampler stability (24 h), bench-top stability (6 h), repeated three freeze-thaw cycles and at -70 ± 10 ºC for 30 days (Table 2). The results were found to be within the assay variability limits during the entire process.
Application of the method
In-vitro plasma protein binding studies
[image:4.595.165.432.75.129.2]The present in-vitro study was carried out to determine the extent of plasma protein binding of diclofenac. Bound and unbound drug from spiked/treated plasma was separated by the
Table 1. Intra-day and inter-day assay precision and accuracy for diclofenac
Accuracy (%Bias) Precision (%RSD) Concentration (µg/ml) Intra-day Inter-day Intra-day Inter-day
1.5 6.7 5.18 5.24 6.69
10 -7.57 -5.12 3.04 2.19
[image:4.595.153.450.157.254.2]40 1.86 2.85 1.63 2.03
Table 2. Stability of diclofenac in human plasma
Nominal Conc.
Stability Mean S.D. Precision (%RSD)
Accuracy (%bias) 1.25 µg/ml Auto sampler stability 1.23 0.04 0.45 0.99
Bench-top stability 1.32 0.12 1.77 -5.32 Freeze-Thaw stability 1.29 0.08 1.43 -0.58 Long-term stability 1.25 0.14 1.07 5.1 40 µg/ml Auto sampler stability 40.41 1.10 2.12 -0.68
Bench-top stability 40.64 1.08 2.32 -5.34 Freeze-Thaw stability 40.32 1.16 3.09 -0.6 Long-term stability 39.99 2.19 1.98 3.49
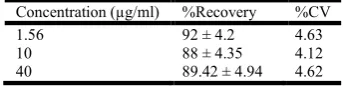
Table 3. Recovery of diclofenac in human plasma
Concentration (µg/ml) %Recovery %CV
1.56 92 ± 4.2 4.63
10 88 ± 4.35 4.12
40 89.42 ± 4.94 4.62
Table 4. Bound and unbound diclofenac in protein binding study
No of Freeze Thaw cycle % Unbound %Bound %Recovery Fresh Human Plasma 0.11±0.015 99.88±0.015 60.76±2.26 1st Freeze Thaw 0.78±0.66 99.22±0.66 89.60±1.32
2ndFreeze Thaw 0.31±0.06 99.69±0.06 87.45±3.52
3rdFreeze Thaw 0.53±0.22 99.47±0.22 89.97±4.17 4th Freeze Thaw 0.68 ±0.22 99.32±0.32 89.97±4.17
5th Freeze Thaw 0.98±0.22 99.02±0.22 89.97±4.17
[image:4.595.214.386.285.328.2] [image:4.595.177.424.357.429.2]ultra-filtration technique. Concentration dependent human plasma protein binding was not observed within the selected concentration range. Non-specific binding of diclofenac was found <5%. PPB of diclofenac was determined at conc. 50µg/mL in human plasma. PPB of diclofenac in fresh human plasma was 99.88±0.015 and after 5th Freeze-thaw of plasma PPB was found to be 99.02±0.22. (Table-4)
Conclusion
Bio analytical method was developed and validated in human plasma for the model drugs chosen. Effect of multiple freeze-thaw cycles on the extent of plasma protein binding of drugs determined after every freeze-thaw cycles. No significant difference was observed in the percent bound determined in fresh human plasma and plasma after multiple freeze-thaw cycles In summary, a sensitive, rapid and specific HPLC assay of diclofenac using protein precipitation method was developed and validated. A good linearity was obtained over the concentration range of 1.25 - 40 µg/ ml. Moreover, the assay demonstrate a high sensitivity with LOQ 1.25 µg/ ml using 200 µL volume of plasma sample and simple liquid-liquid extraction procedure. The method is accurate, precise, reproducible and was applied successfully protein binding study.
Acknowledgements
The authors are thankful to Vice chancellor, King George’s Medical University, Uttar Pradesh Lucknow, India, for his constant encouragement and support.
REFERENCES
Abdel-Hamid, M.E., Novotny, L. and Hamza, H. 2001. Determination of diclofenac sodium, flufenamic acid, indomethacin and ketoprofen by LC-APCI-MS. Journal of
Pharmaceutical and Biomedical Analysis, 24, 587-594.
Bhatta, R.S., Kumar, D., Chhonker, Y.S., Saxena, A.K. and Jain, G.K. 2010. Bioanalytical method development and validation of novel antithrombotic agent S002-333 by LC-MS/MS and its application to pharmacokinetic studies. Biomedical chromatography : BMC, 24, 1234-1239. Cantarelli, M.A., Pellerano, R.G., Marchevsky, E.J. and
Camina, J.M. 2011. Simultaneous determination of amoxicillin and diclofenac in pharmaceutical formulations using UV spectral data and the PLS chemometric method. Analytical sciences: the international journal of the Japan
Society for Analytical Chemistry, 27, 73-78.
Chhonker, Y.S., Kumar, D., Shrivastava, P., Kumar, D., Singh, R., Chandasana, H. and Bhatta, R.S. 2013. LC–MS/MS assay for the determination of natamycin in rabbit and human plasma: Application to a pharmacokinetics and protein binding study. Journal of Pharmaceutical Analysis, 3, 144-148.
El‐Didamony, A. and Amin, A. 2004. Adaptation of a color reaction for spectrophotometric determination of diclofenac sodium and piroxicam in pure form and in pharmaceutical formulations. Analytical letters, 37, 1151-1162.
El-Kommos, M.E., Mohamed, N.A. and Abdel Hakiem, A.F. 2012. Selective reversed phase high performance liquid chromatography for the simultaneous determination of some pharmaceutical binary mixtures containing NSAIDS.
Journal of Liquid Chromatography andRelated
Technologies, 35, 2188-2202.
Food and Administration, D. 2007. Guidance for industry: bioanalytical method validation (2001). Maryland, USA. Kole, P.L., Millership, J. and McElnay, J.C. 2011.
Determination of diclofenac from paediatric urine samples by stir bar sorptive extraction (SBSE)-HPLC-UV technique. Talanta, 85, 1948-1958.
Kormosh, Z.A., Hunka, I. and Bazel, Y.R. 2009. A potentiometric sensor for the determination of diclofenac.
Journal of Analytical Chemistry, 64, 853-858.
Lachmann, B., Kratzel, M. and Noe, C.R. 2012. Rapid determination of diclofenac in pharmaceutical formulations by capillary zone electrophoresis. Scientia pharmaceutica, 80, 311-316.
Mazurek, S. and Szostak, R. 2011. Comparison of infrared attenuated total reflection and Raman spectroscopy in the quantitative analysis of diclofenac sodium in tablets. Vibrational Spectroscopy, 57, 157-162.
Mitic, S., Miletic, G., Pavlovic, A., Tosic, S. and Pecev, E. 2007. Determination of diclofenac sodium in commercial pharmaceutical formulations and human control serum using a kinetic-spectrophotometric method. Chemical andpharmaceutical bulletin, 55, 1423-1426.
Sparidans, R.W., Lagas, J.S., Schinkel, A.H., Schellens, J.H. and Beijnen, J.H. 2008. Liquid chromatography-tandem mass spectrometric assay for diclofenac and three primary metabolites in mouse plasma. Journal of chromatography. B, Analytical technologies in the biomedical and life
sciences, 872, 77-82.
Sweetman, S.C. 2005. Dose adjustment in renal impairment: response from Martindale: the Complete Drug Reference. Bmj, 331, 292-293.
Tubino, M. and De Souza, R.L. 2005. Gravimetric method for the determination of diclofenac in pharmaceutical preparations. Journal of AOAC International, 88, 1684-1687.