FUZZY EOQ MODEL FOR CONTROLLABLE DETERIORATION RATE AND TIME
DEPENDENT DEMAND AND INVENTORY HOLDING COST
1,*
1
Research Scholar, PG and Research Department of Mathematics, Periyar E.V.R. College,
Tiruchirappa
2
Associate Professor, PG and Research Department of Mathematics, Periyar E.V.R. College,
Tiruchirappalli
ARTICLE INFO ABSTRACT
In this paper, we have developed a deterministic fuzzy invent
which demand rate quadratic and holding cost is linear function of time. During deterioration period, deterioration rate can be controlled using preservation technology (PT). The ordering cost, deterioration cost and pu
study is to
unit time is minimum
deterioration. The derived model is illustrated by a numerical example.
Copyright©2017, Palani and Maragatham. This is an open access article distributed under the Creative Commons Attribution License, which permits unrestricted use, distribution, and reproduction in any medium, provided the original work is properly cited.
INTRODUCTION
Inventory may be considered as an accumulation of a product that would be used to satisfy future demands for that product. An optimal replenishment policy is dependent on ordering cost, inventory
confronting a supply manager in any modern organization is the control and maintenance of inventories of deteriorating items. Fortunately, the rate of deterioration is too small for items like steel, to
considering deterioration in the determination of economic lot size. So in this paper, an inventory model is developed for deteriorating items by considering the fact that using the preservation
which he can reduce the economic losses, improve the customer service level and increase business competitiveness. demand and holding cost for physical goods may be time dependen
So, in this paper we consider that demand and holding cost are time dependent.
deteriorating inventory model with partial backlogging when demand and deterioration rate is constant. Vinod kumar Mishra (2013) developed an inventory model of instantaneous deteriorating items with controllable deterioration rate for time d
demand and holding cost. Vinod kumar Mishra
rate for time-dependent demand and time-varying holding cost. Parmar Kirtan and Gothi constant deterioration rate and time dependent demand and IHC.
with stock-dependent demand by allowing preservation technology cost as a decision variable in conjunction with replacement policy. Dye and Hsieh (2012) presented an extended model of Hsu
is a function of the length of replenishment cycle.
model for deteriorating items with time-quadratic demand and partial backlogging. Sarala Pareek and Garima Sharma developed an inventory model with Weibull distribution deteriorating item with exponential declining demand and partial backlogging.
*Corresponding author: Palani, R.,
Research Scholar, PG and Research Department of Mathematics, Periyar E.V.R. College, Tiruchirappalli
ISSN: 0975-833X
Article History:
Received 27th February, 2017
Received in revised form 07th March, 2017
Accepted 04th April, 2017
Published online 23rd May,2017
Key words:
Inventory, Triangular Fuzzy Number, Deteriorating Items, Preservation Technology, Exponential Distribution, Quadratic Demand, Graded Mean Representation Method, Time Varying Holding Cost.
Citation: Palani, R. and Maragatham, M. 2017. “Fuzzy EOQ model for controllable deterioration rate and time dependent demand and Inventory holding cost”, International Journal of Current Research, 9, (0
RESEARCH ARTICLE
FUZZY EOQ MODEL FOR CONTROLLABLE DETERIORATION RATE AND TIME
DEPENDENT DEMAND AND INVENTORY HOLDING COST
*
Palani, R. and
2Maragatham, M.
Research Scholar, PG and Research Department of Mathematics, Periyar E.V.R. College,
Tiruchirappalli - 620023, Tamil Nadu, India
Associate Professor, PG and Research Department of Mathematics, Periyar E.V.R. College,
Tiruchirappalli - 620023, Tamil Nadu, India
ABSTRACT
In this paper, we have developed a deterministic fuzzy inventory model for deteriorating items in which demand rate quadratic and holding cost is linear function of time. During deterioration period, deterioration rate can be controlled using preservation technology (PT). The ordering cost, deterioration cost and purchase cost are assumed as triangular fuzzy number. The purpose of our study is to find an optimal replenishment cycle and order quantity so that the total inventory cost per unit time is minimum. An exponential distribution is used to represent the distri
deterioration. The derived model is illustrated by a numerical example.
This is an open access article distributed under the Creative Commons Attribution License, which permits unrestricted use, distribution, and reproduction in any medium, provided the original work is properly cited.
Inventory may be considered as an accumulation of a product that would be used to satisfy future demands for that product. An optimal replenishment policy is dependent on ordering cost, inventory carrying cost and shortage cost. An important problem confronting a supply manager in any modern organization is the control and maintenance of inventories of deteriorating items. Fortunately, the rate of deterioration is too small for items like steel, toys, glassware, hardware, etc. There is little requirement for considering deterioration in the determination of economic lot size. So in this paper, an inventory model is developed for deteriorating items by considering the fact that using the preservation technology the retailer can reduce the deterioration rate by which he can reduce the economic losses, improve the customer service level and increase business competitiveness.
demand and holding cost for physical goods may be time dependent. Time also plays and important role in the inventory system. So, in this paper we consider that demand and holding cost are time dependent. Recently, Mishra and Singh
deteriorating inventory model with partial backlogging when demand and deterioration rate is constant. Vinod kumar Mishra developed an inventory model of instantaneous deteriorating items with controllable deterioration rate for time d
demand and holding cost. Vinod kumar Mishra (2014) developed deteriorating inventory model with controllable deterioration varying holding cost. Parmar Kirtan and Gothi (2015
nt deterioration rate and time dependent demand and IHC. Leea and Dye (2012) formulated a deteriorating inventory model dependent demand by allowing preservation technology cost as a decision variable in conjunction with replacement presented an extended model of Hsu et al. (2010) by assuming that the preservation technology cost is a function of the length of replenishment cycle. Jagadeeswari and Chenniappan, (2014) developed an order level inventory
quadratic demand and partial backlogging. Sarala Pareek and Garima Sharma developed an inventory model with Weibull distribution deteriorating item with exponential declining demand and partial
Research Scholar, PG and Research Department of Mathematics, Periyar E.V.R. College, Tiruchirappalli - 620023, Tamil Nadu, India
International Journal of Current Research
Vol. 9, Issue, 05, pp.50295-50302, May, 2017
OF CURRENT RESEARCH
Fuzzy EOQ model for controllable deterioration rate and time dependent demand and Inventory holding , 9, (05), 50295-50302.
FUZZY EOQ MODEL FOR CONTROLLABLE DETERIORATION RATE AND TIME
DEPENDENT DEMAND AND INVENTORY HOLDING COST
Research Scholar, PG and Research Department of Mathematics, Periyar E.V.R. College,
Associate Professor, PG and Research Department of Mathematics, Periyar E.V.R. College,
ory model for deteriorating items in which demand rate quadratic and holding cost is linear function of time. During deterioration period, deterioration rate can be controlled using preservation technology (PT). The ordering cost, rchase cost are assumed as triangular fuzzy number. The purpose of our find an optimal replenishment cycle and order quantity so that the total inventory cost per . An exponential distribution is used to represent the distribution of time to deterioration. The derived model is illustrated by a numerical example.
This is an open access article distributed under the Creative Commons Attribution License, which permits unrestricted
Inventory may be considered as an accumulation of a product that would be used to satisfy future demands for that product. An carrying cost and shortage cost. An important problem confronting a supply manager in any modern organization is the control and maintenance of inventories of deteriorating items. ys, glassware, hardware, etc. There is little requirement for considering deterioration in the determination of economic lot size. So in this paper, an inventory model is developed for technology the retailer can reduce the deterioration rate by which he can reduce the economic losses, improve the customer service level and increase business competitiveness. In reality, the t. Time also plays and important role in the inventory system. Recently, Mishra and Singh (2016) developed a deteriorating inventory model with partial backlogging when demand and deterioration rate is constant. Vinod kumar Mishra developed an inventory model of instantaneous deteriorating items with controllable deterioration rate for time dependent developed deteriorating inventory model with controllable deterioration 2015) developed EOQ model with formulated a deteriorating inventory model dependent demand by allowing preservation technology cost as a decision variable in conjunction with replacement by assuming that the preservation technology cost developed an order level inventory quadratic demand and partial backlogging. Sarala Pareek and Garima Sharma (2014) developed an inventory model with Weibull distribution deteriorating item with exponential declining demand and partial
620023, Tamil Nadu, India
OF CURRENT RESEARCH
Amutha and Chandrasekaran (2012) developed an inventory model for deteriorating Products with Weibull Distribution Deterioration, Time-Varying Demand and Partial Backlogging. Kirtan Parmar and Gothi (2014) developed a deterministic inventory model for deteriorating items where time to deterioration has Exponential distribution and with time-dependent quadratic demand. Also, Gothi and Kirtan Parmar (2015) have extended above deterministic inventory model by taking two parameter Weibull distributions to represent the distribution of time to deterioration and shortages are allowed and partially backlogged. Kirtan Parmar and Gothi (2015) developed an economic production model for deteriorating items using three parameter Weibull distributions with constant production rate and time varying holding cost. The consideration of PT is important due to rapid social changes, and the fact that PT can reduce the deterioration rate significantly. By the efforts of investing in preservation technology, we can reduce the deterioration rate. So in this paper, we made the model of Mishra and Singh (2011) more realistic by considering the fact that use of preservation technology can reduce the deterioration rate significantly, which help the retailers to reduce their economic losses. In many inventory models uncertainty is due to fuzziness and fuzziness is the closed possible approach to reality. In recent years some researchers gave their attention towards a time dependent rate because the demand of newly launched products such as fashionable garments, electronic items and mobiles etc. increases with time and later it becomes constant. Deterioration is defined as damage, decay or spoilage of the items that are stored for future use always loose part of their value with passage of time, so deterioration cannot be avoided in any business scenarios. Syed (2007) developed a fuzzy inventory model without shortages using Signed distance method. They used fuzzy triangular number for both ordering cost and holding cost. Maragatham. M, discussed the A fuzzy model with changing deterioration rate. Jhuma Bhowmick (6) discussed the fuzzy inventory model for deteriorating items with time-varying demand and shortages. Umap (2010) formed a fuzzy EOQ model for deteriorating items with two warehouses. Palani and Maragatham, (2016), developed EOQ model for controllable deterioration rate and time dependent demand and Inventory holding cost. In this paper, the same inventory model used in fuzzy environment in real life for uncertainty. The triangular fuzzy numbers are used in this paper. This model is solved by analytically to determine the optimal cycle time and the derived model is illustrated by a numerical example. This paper, some of the parameters are considered as triangular fuzzy numbers for fuzzy cases. For defuzzification of the total cost function and optimum order quantity graded mean representation method is used.
2. Preliminaries
2.1 Basic Definitions
2.1.1 Fuzzy Set
If is a collection of objects denoted generically by x, then a fuzzy set in is defined as a set of ordered pairs = ; ( ) / , where ( ) is called the membership function for the fuzzy set . The membership function maps each element of to a membership grade between o and 1 (included).
2.1.2 - Cut
The set of elements that belong to the fuzzy set at least to the degree of is called the level set or - cut ( . ), ( )= { : ( ) ≥ }.
2.2Fuzzy Number
Fuzzy numbers are of great important in fuzzy systems.
2.2.1Fuzzy Number
A fuzzy subset of the real line R with membership function : → [0, 1] is called a fuzzy number if
i. is normal, ( . ), there exit an element such that ( ) = 1.
ii. is fuzzy convex, ( . ), [ + (1 − ) ] ≥ ( ) Λ ( ) , , ∀ [0, 1].
iii. is upper continuous.
iv. is bounded,
where = { : ( ) > 0}.
2.2.2Generalized Fuzzy Number
Any fuzzy subset of the real line R, whose membership function satisfies the following conditions, is a generalized fuzzy number
i. ( ) is a continuous mapping from R to the closed interval [0, 1]. ii. ( ) = 0, −∞ < ≤ .
iii. ( ) = ( ) is strictly increasing on [ , ].
iv. ( ) = 1, ≤ ≤ .
vi. ( ) = 0, ≤ ≤ ∞, where , , , are real numbers.
2.2.3Triangular Fuzzy Number
The fuzzy set = ( , , ), where ≤ ≤ and defined on R, is called triangular fuzzy number, if the membership
function of is given by
( ) =
⎩ ⎪ ⎨ ⎪
⎧ −− , ≤ ≤ −
− , ≤ ≤
0 , ℎ
2.2.4Operations of Triangular Fuzzy Number
Consider two triangular fuzzy numbers = ( , , ), = ( , , ).
i.The addition of and is
where , are real numbers.
ii.The multiplication of and is
,
where , , ,
If are all non zero positive real numbers, then
iii. then the subtraction of from is
where are real numbers.
iv. where are all non zero positive real numbers, then division of and is
v.For any real number
2.3Defuzzification
Defuzzification is the conversion of a fuzzy quantity to a crisp quantity. Defuzzification methods obtain the representative value of a fuzzy set.
2.3.1Graded Mean Representation Method
Let be a fuzzy number with left reference function and right reference function . Let and be the inverse functions
of and respectively. The graded mean integration representation of is defined by
with
By the above formula, the graded mean representations of triangular fuzzy number is given by
.
3. Assumptions and Notations
The mathematical model is based on the following notations and assumptions.
Notations
( ): Quadratic demand rate. : Fuzzy ordering cost per order.
: Fuzzy deterioration cost per unit per unit time. : Inventory holding cost per unit per unit of time.
( ): Reduced deterioration rate due to use of preservation technology. : Deterioration rate.
: Resultant deterioration rate, = ( − ( )).
: Fuzzy purchase cost per unit. : Order quantity in one cycle.
: The time from which the deterioration start in the inventory. : Length of cycle time (decision variable).
: Total cost per unit time.
( ): The defuzzified value of ( ) by Graded mean representation method.
( ) : The instantaneous state of the positive inventory level at time t. : The defuzzified value of by Graded mean representation method
Assumptions
The model is derived under the following assumptions.
1.The inventory system deals with single item.
2.The annual demand rate is a function of time and it is .
3.Preservation technology is used for controlling the deterioration rate.
4.Holding cost is linear function of time and it is .
5.The lead time is zero. 6.Time horizon is finite.
7.The deterioration rate is constant.
8.No repair or replacement of the deteriorated items takes place during a given cycle. 9.Total inventory cost is a real, continuous function which is convex to the origin.
4. Mathematical Model and Analysis
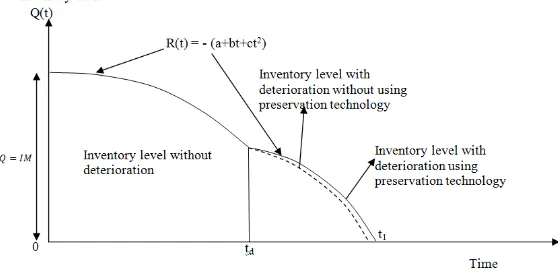
[image:4.595.159.438.625.763.2]Here, the replenishment policy of a deteriorating item with partial backlogging is considered. The objective of the inventory problem is to determine the optimal order quantity and the length of ordering cycle so as to keep the total relevant cost as low as possible, where the preservation technology is used to control the deterioration rate. The behavior of inventory system at any time is shown in figure 1.
Replenishment is made at time and the inventory level is at its maximum level Q. During the period (0, td) the inventory
level is decreasing and at time t1 the inventory reaches zero level.
The pictorial representation is shown in the figure 1.
As described above, the inventory level decreases owing to demand rate as well as deterioration during (0, t1). Hence, the
differential equation representing the inventory status is given by
(1)
(2)
The boundary conditions are and
(3)
Using the boundary condition the solution of the equation (1) is
(4)
Similarly, the solution of equation (2) is given by
(Neglecting higher powers of θ) (where
which is obtained using
(5)
In equations (4) and (5) values of and should coincide at , which implies that
(6)
Fuzzy model
Here some of the parameters are fuzzy numbers namely and .
Let , and
The total cost comprises of following costs
1) The fuzzy ordering cost
(7) 2) The fuzzy deterioration cost during the period (td, t1)
(8) 3) The inventory holding cost during the period (0, t1)
(9)
Thus, the order size during total interval (0, t1) is given by
4) Purchase cost per cycle
(10)
Hence the fuzzy total cost per unit time is given by
(11)
Then
The fuzzy total cost is defuzzified by graded mean representation method.
Our objective is to determine optimum value of t1 to minimize TC. The values of t1 for which
satisfying the condition
The optimal solution of the equation (11) is obtained by using Mathematica software. This has been illustrated by the following numerical example.
5. Numerical Example
Crisp Model (Palani, 2016)
We consider the following parametric values for ,
.
Fuzzy Model
, and .
We obtain the optimal value of units, and minimum total cost .
6. Conclusions
The products with high deterioration rate are always crucible to the retailer’s business. In real markets, the retailer can reduce the deterioration rate of a product by making effective capital investment in storehouse equipment. In this study, to reduce the deterioration rate during deterioration period of deteriorating items, we use the preservation technology. A solution procedure is given to find an optimal replenishment cycle and order quantity so that the total inventory cost per unit time is minimum. For fuzzy model the ordering cost, deterioration cost and purchasing cost are represented by triangular fuzzy numbers. Graded mean representation method is used for defuzzification. A numerical example has been presented to illustrate the model. This model can further be extended by taking more realistic assumptions such as probabilistic demand rate, a model allowing shortages etc.
REFERENCES
Amutha, R. and Dr. Chandrasekaran, E. 2012. “An inventory model for deteriorating products with Weibull distribution deterioration, time-varying demand and partial backlogging”, International Journal of Scientific & Engineering Research, Volume 3, Issue 10.
Dye, C.Y., and Hsieh, T.P. 2012. “An optimal replenishment policy for deteriorating items with effective investment in
preservation technology”, European Journal of Operational Research, 218(1) 106–112.
Gothi U. B. and Kirtan Parmar 2015. “Order level lot size inventory model for deteriorating items under quadratic demand with time dependent IHC and partial backlogging”, Research Hub - International Multidisciplinary Research Journal IMRRHJ), Vol 2, Issue 2.
Hsu, P.H., Wee, H.M., and H.M., Teng, 2010. “Preservation technology investment for deteriorating inventory”, International
Journal of Production Economics, 124(2) 388–394.
Jagadeeswari, J. and Chenniappan, P. K. 2014. “An order level inventory model for deteriorating items with time – quadratic demand and partial backlogging”, Journal of Business and Management Sciences, Vol. 2, No. 3A, 17 – 20.
Jhuma Bhowmick and G.P. Samauta 2011. “A deterministic inventory model of deteriorating items with two rates of production, shortages and variable production cycle”, International Scholarly Research Network, ISRN Applied Mathematics, article ID 657464, 1- 16.
Kirtan Parmar and Gothi U. B. 2014. “Order level inventory model for deteriorating items under quadratic demand with time dependent IHC”, Sankhaya Vignan, NSV 10, No. 2, pp. 1 – 12.
Kirtan Parmar and Gothi U. B. 2015. “An EPQ model of deterioration items using three parameter Weibull distribution with constant production rate and time varying holding cost”, International Journal of Science, Engineering and Technology
Research (IJSETR), Vol. 4, Issue 2, pp. 0409 – 0416.
Leea Y. P., and Dye C. Y. 2012. “An inventory model for deteriorating items under stock-dependent demand and controllable deterioration rate”, Computers & Industrial Engineering, 63(2) 474–482.
Maragatham. M and Lakshmidevi. P.K. 2016. “A Fuzzy Model with Changing Deterioration Rate”, International Journal of
Engineering Research, 5 (11), 851-855.
Mishra, V.K., and Singh, L.S. 2011.“Deteriorating inventory model for time dependent demand and holding cost with partial
backlogging”, International Journal of Management Science and Engineering Management, 6(4), pp. 267 –271.
Palani, R. and Maragatham, M. 2016. “EOQ model for controllable deterioration rate and time dependent demand and Inventory holding cost”, International Journal of Mathematics Trends and Technology (IJMTT), 39 (4), 245-251,
Parmar Kirtan and Gothi, U. B. 2015. “EOQ model with constant deterioration rate and time dependent demand and IHC”,
Pacific Business Review International, 7(12), pp-01-11.
Sarala Pareek and Garima Sharma 2014. “An inventory model with Weibull distribution deteriorating item with exponential declining demand and partial backlogging”, ZENITH International Journal of Multidisciplinary Research, Vol.4 (7).
Syed J.K. and Aziz, L.A. 2007. “Fuzzy Inventory Model without Shortages Using Signed Distance Method”, Applied Mathematics
& Information Sciences - An International Journal, Dixie W Publishing Corporation, U.S.A, 1(2), 203-203.
Umap H.P. 2010. “Fuzzy EOQ model for deteriorating items with two warehouses”, Journal of Statistics and Mathematics, 1(2),
01-06.
Vinod kumar Mishra, 2013. “An inventory model of instantaneous deteriorating items with controllable deterioration rate for time
dependent demand and holding cost”, Journal of Industrial Engineering and Management, 6(2), 495 – 506.
Vinod kumarMishra, 2014. “Deteriorating inventory model with controllable deterioration rate for time dependent demand and time varying holding cost”, Yugoslav Journal of Operations Research, 24, 87-98.