Proceedings of the Workshop on Distributional Semantics and Compositionality (DiSCo’2011), pages 38–42,
Shared task system description: Measuring the Compositionality of
Bigrams using Statistical Methodologies
Tanmoy Chakraborty, Santanu Pal, Tapabrata Mondal, Tanik Saikh, Sivaji Bandyopadhyay
Department of Computer Science and Engineering Jadavpur University
[email protected], [email protected], [email protected], [email protected],
Abstract
The measurement of relative
compositionality of bigrams is crucial to identify Multi-word Expressions
(MWEs) in Natural Language
Processing (NLP) tasks. The article presents the experiments carried out as part of the participation in the shared task ‘Distributional Semantics and Compositionality (DiSCo)’ organized as part of the DiSCo workshop in ACL-HLT 2011. The experiments deal with various collocation based statistical approaches to compute the relative compositionality of three types of bigram phrases (Adjective-Noun, Verb-subject and Verb-object combinations). The experimental results in terms of both fine-grained and coarse-grained compositionality scores have been evaluated with the human annotated gold standard data. Reasonable results have been obtained in terms of average point difference and coarse precision.
1 Introduction
The present work examines the relative compositionality of Adjective-Noun (ADJ-NN; e.g., blue chip), Verb-subject (V-SUBJ; where noun acting as a subject of a verb, e.g., name imply) and Verb-object (V-OBJ; where noun acting as an object of a verb, e.g., beg question) combinations using collocation based statistical approaches. Measuring the relative compositionality is useful in applications such as
machine translation where the highly non-compositional collocations can be handled in a special way (Hwang and Sasaki, 2005).
Multi-word expressions (MWEs) are sequences of words that tend to co-occur more frequently than chance and are either idiosyncratic or decomposable into multiple simple words (Baldwin, 2006). Deciding idiomaticity of MWEs is highly important for machine translation, information retrieval, question answering, lexical acquisition, parsing and language generation. Compositionality refers to the degree to which the meaning of a MWE can be predicted by combining the meanings of its components. Unlike syntactic compositionality (e.g. by and large), semantic compositionality is continuous (Baldwin, 2006). Several studies have been carried out for detecting compositionality of noun-noun MWEs using WordNet hypothesis (Baldwin et al., 2003), verb-particle constructions using statistical similarities (Bannard et al., 2003; McCarthy et al., 2003) and verb-noun pairs using Latent Semantic Analysis (Katz and Giesbrecht, 2006).
Our contributions are two-fold: firstly, we experimentally show that collocation based statistical compositionality measurement can assist in identifying the continuum of compositionality of MWEs. Secondly, we show that supervised weighted parameter tuning results in accuracy that is comparable to the best manually selected combination of parameters.
2 Proposed Methodologies
The present task was to identify the numerical judgment of compositionality of individual phrase. The statistical co-occurrence features used in this experiment are described.
Frequency: If two words occur together quite frequently, the lexical meaning of the composition may be different from the combination of their individual meanings. The frequency of an individual phrase is directly used in the following methods.
Point-wise Information (PMI): An
information-theoretic motivated measure for discovering interesting collocations is point-wise mutual information (Church and Hanks, 1990). It is originally defined as the mutual information between particular events X and Y and in our case the occurrence of particular words, as follows:
= log., ≈ log., 1
PMI represents the amount of information provided by the occurrence of the event represented by X about the occurrence of the event represented by Y.
T-test: T-test has been widely used for collocation discovery. This statistical test tells us the probability of a certain constellation (Nugues, 2006). It looks at the mean and variance of a sample of measurements. The null hypothesis is that the sample is drawn from a distribution with mean. T-score is computed using the equation (2):
, =, −
!", + ""
≈$,%&'(')*
+$,% … … … . . 2 In both the equations (1) and(2), C(x) and
C(y) are respectively the frequencies of word X and word Y in the corpus, C(X,Y) is the combined frequency of the bigrams <X Y> and N is the total number of tokens in the corpus. Mean value of P(X,Y) represents the average probability of the bigrams <X Y>. The bigram count can be extended to the frequency of word X when it is followed or preceded by Y in the window of K words (here K=1).
Perplexity: Perplexity is defined as 2H(X)
2.$ = 2& ∑ 0124 3… … … … . 3
where H(X) is the cross-entropy of X. Here, X is the candidate bigram whose value is measured throughout the corpus. Perplexity is interpreted as the average “branching factor” of a word: the statistically weighted number of words that follow a given word. As we see from equation (4), Perplexity is equivalent to entropy. The only advantage of perplexity is that it results in numbers more comprehensible for human beings. Here, perplexity is measured at both root level and surface level.
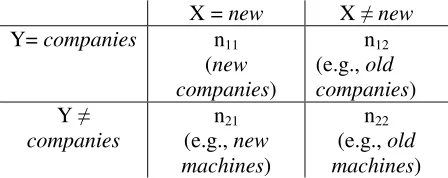
Chi-square test: The t-test assumes that probabilities are approximately normally distributed, which may not be true in general (Manning and Schütze, 2003). An alternative test for dependence which does not assume normally distributed probabilities is the χ2-test (pronounced “chi-square test”). In the simplest case, this 2 test is applied to a 2-by-2 table as
shown below:
X = new X ≠ new
Y= companies n11
(new companies)
n12 (e.g., old companies) Y ≠
companies
n21 (e.g., new machines)
[image:2.612.319.543.342.431.2]n22 (e.g., old machines)
Table 1: A 2-by-2 table showing the dependence of occurrences of new and companies
Each variable in the above table depicts its individual frequency, e.g., n11 denotes the
frequency of the phrase “new companies”. The idea is to compare the observed frequencies in the table with the expected
frequencies when the words occur
independently. If the difference between observed and expected frequencies is large, then we can reject the null hypothesis of independence. The equation for this test is defined below:
6
=8 78998− 8989
99+ 89899+ 8989+ 889+ 8 4
3 Used Corpora and Dataset
The system has used the WaCkypedia_EN1 corpora which are a 2009 dump of the English Wikipedia (about 800 million tokens). The corpus was POS-tagged and lemmatized followed by full dependency parsing. The total number of candidate items for each relation type extracted from the corpora is: ADJ-NN (144, 102), V-SUBJ (74, 56), V-OBJ (133, 96). The first number within brackets is the number of items with fine-grained score, while the second number refers to the number of items with coarse grained score. These candidate phrases are split into 40% training, 10% validation and 50% test sets. The training data set consists of three columns: relation (e.g., EN_V_OBJ), phrase (e.g., provide evidence) and judgment score (e.g. "38" or "high"). Scores were averaged over valid judgments per phrase and normalized between 0 and 100. These numerical scores are used for the Average Point Difference score. For coarse-grained score, phrases with numerical judgments between 0 and 33 as “low”, 34 to 66 as “medium” and 66 and over got the label "high".
4 System Architecture
The candidate items for each relation type are put in a database. For each candidate, all the statistical co-occurrence feature values like frequency, PMI, T-test, Perplexity (root and surface levels) and Chi-square tests are calculated. The final fine-grained scores are computed as the simple average and weighted average of the individual statistical co-occurrence scores. Another fine-grained score is based on the T-test score that performed best on the training data. Coarse-grained scores are obtained for all the three fine-grained scores.
1
http://wacky.sslmit.unibo.it/
5 Weighted Combination
The validation data is used as the development data set for our system. The weighted average of the individual statistical co-occurrence scores is calculated by assigning different weights to each co-occurrence feature score. The weights are calculated from the training data using the average point difference error associated with the co-occurrence feature. The feature which gives minimum error score is assigned the higher weight. For each co-occurrence feature score i, if the error on the training data is ei, the weight Wi assigned to the
co-occurrence feature score i is defined as: C?= ∑ 100 − 100 − ?
?
? 5 The individual co-occurrence feature scores are normalized to be in the range of 0 to 1 before calculating the weighted sum.
Note that, when measuring coarse-precision, the fine-grained scores are bucketed into three bins as explained in Section 3.
6 Evaluation Metrics
The system output is evaluated using the following evaluation metrics:
Average Point Difference (APD): the mean error (0 to 100) is measured by computing the average difference of system score and test data score. The minimum value implies the minimum error and the maximum accuracy of the system. Coarse Precision (CP): the test data scores are binned into three grades of compositionality (non-compositional, somewhat compositional, and fully-compositional), ordering the output by score and optimally mapping the system output to the three bins.
Errors PMI T test
Perx-Root
Perx-Surface
chi square
Average Weighted
Average
APD 29.35 24.25 35.23 31.4 36.57 21.22 21.20
[image:3.612.93.512.580.650.2]CP 0.31 0.60 0.48 0.42 0.45 0.57 0.62
System
Spearman
rho
Kendall’s
Tau
Average Point Difference (APD) Coarse Precision (CP)
ALL
ADJ-NN
V-SUBJ
V-OBJ
ALL
ADJ-NN
V-SUBJ
V-OBJ
Baseline 0.20 0.20 32.82 34.57 29.83 32.34 0.297 0.288 0.300 0.308
RUN-1 0.33 0.23 22.67 25.32 17.71 22.16 0.441 0.442 0.462 0.425
RUN-2 0.32 0.22 22.94 25.69 17.51 22.60 0.458 0.481 0.462 0.425
[image:4.612.81.554.58.179.2]RUN-3 -0.04 -0.03 25.75 30.03 26.91 19.77 0.475 0.442 0.346 0.600
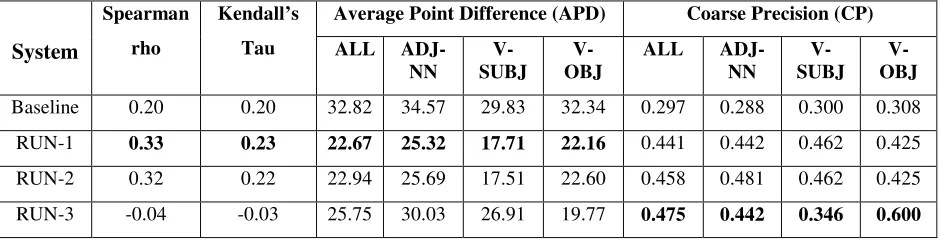
Table 3: Overall System results on test set Spearman's rho coefficient: it is used to
estimate strength and direction of association between two ordinal level variables (i.e., gold standard results and system results). It can range from -1.00 to 1.00.
Kendall’s tau rank coefficient: it is a measure of rank correlation, i.e., the similarity of the orderings of the gold standard results and the system results. This coefficient must be in the range from -1 (complete disagreement) to 1 (complete agreement).
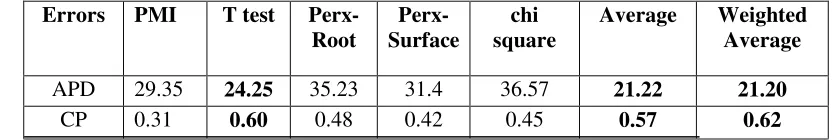
7 Experimental Results
The system has been trained using the training data set with their fine-grained score. The evaluation results on the validation set are shown in Table 2. It is observed that T-test gives the best results on the validation data set in terms of precision. Based on the validation set results, three procedural approaches are run and three results are reported on the test data.
RUN-1 (Weighted Combination): These results are obtained from the weighted combination of individual scores. Both the perplexity measures are not useful to make significant gain over the compositionality measure. For the rank combination experiments, the best co-occurrence measures, i.e., PMI, Chi-square and T-test are considered. For the weighted combination, the results are reported for the weight triple (0.329, 0.309, 0.364) for PMI, Chi-square and T-test respectively.
RUN-2 (Average Combination): These
results are reported by simply averaging the values obtained from the five measures.
RUN-3 (Best Scoring Measure: T-test): The T-test results are observed as the best scoring measure used in this experiment.
When calculating the coarse-grained score the compositionality of each phrase is tagged as ‘high’, ‘medium’ or ‘low’ discussed in Section 3.
The final test data set has been evaluated on the gold standard data developed by the organizers and the results on the three submitted runs are described in Table 3. The positive value of Spearman’s rho coefficient implies that the system results are in the same direction with the gold standard results; while the Kandell’s tau indicates the independence of the system value with the gold standard data. As expected, Table 3 shows that the weighted average score (Run 1) gives better accuracy for all phrases based on the APD scores. On the other hand, the T-test results (Run 3) give high accuracy for the coarse precision calculation while it is in the last position for ADP scores.
8 Conclusions
We have demonstrated the usefulness of statistical evidences to indicate the continuum of compositionality of the bigrams, i.e., adjective-noun, verb-subject and verb-object combinations. The coarse precision can be improved if three ranges of numerical values can be tuned properly and the size of the three bins can be varied significantly. As part of our future task, we plan to use other statistical collocation-based methods (e.g. Log-likelihood ratio, Relative frequency ratios etc.).
Acknowledgement
References
Young-Sook Hwang and Yutaka Sasaki. 2005. Context-dependent SMT model using bilingual verb-noun collocation. In proceedings of 43rd Annual Meeting of association for Compositional Linguistics (ACL’ 05).
T. Baldwin. 2006. Compositionality and MWEs: Six of one, half a dozen of the other? In proceedings of the MWE workshop. ACL.
T. Baldwin, C. Bannard, T. Tanaka, and D. Widdows. 2003. An empirical model of MWE decomposability. In proceedings of the MWE workshop. ACL.
C. Bannard, T. Baldwin, and A. Lascarides. 2003. A statistical approach to the semantics of verb-particles. In proceedings of the MWE workshop. ACL.
G. Katz and E. Giesbrecht. 2006. Automatic identification of non-compositional MWEs using latent semantic analysis. In proceedings of the MWE workshop. ACL.
Church, K. W. and Hanks, P. 1990. Word association norms, mutual information and lexicography. Computational Linguistics, 16(1):22-29
Christopher D. Manning and Hinrich Schǖtze,. 2003. Foundations of Statistical Natural Language Processing, The MIT Press, Cambridge, Massachusetts, London, England.