Phase Decomposition in a Mechanically Alloyed Cu-44.5 at%Ni-22.5 at%Fe Alloy
during Isothermal Aging
Victor M. Lopez-Hirata, Maribel L. Saucedo-Mun˜oz and Lucia G. Diaz-Barriga-Arceo
Instituto Politecnico Nacional (ESIQIE), Apartado Postal 118-556, Admon. GAM, D.F. 07051, Mexico
A supersaturated solid solution of Cu-44.5 at%Ni-22.5 at%Fe alloy was produced by ball milling of a pure chemical elemental mixture for 1080 ks. An fcc supersaturated solid solution with a grain size of about 20 nm was obtained after milling. This alloy was subsequently aged at 803, 898 and 1003 K for different times. The growth kinetics of the modulation wavelength was determined from the X-ray diffraction results and followed the Lifshitz-Slyozov-Wagner theory for a diffusion-controlled coarsening in the MA alloy after aging. The growth kinetics of composition modulation wavelength for the MA alloy was faster at 803 and 898 K than that for the same alloy composition obtained by a conventional processing and then aged at the same temperatures. The activation energy for the decomposed phase coarsening process in the MA alloy was lower than that corresponding to the conventionally-processed alloy. [doi:10.2320/matertrans.47.1317]
(Received December 20, 2005; Accepted March 8, 2006; Published May 15, 2006)
Keywords: mechanical alloying; phase decomposition, kinetics, aging treatment, copper-nickel-iron alloys
1. Introduction
Cu-Ni-Fe alloys have studied extensively1–3)because they are a typical example of spinodally decomposed alloys. As is well known, the mechanical alloying (MA) process has been widely used to produce supersaturated solid solutions even in almost immiscible alloy systems.4,5) Yanagitani, Murakami and Tanaka6)carried out the mechanical alloying of Cu-Ni-Fe powders using a low-energy ball mill and they reported the formation of a supersaturated solid solution for a Cu-20 mass%Ni-8 mass%Fe powder composition, after ball milling. Besides, they also reported the occurrence of spinodal decomposition for this alloy after aging at about 773 K. The nanometric grain size is one of the most interesting characteristics in this type of alloys. An increase in the interfacial free energy is expected to occur in the MA alloys because of its grain size. Furthermore, the atomic diffusion is also expected to enhance as a result of the increase in the density of crystalline defects.7)The spinodal decomposition in the Cu-Ni-Fe alloy system occurs by the decomposition of an unstable single phase, after aging. The growth kinetics of the decomposed phases depends on both the thermodynamic and diffusion factors.8)So far, there is not report on the growth kinetics of the decomposed phases in the aged MA Cu-Ni-Fe alloys. Thus, the aim of this work is to study the growth kinetic and morphology of the decomposed phases in a MA Cu-44.5 at%Ni-22.5 at%Fe alloy, after isothermal aging.
2. Experimental Procedure
The MA Cu-44.5 at%Ni-22.5 at%Fe alloy powders were prepared by low-energy ball milling of a pure powder mixture for 1080 ks. The chemical purity of Cu, Ni and Fe powders was 99.999, 99.99 and 99.9 mass%, respectively. The ball milling was conducted at 110 rpm using austenitic stainless steel vial and balls under an argon gas atmosphere with a ball-to-powder ratio of 36:1. The chemical analysis of MA powders was carried out with an atomic absorption equipment. The MA Cu-Ni-Fe alloy powders were analyzed
by X-ray diffraction (XRD) with a Shimadzu XD-3A diffractometer using copper K radiation. XRD patterns were smoothed using a commercial software for drawing. In order to determine the sidebands position, the 200 peak diffraction was analyzed using a step-scan mode with a step of 0.02 degrees per step. The MA powders were encapsulated in quartz tubes with an argon gas atmosphere and subse-quently aged at 803, 898 and 1003 K for different times. The aged MA powders were also analyzed by X-ray diffraction. The MA powders were mounted on carbon-coated grits and then observed with a JEOL 2000 FX-II transmission electron microscope (TEM) at 200 kV.
3. Results and Discussion
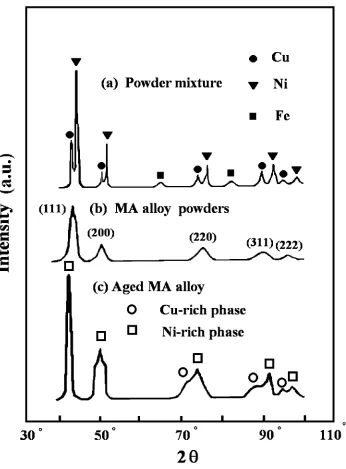
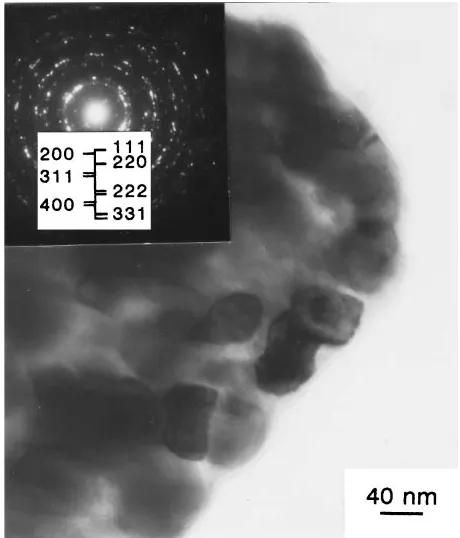
The chemical analysis of the MA powders showed the following composition 31.32 at% Cu, 45.72 at%Ni and 22.96 at% Fe. This analysis is in good agreement with the nominal composition and it suggests a minimum contami-nation from the mill and balls. Figure 1(a) shows the smoothed X-ray diffraction (XRD) pattern of the Cu-45.5 at%Ni-22.5 at%Fe powder mixture before ball milling. The main diffraction peaks correspond to pure copper and nickel. Most of the iron diffraction peaks are overlapped with those corresponding to copper and nickel. The XRD pattern of the MA Cu-45.5 at%Ni-22.5 at%Fe alloy powders is shown in Fig. 1(b). An fcc single supersaturated solid solution was formed after ball milling of 1080 ks. A mixture of two phases, Ni-rich and Cu-rich, are predicted to appear for this alloy composition in the equilibrium Cu-Ni-Fe diagram.7) This result is not surprisingly because the MA process has shown to form supersaturated solid solutions even in almost immiscible alloy systems.4)Additionally, the width of diffraction peaks, located at high 2 angles, was wider than those corresponding to the pure elements, Fig. 1(a). This behavior suggests that the MA powders have a grain size of a nanometer order. A dark field (DF)-TEM micrograph and its corresponding electron diffraction pattern for the MA Cu-45.5 at%Ni-22.5 at%Fe alloy powders are shown in Fig. 2. The mean grain size was determined to be
about 20 nm using the intercept method on enlarged TEM micrographs.9) The electron diffraction pattern shows the wide and concentric rings corresponding to a polycrystalline material. The indexing of this pattern also corresponded to an fcc crystalline structure, which confirmed the formation of a supersaturated solid solution.
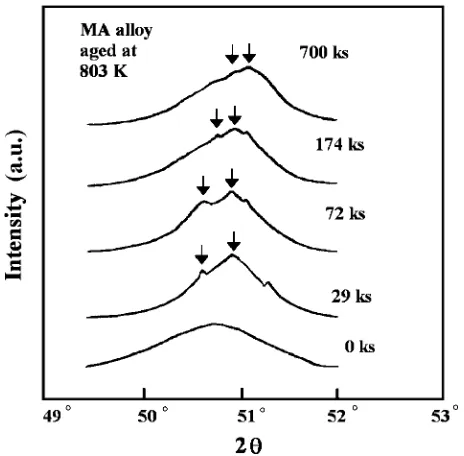
The XRD pattern of the MA alloy powders, after isothermal aging at 1003 K for 1.8 ks is shown in Fig. 1(c). The XRD peaks located at high angle2showed clearly the peaks corresponding to the Cu-rich and Ni-rich phases. That is, the phase decomposition of the supersaturated solid solution into a mixture of the Cu-rich and Ni-rich phases occurred as a result of aging. Figure 3 shows the evolution of sidebands, indicated by arrows, adjacent to the XRD 200 peak with time, after aging at 803 K. These sidebands have been observed in the spinodally-decomposed alloys.8)This fact seems to suggest that the phase decomposition took place
viathe spinodal decomposition mechanism. Bariccoet al.10) also reported the formation of an fcc supersaturated solid solution and spinodal decomposition, after aging at temper-atures between 673 and 873 K, in a rapidly-solidified Cu-20 at%Ni-Cu-20 at%Fe alloy. To determine the wavelength of modulation compositionin the decomposed MA alloy, the sidebands were analyzed using the Daniel-Lipson formula:3)
¼haotanB=ðh2þk2þl2Þ ð1Þ
Whereh,kandlare the Miller indices of the diffraction peak, B the Bragg angle,the angular separation between the Bragg peak and the sideband, and ao the lattice parameter. Since the sidebands were somewhat asymmetrical in position about the matrix peak, all wavelengths, determined with this procedure, represented an average value.
The variation of wavelength with aging time for the MA alloy aged at 803, 898 and 1003 K is shown in Fig. 4. For
[image:2.595.127.473.67.536.2]comparison, this figure also includes the corresponding results for the same composition alloy fabricated by a conventional process of melting and casting,3)named as the conventional alloy for the rest of this work. A lattice parameteraoof about 0.3598 nm was used to determine the wavelength values. The time exponent n was determined to be about 0.36, 0.27 and 0.29 in the MA powders aged at 803, 898 and 1003 K, respectively. That is, the growth kinetics of wavelength followed a time exponent of about 1/3 in both
the MA and conventional alloys. This implies that the phase decomposition is already in the coarsening stage. This type of time exponent is related to a diffusion-controlled coarsening mechanism, according to the Lifshitz-Slyozov-Wagner (LSW) theory for a diffusion-controlled coarsening proc-ess.10)The growth kinetics of wavelength for the MA alloy was very close to that of the conventional alloy for agings at 1003 K. Nevertheless, the growth kinetics of the MA alloy was slightly faster than that of the conventional alloy for agings at 898 and 803 K. This result indicated that the atomic diffusion rate was favored in the MA alloy. The high diffusivity paths, due to the high density of lattice defects such as, vacancies, dislocation and grain boundaries, might have helped to the volume diffusion at these temperatures. For instance, It has pointed out11)that grain boundaries may serve as sources of non equilibrium vacancies after the severe plastic deformation of nanocrystalline alloys. This might contribute to increase the volume diffusion process. On the other hand, the recovery process reduces the density of lattice defects at higher temperatures and their contribution to the overall atomic diffusion process. To determine the activation energy for controlled-diffusion coarsening, the growth kinetics of wavelength was fitted to the LSW theory for diffusion-controlled coarsening:12)
3o3¼kt ð2Þ
Where andoare the mean wavelengths at timet¼0and timet, respectively, andkthe rate constant. The rate constant k can be determined from the slope of the straight lines corresponding to the plot of3vs. timet. Table 1 shows the
linear-regression equations and their respective adjusted contribution ratio,R2, obtained for each temperature.
Like-wise, the temperature dependence of the rate constant k follows an Arrhenius relationship:
k¼koexpðQ=RTÞ ð3Þ
Thus, the activation energy for the growth kinetics of composition modulation can be determined from the slope of the straight lines corresponding to the plot oflnkvs.1=T,
Fig. 2 DF-TEM micrograph and its corresponding electron diffraction pattern for the MA Cu-44.5 at%Ni-22.5 at%Fe alloy powders.
Fig. 3 Evolution of sidebands with aging time for the MA Cu-44.5 at%Ni-22.5 at%Fe alloy powders.
[image:3.595.308.543.72.270.2] [image:3.595.55.286.73.350.2] [image:3.595.53.285.400.628.2]as shown in Fig. 5 for both the MA and conventional alloys. The activation energiesQwere determined to be about165 10and19510kJ mol1in the MA and conventional alloys,
respectively. The value of 195 kJ mol1for the conventional
alloy is in agreement with the activation energy for diffusion-controlled coarsening of 230 kJ mol1 determined by other
authors in an aged Cu-48 at%Ni-8 at%Fe alloy.13)Thus, the lower energy value for the MA alloy may be attributed to the enhancement of volume atomic diffusion due to the increase in non equilibrium vacancies.
The bright field (BF)-TEM micrograph and its correspond-ing electron diffraction pattern of the MA alloy powders, after aging at 898 K for 10.8 ks is shown in Fig. 6. The morphology of the decomposed phase is a cuboid shape with a separation spacing of about 30 nm between two cuboids. This spacing between the decomposed phases agrees well with the modulation wavelength determined from the XRD results for the same aging condition. Besides, this micrograph also indicates that the grain size of these samples is in the nanometric order without any excessive grain growth. The electron diffraction pattern has the diffraction rings corre-sponding to both the decomposed Cu-rich and Ni-rich phases. The cuboid morphology of the decomposed phases has been also observed in the aged Cu-Ni-Fe alloys.2)
Ramanarayan and Abinandanan14)carried out the numer-ical simulation of spinodal decomposition in a fine grained binary alloy, based on the Cahn-Hilliard and Cahn-Allen equations. They found that the spinodal decomposition kinetics for a fine grained material was faster than that corresponding to a large grained material. This fact is in good agreement with the faster decomposition kinetics observed in the aged MA Cu-Ni-Fe alloy. Furthermore, they also reported that the spinodal decomposition process was initiated with the formation of an A-rich layer at the grain boundaries. The interior of grains was filled with a B-rich phase. Besides, Bansal and Sarkar15) studied the phase decomposition in nanocrystalline Fe-Mo alloys and they found that the phase decomposition proceeded by a rapid movement and cluster-ing of the Mo atoms to the grain boundaries and subsequent formation of the Mo-rich phase. This fact also shows a good agreement with the TEM observations of the aged MA Cu-Ni-Fe alloys, Fig. 6. That is, the cuboids of the Ni-rich phase seem to be surrounded by the Cu-rich phase.
4. Conclusions
[image:4.595.311.541.72.341.2]The mechanical alloying process permitted to obtain an fcc supersaturated solid solution with a grain size of about 20 nm in the MA Cu-44.5 at%Ni-22.5 at%Fe alloy. The aging of MA powders at 803, 898 and 1003 K caused the decom-position of the supersaturated solid solution into the Cu-rich and Ni-rich phases via the spinodal decomposition mecha-nism. The growth kinetics of composition modulation wave-length followed the LSW theory for diffusion-controlled coarsening. The phase decomposition kinetics for the aged MA alloy was faster than that corresponding to the conven-tionally-processed alloy.
Table 1 Linear regression equations of3¼
o3þkt.
Aging temperature
(K)
3ðnm3Þ ¼
o3þktðksÞ R2
803 3ðnm3Þ ¼341:2þ39:0t 0.94
898 3ðnm3Þ ¼5234:9þ665:3t 0.91
1003 3ðnm3Þ ¼3067:4þ5278:3t 0.99
Fig. 5 Plot oflnkvs.1=Tfor the MA and conventional Cu-44.5 at%Ni-22.5 at%Fe alloys.
[image:4.595.48.287.83.450.2]Acknowledgements
The authors wish to the financial support from CGPI-COFAA-IPN and Fondo Sectorial para la Educacion-CON-ACYT 47151.
REFERENCES
1) E. P. Buttler and G. Thomas: Acta. Metall.18(1970) 347–365. 2) V. M. Lopez, N. Sano, T. Sakurai and K. Hirano: Acta Metall. Mater.
41(1993) 265–271.
3) M. Hillert, M. Cohen and B. L. Averbach: Acta Metall.9(1961) 536– 546.
4) J. G. Caban˜as, V. M. Lopez, H. A. Calderon and J. C. Rendon: Scripta Metall. Mater.28(1993) 645–650.
5) C. Suyanarayana: Progress Mater. Sci.46(2001) 1–184.
6) A. Yanagitani, M. Murakami and Y. Tanaka: Mater. Trans. JIM37
(1996) 1073–1077.
7) M. Hasebe and T. Nishizawa: NBS Special Publication111(1978) 476–479.
8) J. E. Hilliard:Phase Transformations(ASM International, Metals Park OH, USA, 1970) pp. 497–539.
9) H. Baker:Metals Handbook, Vol. 8, (ASM International, Metals Park OH, USA 1990) pp. 325–326.
10) M. Baricco, E. Bosco, G. Acconciaioco, P. Rizzi and M. Coisson: Mater. Sci. Eng. A375–377(2004) 1019–1023.
11) L. Gaponstev, I. K. Razumov, Yu. N. Gornostyrev, A. E. Ermakov and V. V. Kondratev: Fiz. Met. Metalloved99(2005) 365–375. 12) G. Kostorz:Phase Transformations in Materials(Wiley-VCH,
Ger-many, 2003) pp. 309–407.
13) J. Aalders and C. Van Dijk: Phys. Rev.B30(1984) 1646–1655. 14) H. Ramanarayan and T. A. Abinandanan: Bull. Mater. Sci.26(2003)
189–194.