Thermodynamic and Structural Properties for the FeO–SiO
2System
by using Molecular Dynamics Calculation
Won-Gap Seo
*and Fumitaka Tsukihashi
Department of Advanced Materials Science, Graduate School of Frontier Sciences, The University of Tokyo, Kashiwa 277-8561, Japan
Molecular dynamics (MD) simulation has been widely used as a very useful method for the calculation of thermodynamic, structural and transport properties for the molten slags and fluxes at high temperatures. In this study, MD simulation using the Born-Mayer-Huggins type pairwise potential with partial ionic charges has been used to calculate the thermodynamic, structural and transport properties for the FeO–SiO2 system. The calculated structural properties such as pair distribution functions and fractions of bonding types of oxygen (bridging, non-bridging and free oxygen) with silicon atoms in FeO–SiO2melts were in good agreement with previously measured and estimated results, and also the self-diffusion coefficients of iron, silicon and oxygen have been calculated at various temperatures and compositions. The enthalpy, entropy and Gibbs energy of mixing for the FeO–SiO2system were calculated based on the thermodynamic and structural parameters obtained from MD simulation. The phase diagram for the FeO–SiO2system estimated by calculated Gibbs energy of mixing shows good agreement with observed result in the range from pure iron to fayalite, and the liquid–liquid immiscibility region in the FeO–SiO2system has also been assessed by MD calculation.
(Received December 16, 2004; Accepted February 24, 2005; Published June 15, 2005)
Keywords: molecular dynamics, simulation, iron silicate, molten silicate structure, thermodynamics, phase diagram
1. Introduction
In recent years, the thermodynamic properties for the multiphase molten slags and fluxes are generally calculated from the computational thermodynamics modeling by using computer-based software packages such as FactSage1,2)and Thermo-Calc.3) These calculation methods require the ex-perimentally measured databases for the calculation of thermodynamic properties of multiphase systems. Therefore, the application of these methods can be limited. On the other hand, molecular dynamics (MD) simulation is to calculate the various physicochemical properties based on the dynamic quantities of individual particles in the solid and fluid simulation cells with optimized potential models and calculation algorithms without any basic database. Therefore, the thermodynamic, structural and transport properties at high temperatures, which are difficult to measure by experimental methods can be effectively estimated.
The MD calculations for silicate systems have been performed by several researchers using various potential models for the estimation of realistic structural and thermo-dynamic properties at high temperatures. Belashchenko4) reported the various structural properties of non-crystalline oxide systems by the MD calculation, and these results of calculation are in good agreement with experimentally measured results. Belonoshko et al.5,6) have successfully assessed the thermodynamic and structural properties for silica and magnesium silicates at various temperatures and pressures by using transferable pairwise interatomic potential model. Kiffer et al.7) have calculated the structural incom-patibilities and liquid–liquid phase separation in molten binary silicates with the rigid ion model. Takeiet al.8)have calculated the metastable immiscibility region in the Al2O3– SiO2 system from the thermodynamic and structural data obtained by the MD simulation. In the previous work, we also
successfully assessed the structural, transport and thermody-namic properties for BaO, CaO and CaF2 binary systems9) and CaO–SiO2 system10) by the MD calculation, and the phase diagrams for these systems were calculated based on the thermodynamic and structural parameters obtained by the MD calculation. These results of calculation show that the MD simulation is a useful method for the calculation of various physicochemical properties for the oxide and halide systems at high temperature.
In the present study, the effective potential model for the FeO–SiO2 system with optimized parameters was deter-mined. The thermodynamic, structural and transport proper-ties for FeO, Fe2SiO4 and FeO–SiO2 melts were calculated by optimized potential model, which were compared with observed results. The phase diagram for the FeO–SiO2 system, especially the liquid–liquid immiscibility region in the SiO2-rich region was estimated by the thermodynamic and structural parameters obtained from the MD calculation.
2. Molecular Dynamics Calculation
2.1 Interatomic potential
For the calculation of various physicochemical properties by using MD simulation, the interatomic potential is required to evaluate the total force on particles in system, and it is most important to obtain the exact calculation results. In this study, the interatomic potential energy was calculated by the summation of pairwise interactions between ionsiandjthat was the Busing approximation of Born-Mayer-Huggins form of eq. (1).
i jðrÞ ¼
qiqje2
ri j
þf0ðbiþbjÞexp
iþjri j
biþbj
cicj
r6
i j
ð1Þ
whereri jis the interatomic distance between ionsiandj,qiis
the valence of the ion i,e is the electron charge, f0 is the
*Graduate Student, The University of Tokyo.
standard force of 41.84 kJ nm1mol1,iandbiare repulsive
radius and softness parameter of the ion i,ciis the van der
Waals interaction parameter of the ion i, respectively. The interatomic potential terms of eq. (1) represent the Coulomb, short-range repulsion and van der Waals interactions, respectively. Three-body, high order interactions and angle-dependence terms are neglected in this study.
The interatomic potential parameters of SiO2for the FeO– SiO2system in this study were taken from potential model by Tsuneyuki et al.11) that has been derived by the ab initio Hertree–Fock self-consistent-field calculations for model clusters of silica. The effective charges for Si and O ions have been represented 2.4 and 1:2, respectively. The potential model reported by Tsuneyuki et al. has successfully reproduced the structural and dynamical properties for various silica polymorphs, glasses and molten SiO2,11–17) and the thermodynamic properties such as phase transition of quartz.18)The interatomic potential parameters for Fe–Fe and Fe–O pairs in the FeO–SiO2system were calculated by fitting the experimentally measured structural, transport and ther-modynamic properties of FeO, Fe2SiO4and FeO–SiO2melts by fixing the interatomic potential parameters of Si and O pairs for SiO2by Tsuneyukiet al.In this study, the effective charge of Fe ions for the FeO–SiO2system was determined to be 1.2, in order to maintain electroneutrality in the simulation system. The interatomic potential parameters used in this study are listed in Table 1.
2.2 Methods for calculation
The MD simulations were carried out using the isobaric and isothermal (N-p-T) ensemble. Temperature is controlled by velocity scaling method. Pressure is controlled by Parrinello and Rahmann method at atmospheric pressure. The periodic boundary conditions were employed for each simulation system. The long-range Coulomb interactions have been summated by Ewald method. The equations of motion were integrated by fifth-order Gear’s predictor-corrector algorithm using a time step of 11015s. The atomic configurations of initial cells for solid phases were taken from the respective unit cell structures. The FeO crystal structure was composed of 1000 (Fe 500 and O 500) atoms according to an array of 555 unit cells of rocksalt structure (cubic, Fm33m).19) The Fe2SiO4 crystal structure was composed of 672 (Fe 192, Si 96 and O 384) atoms according to an array of 423 unit cells of Fe2SiO4 (orthorhombic, Pbnm).20) The initial atomic configurations for liquid phases were set to be random in the cubic cell. The total number of atoms was taken to be from 1000 to 1500. The densities of initial liquid cells were adopted to be 2200 to 6000 kg/m3 based on the densities of solid FeO and silica glass at room temperature. For the calculation of FeO,
Fe2SiO4and FeO–SiO2binary systems, the cell edge lengths of each initial cell are relaxed during MD runs, however, the shape of initial cells (cell angles) is preserved by allowing the cell to change isotropically. The run durations of all simulations were 30000 time steps. In the critical points such as phase transition temperatures, the simulations were carried out using long runs up to 200000 time steps. The simulations for solid phases were started from the room temperature structures of each solid crystal and then heated to the required temperatures. The liquid phases were heated to the initial temperature of 4000 K and thermalized during the 30000 time steps in order to stabilize the highly energetic atomic configurations of initial cells, and then were cooled stepwise from 4000 to 1400 K. In this study, the effect of cooling rate on the MD calculation results of all simulation systems has been verified using cooling rate of 0.1 K per step and relevant differences were not observed. Therefore, in this study, the effect of cooling rate was to be negligible. A more detailed description about MD calculation method is given in the previous papers.9,10)All MD calculations were carried out using WinMASPHYC program (Fujitsu).
3. Results and Discussion
3.1 Structural property
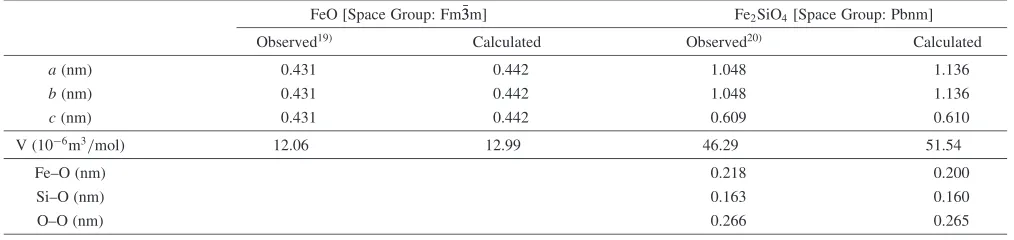
The structural stability of solid FeO and Fe2SiO4 with potential model used in this study was assessed by calculation of structural parameters such as lattice constants, molar volumes and nearest-neighbor distances between ions at 300 K. The calculated structural parameters of solid FeO and Fe2SiO4 at 300 K are reasonably well reproduced within negligible deviation with measured results19,20)as shown in Table 2.
Table 3 shows the structural parameters estimated from the pair distribution functions and running coordination numbers between ions in solid FeO just below melting point of 1650 K and molten FeO at 1700 K with measured results.21,22)The pair distribution function,g
i jðrÞ, and running
coordination number,Ni jðRÞ, of the simulated system can be
calculated by eqs. (2) and (3).
gi jðrÞ ¼
V
NiNj
X
j
hni jðrr=2;rþr=2Þi
4r2r ð2Þ
Ni jðRÞ ¼4i
ZR
0
r2gi jðrÞdr ð3Þ
where hni jðrr=2;rþr=2Þi is the average number of
ion jsurrounding ioniin a spherical shell withinrr=2, NiandNjare the total number of ionsiandj,Vis the volume
of the system,iis the partial number density of ioniandRis
the distance of the first minimum of gi jðrÞ. The calculated
nearest-neighbor distances and coordination numbers be-tween ions for solid FeO are in good agreement with measured results by Wasedaet al.21,22)In the case of molten FeO, Waseda et al. reported that the octahedral site is realistic with respect to the position of Fe2þions based on the
coordination number of Fe–O pairs, which wasnFe{O¼5:7 atoms atrFe{O¼0:205nm. However, the calculated nearest-neighbor distance and coordination number of Fe–O pairs show a difference with measured results as shown in Table 3. Table 1 Optimized interatomic potential parameters used for simulation.
q
(101nm)
b
(101nm)
c
(103kJ1=2nm3mol1=2)
Fe 1.2 1.0500 0.11500 0
Si 2.4 0.8688 0.03285 47.41
These differences are considered due to the kinetic effect by high heating rate in this study. Nevertheless, MD calculation has successfully represented the nearest-neighbor distances and coordination numbers between ions in solid FeO just below melting point and molten FeO.
Figure 1 shows the calculated pair distribution functions of Si–Si, Si–O, Fe–O and O–O in molten Fe2SiO4 at 1600 K with observed results.21) The positions of first peak of calculated pair distribution functions are rSi{Si¼0:32nm, rFe{O¼0:19nm, rSi{O¼0:16nm and rO{O¼0:265nm, which show good agreement with the nearest-neighbor distances of ion pairs measured by Wasedaet al.21)
The degrees of polymerization in FeO–SiO2 melts are assessed by the fractions of oxygen species such as bridging (O0), non-bridging (O) and free (O2) oxygen calculated as
a function of composition. The cut-off distance between Si and O ions for the calculation of oxygen species was determined by minimum position of first peak in silicon– oxygen pair distribution function, gSi{OðrÞ. Figure 2 shows the silicon–oxygen pair distribution functions calculated as a function of composition at 1873 and 3000 K. These results represent that the silicon–oxygen pair distribution functions do not have special composition and temperature depend-Table 2 Observed and calculated structural parameters for FeO and Fe2SiO4at 300 K.
FeO [Space Group: Fm33m] Fe2SiO4[Space Group: Pbnm]
Observed19Þ Calculated Observed20Þ Calculated
a(nm) 0.431 0.442 1.048 1.136
b(nm) 0.431 0.442 1.048 1.136
c(nm) 0.431 0.442 0.609 0.610
V (106m3/mol) 12.06 12.99 46.29 51.54
Fe–O (nm) 0.218 0.200
Si–O (nm) 0.163 0.160
[image:3.595.45.552.85.205.2]O–O (nm) 0.266 0.265
Table 3 Structural parameters estimated by pair distribution functions,gi jðrÞ, and running coordination numbers,Ni jðRÞ, of solid and
molten FeO with experimentally measured results. (ri j: first peak positions of pair distribution functions,ni j: coordination numbers)
Fe–Fe Fe–O O–O
r, nm n, atoms r, nm n, atoms r, nm n, atoms
Solid state just below melting point
Present work (1650 K) 0.315 13 0.200 6 0.315 12
Wasedaet al.21;22Þ 0.311 12 0.216 6 0.311 12
Molten state
Present work (1700 K) 0.320 12.5 0.185 4.2 0.320 12.0
Wasedaet al. (1673 K)21Þ 0.320 11.4 0.206 5.5 0.320 11.4
(1693 K)22Þ 0.315 11.8 0.205 5.7 0.320 12.2
0 5 10 15
0.325 0.204 0.162
Si-Si Si-O Fe-O O-O
Obs.21)
1600K
Pair distribution functions,
g ij
(
r
)
Distance, d/ nm
Molten Fe2SiO4
1.0 0.8 0.6 0.4 0.2 0.0
Fig. 1 Calculated and observed pair distribution functions in molten Fe2SiO4at 1600 K.
0 4 8 12 16 20 24
1.0 0.8 0.6 0.4 0.2
1873K 3000K
Pure SiO2
20 mol% FeO-SiO2
50 mol% FeO-SiO2
Pair distribution functions,
g Si-O
(
r
)
Distance, d / nm
FeO-SiO2
80 mol% FeO-SiO2
0.0
DCut-off: 0.235 nm
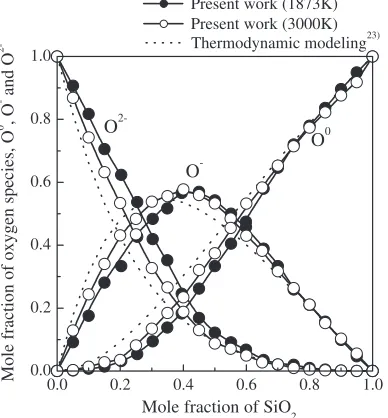
[image:3.595.44.549.255.377.2] [image:3.595.70.266.384.593.2] [image:3.595.329.525.402.597.2]ences in FeO–SiO2melts. Therefore, in this study, the cut-off distance between silicon and oxygen was determined to be 0.235 nm. Figure 3 shows the fractions of oxygen species (bridging, non-bridging and free oxygen) calculated as a function of composition at 1873 and 3000 K with the thermodynamic modeling result calculated from the equili-brium constant, eq. (5), of oxygen equiliequili-brium reaction, eq. (4), in FeO–SiO2 melts at 1873 K reported by Toop et al.23)
2O¼O0þO2 ð4Þ
K1873K¼
ðO0ÞðO2Þ
ðOÞ2 ¼0:17 ð5Þ
where (O), (O0) and (O2) are the equilibrium number of
moles of non-bridging, bridging and free oxygen per mole of system. The calculated fractions of bridging and free oxygen show the increase and decrease with the increase of SiO2 content, and the fraction of non-bridging oxygen represents the maximum value at about 40 mol% SiO2. These results are in good agreement with thermodynamic modeling result.
3.2 Transport property
The self-diffusion coefficients of iron, silicon and oxygen in FeO–SiO2 melts can be estimated by the MD simulation, which were obtained from the slopes of mean square displacements (MSD) of each ion calculated as a function of time. The mean square displacements and self-diffusion coefficients of ions can be calculated by eqs. (6) and (7), respectively.
MSD¼ hjrðtÞ rð0Þj2i ð6Þ
D¼ 1
6t hjrðtÞ rð0Þj
2i
ð7Þ
whererðtÞandrð0Þare the position of the ions at time,tand initial position of the ions at zero time, respectively,hiis the
ensemble average andDis the self-diffusion coefficient. Figure 4 shows the calculated mean square displacements of Fe, Si and O ions in molten Fe2SiO4 at 1600 K. These results show that the Fe ions diffuse more rapidly than Si and O ions in molten Fe2SiO4. Previously, various researchers have reported the self-diffusion coefficients of iron in Fe2SiO4 melt.24–27) However, the self-diffusion coefficients of Fe, Si and O ions at various compositions and temperatures in FeO–SiO2melts are limited. Figure 5 shows the calculated self-diffusion coefficients of Fe, Si and O ions as a function of temperature in molten Fe2SiO4 with observed results.24–27) The broken line in Fig. 5 is estimated by Agarwal et al.24) based on the electrical conductivity of Fe2SiO4measured by Wejnarth.27)The calculated self-diffusion coefficients of iron in molten Fe2SiO4 have a difference within one order of magnitude from measured ones. However, the self-diffusion
0.0 0.2 0.4 0.6 0.8 1.0
0.0 0.2 0.4 0.6 0.8
1.0 Thermodynamic modeling
23)
Present work (1873K) Present work (3000K)
O0
O
-Mole fraction of oxygen species, O
0 , O - and O
2-Mole fraction of SiO2
O
2-Fig. 3 Fractions of oxygen species calculated as a function of composition in FeO–SiO2 melts at 1873 and 3000 K with thermodynamic modeling result.
0 5 10 15 20 25 30
O
Si Fe
Mean square displacements, nm
2
Time, t / ps
Molten Fe
2SiO4
1600K
0.5
0.4
0.3
0.2
0.1
0.0
Fig. 4 Mean square displacements as a function of time for Fe, Si and O ions in molten Fe2SiO4at 1600 K.
4.5 5.0 5.5 6.0 6.5 7.0 7.5
-11 -10 -9 -8 -7
1/T × 104, T / K-1
2200 2000 1800 1600
Temperature, T / K
Molten Fe
2SiO4
Self diffusion coefficients, log
D
/
m
2 s
-1
Present work 1400
DFe Agarwal et al.
24)
DFe Yang et al.
25)
DFe Simnad et al.
26)
DFe Wejnarth
27)
DFe DSi DO
[image:4.595.332.524.74.263.2] [image:4.595.76.270.76.285.2] [image:4.595.332.523.544.759.2]coefficient of iron calculated in this study is in good agreement with estimated results by electrical conductivity for Fe2SiO4 of Wejnarth,27) and the apparent activation energy for diffusion of iron estimated from calculated self-diffusion coefficients, about 50 kJ/mol, is also in good agreement with results by Agarwal et al. and Wejnarth of
7310kJ/mol and about 35 kJ/mol. Figure 6 shows the self-diffusion coefficients of Fe, Si and O ions calculated as a function of composition of FeO–SiO2 melts at 1600 K. The calculated self-diffusion coefficients of each ion show the relationship ofDFe>DO>DSiand decrease with increasing SiO2 content in FeO–SiO2 melts. These results represent reasonably well the structural properties of FeO–SiO2melts, which restrict the diffusion of silicon and oxygen by the formation of silica network structure in melts.
3.3 Thermodynamic property
3.3.1 Enthalpy of pure FeO and Fe2SiO4
The enthalpies of solid and liquid FeO and Fe2SiO4 were calculated as a function of temperature. The enthalpy of simulated system can be directly calculated from the internal energy, pressure and volume obtained by MD simulation. The calculated enthalpies are compared with observed results at the sufficiently high reference temperature above the Debye temperature to neglect the quantum correction terms in this study. The Debye temperature for oxides and silicates is typically from 800 to 1200 K. The enthalpy of simulated system,HT, can be calculated by eq. (8). The internal energy, UT, which is given by eq. (9), is obtained as the sum of kinetic and potential energies calculated by the MD simu-lation. The heat capacity at constant pressure, Cp, can be calculated from the temperature dependence of enthalpy according to eq. (10).
HT¼UTþPVT ð8Þ
UT¼
X
i<j
X
i jðrÞ þ
3
2NkBT ð9Þ
Cp¼ ð@H=@TÞp ð10Þ
whereNis the number of ions of system,kBis the Boltzmann
[image:5.595.330.524.69.253.2]constant andT is the absolute temperature.
Figure 7 shows the calculated enthalpies of solid and liquid FeO with observed results28)at reference temperature of 1000 K. The calculated melting temperature and enthalpy of fusion for FeO are 167020K and 25 kJ/mol, which show good agreement with observed results of 1650 K and 24 kJ/mol. Figure 8 shows the enthalpies of solid and liquid Fe2SiO4 calculated as a function of temperature at reference temperature of 1000 K. The calculated melting temperature and enthalpy of fusion for Fe2SiO4are to be145020K and 36 kJ/mol. The calculated melting temperature is in good agreement with measured result of 1490 K.28)However, the calculated enthalpy of fusion is lower than measured results of 92 kJ/mol.28) This difference is considered due to the several reasons such as the overestimation of Coulombic energy on the ion charges, polarization of the ions, crystalline field effect of iron ions and the kinetic effect by the high heating rate. However, it is not clear yet. Nevertheless, the MD calculation has successfully represented the temperature dependence of enthalpies of solid and liquid phases, in spite
0.1 0.2 0.3 0.4 0.5
10-10 10-9 10-8
1600K
FeO-SiO2 melts
Self diffusion coefficients,
D
/ m
2 s
-1
Mole fraction of SiO2
DFe DSi DO
Fig. 6 Calculated self-diffusion coefficients of Fe, Si and O ions in FeO– SiO2melts at 1600 K.
500 1000 1500 2000 2500 3000 3500
0 40 80 120 160 200
Present work
Heated from solid FeO Cooled from liquid FeO
Observed28)
Enthalpy,
HT
-H1000K
/ kJ mol
-1
Temperature, T / K
FeO
Fig. 7 Calculated and observed enthalpies of solid and liquid FeO as a function of temperature.
800 1200 1600 2000
0 50 100 150 200 250 300 350
Cooled from liquid Fe2SiO4
Observed28) Present work
Heated from solid Fe
2SiO4
Enthalpy,
HT
-H1000K
/ kJ mol
-1
Temperature, T / K
Fe
2SiO4
[image:5.595.75.271.70.254.2] [image:5.595.329.525.310.498.2] [image:5.595.111.282.710.771.2]of the perfect crystal cells without defects such as vacancy and dislocation. Therefore, the potential model used in this study is reasonable to calculate the thermodynamic proper-ties of FeO–SiO2 system. The calculated thermodynamic properties of FeO and Fe2SiO4 are summarized in Table 4.
3.3.2 Enthalpy of mixing for the FeO–SiO2system The enthalpy of mixing for the FeO–SiO2 system can be directly calculated by MD simulation at various compositions and temperatures. The enthalpy of mixing was calculated as a difference between the enthalpy of solution at certain composition and the sum of the enthalpies of pure compo-nents according to eq. (11).
HM¼HA{B ðXAHAþXBH
BÞ ð11Þ whereHA{Bis the molar enthalpy of A and B binary solution, H
[image:6.595.47.550.84.152.2]AandHBare the standard molar enthalpies of component A and B,XAandXBare the mole fractions of component A and B, respectively.
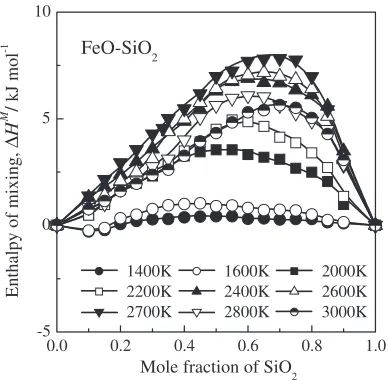
Figure 9 shows the enthalpy of mixing for the FeO–SiO2 system calculated as a function of composition at various temperatures. The enthalpy of mixing for the FeO–SiO2 system calculated by MD method shows endothermic behav-ior. This result is in good agreement with the thermodynamic modeling results calculated by Linet al.,29)Sastriet al.30)and Rey.31) The calculated enthalpy of mixing below 2000 K shows almost the same values within calculation error range of 2 kJ/mol in this study. However, the calculated enthalpy of mixing shows an abrupt positive variation in the silica-rich region from 2000 to 2700 K, and then decreases with increasing temperature. Figure 10 shows the enthalpies of
mixing for the FeO–SiO2 and CaO–SiO210) systems calcu-lated by MD simulation compared with thermodynamic modeling results estimated by previous researchers.29,30) These MD calculation results are in good agreement with thermodynamic modeling results. These results show that the MD calculation is a useful method for the calculation of enthalpies of mixing for the MO–SiO2 systems, where M¼Ca, Mn, Fe, Pb and so forth.
3.3.3 Entropy of mixing for the FeO–SiO2system For the calculation of entropy of mixing for the FeO–SiO2 system, we assumed that each Si atom in FeO–SiO2melts is associated with four oxygen ions, and Si and O atoms are randomly distributed in the tetrahedral quasi-lattice site. The entropy of mixing has been calculated by using a quasi-lattice model suggested by Linet al.29)This model is expressed by multiplicity for the random distribution of O2 ions and Si
atoms on the lattice site (1in eq. (12)) and that of bridging oxygen ions over neighboring Si–Si pair positions (2 in eq. (12)). The entropy of mixing according to1and2can be expressed as eq. (14).
1¼
ðN0ðX
SiO2þNO2ÞÞ!
ðN0XSiO 2Þ!ðN
0N O2Þ!
2¼
ðN0ðNSi{SiÞÞ!
ðN0N
O0Þ!ðN0NSi{SiN0NO0Þ!
ð12Þ
Table 4 Comparison of observed and calculated thermodynamic properties of FeO and Fe2SiO4.
FeO Fe2SiO4
Observed28Þ Calculated Observed28Þ Calculated
Melting point (K) 1650 167020 1490 145020
Enthalpy of fusion,
fusH(kJ/mol) 24 25 92 36
0.0 0.2 0.4 0.6 0.8 1.0
-5 0 5 10
1400K 1600K 2000K 2200K 2400K 2600K 2700K 2800K 3000K
Enthalpy of mixing,
∆
H
M /
kJ mol
-1
Mole fraction of SiO
2
FeO-SiO2
Fig. 9 Calculated enthalpy of mixing as a function of composition for the FeO–SiO2system at various temperatures.
0.0 0.2 0.4 0.6 0.8 1.0
-40 -30 -20 -10 0 10
Mole fraction of SiO2
Enthalp
y of mixing,
∆
H
M
/ kJ mol
-1
FeO-SiO2 Present work (1800K)
CaO-SiO2 MD calculation10) (1873K)
Lin et al.29) Sastri et al.30)
1873K CaO-SiO2 FeO-SiO2
[image:6.595.331.528.179.401.2]1588K
[image:6.595.75.269.565.755.2]NSi{Si¼
4XSiO2
2
XSiO2
XSiO2þNO2
ð13Þ
SM¼klnð12Þ ¼ R
XSiO2ln
XSiO2
XSiO2þNO2
þNO2ln
NO2 XSiO2þNO2
þNO0ln
NO0
NSi{Si
þ ðNSi{SiNO0Þln
NSi{SiNO0
NSi{Si
ð14Þ
where N0 is Avogadro’s number, X
A is a mole fraction of component A in the A–B binary system,NO2,NOandN
O0
[image:7.595.75.267.71.262.2]are the number of moles of various oxygen species per mole of solution andNSi{Siis the number of mole of neighboring Si–Si pair per mole of solution. Figure 11 shows the calculated entropy of mixing for the FeO–SiO2 system at 1873 K based on the fractions of oxygen species at each composition obtained by the MD simulation as shown in Fig. 3 with the results calculated by equilibrium constant (K1873K¼0:17) of oxygen equilibrium reaction reported by Toopet al.23)and thermodynamic modeling by Linet al.29) The calculated entropy of mixing for the FeO–SiO2system is in good agreement with thermodynamic modeling results reported by previous researchers. The entropy of mixing has been successfully assessed by the fractions of oxygen species calculated from the MD simulation.
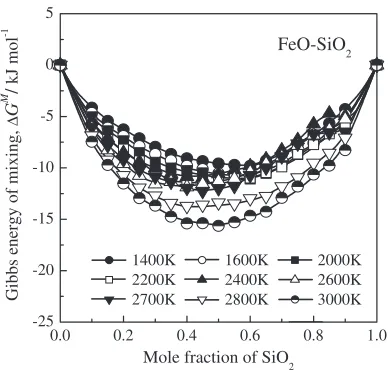
3.3.4 Gibbs energy of mixing for the FeO–SiO2system The Gibbs energy of mixing for the FeO–SiO2system was calculated from the enthalpy and entropy of mixing obtained by MD simulation. Figure 12 shows the calculated Gibbs energy of mixing as a function of composition at various temperatures for the FeO–SiO2system. The calculated Gibbs energy of mixing shows an apparent double minimum at the silica-rich region from about 2200 to 2700 K due to the effect of inflection points of enthalpy of mixing calculated by MD simulation. It is represented that the possibility of existence
of liquid–liquid immiscibility region in FeO–SiO2melts.
3.3.5 Calculation of phase diagram for the FeO–SiO2
system
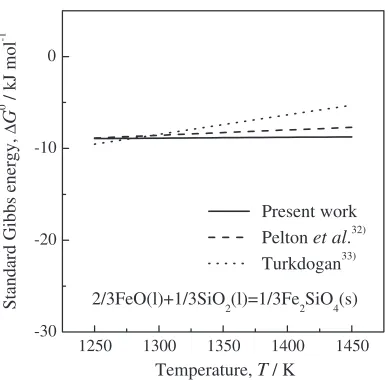
The phase diagram for the FeO–SiO2system is estimated by Gibbs energy of mixing calculated as a function of composition at various temperatures. The Gibbs energy of fusion of pure FeO for the calculation of phase diagram is calculated from the heat capacity at constant pressure based on the temperature dependence of enthalpies calculated by MD simulation. The standard Gibbs energy of formation of solid Fe2SiO4 from liquid FeO and SiO2, eq. (16), is calculated by using the Gibbs–Helmholtz equation based on the Gibbs energy of liquid mixing at the melting temperature of Fe2SiO4, eq. (15), and enthalpies of FeO, SiO2and Fe2SiO4as a function of temperature calculated by MD simulation.
2
3FeO(1)þ 1
3SiO2(1)¼
1
3Fe2SiO4(1)
G01450K¼ 8:7kJ/mol ð15Þ
2
3FeO(1)þ 1
3SiO2(1)¼
1
3Fe2SiO4(s)
[image:7.595.332.526.72.257.2]G0¼ 10100þ0:93TJ/mol ð16Þ
Figure 13 shows the calculated standard Gibbs energy of formation of solid Fe2SiO4 from liquid FeO and SiO2, eq. (16), as a function of temperature. This calculation result is in good relationship with estimated32) and observed33) results within the allowable error range for the calculation of thermodynamic properties.
Figure 14 shows the phase diagram for the FeO–SiO2 system estimated by MD calculation with observed result.34) In this study, the solid–liquid phase equilibrium in the SiO2 -rich region for the FeO–SiO2 system has not been clearly calculated. Because the potential model of Tsuneyukiet al.11) adopted for the calculation of SiO2 in this study has not exactly reproduced the thermodynamic properties such as solid phase transitions and fusion data of cristobalite. However, the calculated phase diagram is in good agreement with observed result in the range from pure iron to fayalite,
0.0 0.2 0.4 0.6 0.8 1.0
0 5 10 15
FeO-SiO
2
Present work (1873K) Ideal model Lin et al.29)
Toop et al.(K1873K=0.17)23)
Entrop
y of mixing,
∆
S
M / J mol -1 K
-1
Mole fraction of SiO2
Fig. 11 Entropy of mixing calculated by quasi-lattice structure model as a function of composition for the FeO–SiO2system with thermodynamic modeling results.
0.0 0.2 0.4 0.6 0.8 1.0
-25 -20 -15 -10 -5 0 5
1400K 1600K 2000K 2200K 2400K 2600K 2700K 2800K 3000K
Gibbs energy of mixing,
∆
G
M /
kJ mol
-1
Mole fraction of SiO2
FeO-SiO2
[image:7.595.68.293.342.469.2] [image:7.595.350.515.506.591.2]and the liquid–liquid immiscibility region in the FeO–SiO2 system has also been assessed by MD simulation.
These calculation results conclude that the MD simulation with optimized potential model is a useful method for the calculation of thermodynamic properties and the estimation of phase diagrams for the molten silicate systems at high temperature.
4. Conclusions
The thermodynamic, structural and transport properties for the FeO–SiO2 system were calculated by MD simulation using Born-Mayer-Huggins type potential model. The calcu-lated thermodynamic and structural properties of FeO and Fe2SiO4 successfully assessed the measured results. The calculated pair distribution functions and the fractions of oxygen species with silicon atoms were in good agreement with previously measured and estimated results. The self-diffusion coefficients of Fe, Si and O ions in the Fe2SiO4and
FeO–SiO2 melts at various temperatures and compositions have been estimated from MD calculation. The enthalpy and entropy of mixing for the FeO–SiO2system can be calculated by the thermodynamic parameters obtained from MD calculation and quasi-lattice model based on the calculated fraction of oxygen species. The calculated phase diagram for the FeO–SiO2system shows good agreement with observed result in the range from pure iron to fayalite, and the liquid– liquid immiscibility region in the FeO–SiO2 system has also been assessed. These calculation results show that the MD simulation can be used for the calculation of structural, transport and thermodynamic properties and the estimation of phase diagrams for the silicate systems at high temperature.
REFERENCES
1) W. Tompson:Fact, (McGill University, Montreal, Canada). 2) G. Eriksson and K. Hack: Metall. Trans. B21(1990) 1013–1023. 3) B. Sundman:Thermo-calc, (Royal Institute of Technology, Stockholm,
Sweden).
4) D. K. Belashchenko: Russ. Chem. Rev.66(1997) 733–762. 5) A. B. Belonoshko and L. S. Dubrovinsky: Geochim. Cosmochim. Acta
59(1995) 1883–1889.
6) A. B. Belonoshko and L. S. Dubrovinsky: Geochim. Cosmochim. Acta
60(1996) 1645–1656.
7) J. Kieffer and C. A. Angell: J. Chem. Phys.90(1989) 4982–4991. 8) T. Takei, Y. Kameshima, A. Yasumori and K. Okada: J. Mater. Res.15
(2000) 186–193.
9) W. G. Seo, D. H. Zhou and F. Tsukihashi: Mater. Trans.46(2005) 643– 650.
10) W. G. Seo and F. Tsukihashi: ISIJ Int.44(2004) 1817–1825. 11) S. Tsuneyuki, M. Tsukada, H. Aoki and Y. Matsui: Phys. Rev. Lett.61
(1988) 869–872.
12) S. Tsuneyuki, Y. Matsui, H. Aoki and M. Tsukada: Nature399(1989) 209–211.
13) J. R. Rustad and D. A. Yuen: Phys. Rev. A42(1990) 2081–2089. 14) R. G. Guido, D. Valla and H. C. Andersen: J. Chem. Phys.94(1991)
5056–5060.
15) J. Maddox: Nature335(1988) 201.
16) Y. Benino, K. Hirao and N. Soga: J. Non-Cryst. Solids183(1995) 22– 30.
17) J. S. Tse and D. D. Klug: J. Chem. Phys.95(1991) 9176–9185. 18) S. Tsuneyuki, M. Tsukada, H. Aoki and Y. Matsui: Phys. Rev. Lett.64
(1990) 776–779.
19) P. K. Foster and A. J. E. Welch: Trans. Faraday Soc.52(1956) 1626– 1635.
20) K. Fugino, S. Sasaki, Y. Takeuchi and R. Sadanaga: Acta Cryst. B37
(1981) 513–518.
21) Y. Waseda and J. M. Toguri: Metall. Trans. B9(1978) 595–601. 22) Y. Waseda and Y. Shiraishi: Trans. ISIJ18(1978) 783–784. 23) G. W. Toop and C. S. Samis: Trans. Metall. Soc. AIME224(1962)
878–887.
24) D. P. Agarwal and D. R. Gaskell: Metall. Trans. B6(1975) 263–267. 25) L. Yang, C. Y. Chien and G. Derge: J. Chem. Phys.30(1959) 1627. 26) M. T. Simnad, L. Yang and G. Derge: Trans. AIME206(1956) 690. 27) A. Wejnarth: Trans. Am. Electrochem. Soc.65(1934) 177–187. 28) I. Barin:Thermochemical Data of Pure Substances, (VCH, Weinheim,
1993) p. 561, 571.
29) P. L. Lin and A. D. Pelton: Metall. Trans. B10(1979) 667–675. 30) P. Sastri and A. K. Lahiri: Metall. Trans. B16(1985) 325–331. 31) M. Ray:The Physical Chemistry of Melts, (Institute of Mining and
Metallurgy, 1953) p. 63.
32) A. D. Pelton and M. Blander: Metall. Trans. B17(1986) 805–815. 33) E. T. Turkdogan:Physical Chemistry of High Temperature
Technol-ogy, (Academic Press, New York, 1980) p. 11, 20.
34) R. S. Roth:Phase Diagrams for Ceramists, Vol. XIII, (The American Ceramic Society, Inc., Ohio, 2001) p. 93 (Fig. 10363).
1250 1300 1350 1400 1450 -30
-20 -10 0
Present work
Pelton et al.32)
Turkdogan33)
Standard Gibbs energy,
∆
G
0 / kJ mol
-1
Temperature, T/ K
2/3FeO(l)+1/3SiO
[image:8.595.75.271.69.259.2]2(l)=1/3Fe2SiO4(s)
Fig. 13 Calculated and observed standard Gibbs energy of formation of solid Fe2SiO4from liquid FeO and SiO2.
0.0 0.2 0.4 0.6 0.8 1.0
1200 1600 2000 2400 2800 3200
Present work Observed34)
Temperature,
T
/ K
Mole fraction of SiO2
FeO-SiO2
Two liquids
[image:8.595.71.267.312.495.2]Fe2SiO4