Effects of Alloying Elements on the HAp Formability
on Ti Alloys after Alkali Treatment
Ken Cho
+, Mitsuo Niinomi, Masaaki Nakai, Junko Hieda and Xiaojie Tao
Institute for Materials Research, Tohoku University, Sendai 980-8577, Japan
This work presents a study on the relationship between the alloying elements such as niobium (Nb), tantalum (Ta) or zirconium (Zr) and the hydroxyapatite (HAp) formability on the surfaces of titanium (Ti) alloys subjected to alkali treatment process that is developed to form a HAp layer. The HAp formability on the surfaces of pure Ti, TiNb alloys, TiTa alloys, TiZr alloys, pure Nb, pure Ta and pure Zr subjected to alkali treatment in 1 mol/L NaOH solution at 363 K for 259.2 ks was investigated.
The pure Ti, Ti10Nb alloy and Ti10Zr alloy have a good HAp formability because sodium titanate is formed on the surface after the alkali treatment. However, the HAp formability is decreased with increasing Nb and Zr contents. A layer including sodium titanate and sodium tantalate is formed on the surfaces of TiTa alloys after the alkali treatment. Therefore, the Ti10Ta, Ti20Ta, Ti30Ta and Ti40Ta alloys have a good HAp formability. On the other hand, a sodium niobate layer and a thick crystalline sodium tantalate layer are formed on the surfaces of pure Nb and pure Ta, respectively, after the alkali treatment. Moreover, there is no component change on the surface of pure Zr after the alkali treatment. Therefore, the HAp formability on the surfaces of pure Nb, pure Ta and pure Zr is significantly low after they are soaked in a simulated bodyfluid for 1 week. [doi:10.2320/matertrans.ME201311]
(Received January 8, 2013; Accepted January 29, 2013; Published March 15, 2013)
Keywords: titanium alloy, alkali treatment, apatite (HAp)
1. Introduction
Pure titanium (Ti) and Ti alloys have been widely used for dental and orthopedic implants under load-bearing condi-tions.1,2) In biomedical applications, bone absorption and
degradation of bone quality are induced by stress shielding resulting from mismatch between Young’s moduli of living bone and implant devices.3,4) Therefore, ¢-type Ti alloys,
including Ti29Nb13Ta4.6Zr alloy (mass%, TNTZ)5)and
Ti35Nb7Zr5Ta alloy (mass%, TNZT),6) have been
developed as Ti alloys with low Young’s moduli to overcome this significant problem. Young’s modulus of TNTZ under solutionized conditions is, for example, approximately 60 GPa,5) which is much closer than those of existing Ti alloys to the value for living bons (1030 GPa).7)Therefore, these ¢-type Ti alloys are expected to be key materials for next-generation implant devices.
However, it is difficult for pure Ti and Ti alloys to directly bond to living bone after implantation.8) An essential
requirement is the formation of a bone like carbonate-apataite layer on their surface in a body.9)Therefore, various
surface modification processes such as alkali treatment10)
have been attempted to improve the bone like carbonate-apataite formability for pure Ti and Ti alloys. It is known that after immersion in NaOH solution, an alkali treatment process, bone like hydroxyapatite layer (Ca10(PO4)6OH2;
HAp) is formed on the surface of pure Ti and Ti alloys in a simulated body fluid (SBF) with ion concentrations nearly equal to those in humans.10,11)The HAp formation on these materials is attributed to a sodium titanate hydrogel layer that forms on their surfaces as a result of the alkali treatment. The mechanism for HAp formation induced by the sodium titanate can be described as follows:12)The sodium titanate
releases its Na+ ions into the surrounding fluid via an exchange with the H3O+ ions in the fluid to form TiOH
groups on its surface. These TiOH groups induce apatite nucleation. Once the apatite nuclei are formed, they grow spontaneously by consuming the calcium and phosphate ions contained in the bodyfluid.
However, the HAp formability of different types of Ti alloys with various kinds and amounts of alloying elements varies after alkali treatment. The HAp formability of TNTZ is lower than that of pure Ti,13) for example. Therefore,
to improve the HAp formability on the TNTZ surface, it is important to understand the relationship between alloying elements (Nb, Ta and Zr) and the HAp formability. In this study, the structural changes occurring on the surface of the pure Ti, TiNb alloys, TiTa alloys, TiZr alloys, pure Nb, pure Ta and pure Zr, subjected to alkali treatment were investigated. The formability of HAp on their surfaces soaked in the SBF after alkali treatment was then discussed.
2. Experimental Procedures
2.1 Material preparation
The TixM (nominal contentx=10, 20, 30, or 40 mass%; M=Nb, Ta, or Zr) alloys were produced by melting from pure Ti, pure Nb, pure Ta and pure Zr as raw materials (Ti: sponge, 99.7%purity; Nb: plate, 99.5%purity; Ta: wire, 99.5% purity; Zr: sponge, 99.6% purity) using a tri-arc melting furnace in an argon atmosphere, followed by a homogenization treatment at 1273 K for 21.6 ks with subsequent water quenching. The analyzed chemical compo-sitions of these alloys are shown in Table 1.
2.2 Alkali treatment process and soaking in SBF
Specimens of pure Ti (grade 2), pure Nb (99.5% purity), pure Ta (99.2% purity), pure Zr (99.95% purity) and TixM (x=10, 20, 30, or 40 mass%; M=Nb, Ta, or Zr) alloys measuring 10 mm in diameter and 1 mm in thickness were wet-polished using SiC waterproof emery papers of up to
#600 grit. After polishing, these specimens were immersed in
+Corresponding author, E-mail: k_cho@imr.tohoku.ac.jp
Special Issue on New Functions and Properties of Engineering Materials Created by Designing and Processing II
1 mol/L NaOH solution at 363 K for 259.2 ks as an alkali treatment. The specimens subjected to the alkali treatments were then soaked in 20 mL of an acellular SBF, with ion concentrations (Na+: 142.0 mM; K+: 5.0 mM; Mg2+: 1.5 mM; Ca2+: 2.5 mM; Cl¹: 147.8 mM; HCO¹3: 4.2 mM; HPO2¹4: 1.0 mM; SO2¹4: 0.5 mM) nearly equal to those of
human blood plasma at 309.5 K for 1 week to evaluate their HAp formability. The SBF was prepared by dissolving reagent-grade NaCl, NaHCO3, KCl, K2HPO4·3H2O, MgCl2·
6H2O, HCl, CaCl2 and Na2SO4 in distilled water and
buffered at a pH value of 7.40 with tris-hydroxymethyl aminomethane ((CH2OH)3CNH3) and hydrochloric acid at
309.5 K.14)After the specimens had been soaked for 1 week,
they were removed from the SBF, washed with distilled water, and dried in air.
2.3 Surface analysis
The structural changes occurring on the surface of the specimens after the alkali treatment and subsequent SBF soaking were investigated using a scanning electron mi-croscopy (SEM) and a thin-film X-ray diffractometry (TF-XRD). The TF-XRD analysis was carried out using a Cu target with an accelerating voltage of 40 kV and a tube current of 150 mA. The peak assignment were performed using the international centre for diffraction data (ICDD) database.15)
3. Results
3.1 Surface morphology and phase constitutions after alkali treatment
Figure 1 shows the SEM image of the surface of pure Ti subjected to alkali treatment in 1 mol/L NaOH solution at 363 K for 259.2 ks. Traces of grinding were still visible on the sample surface. Figure 2 shows the TF-XRD profile of the surface of pure Ti subjected to alkali treatment under the same conditions. Diffraction peaks of Ti and Na2Ti5O11 are
detected from the pure Ti surface.
The SEM images of surfaces of the (a) TixNb (nominal contentx=10, 20, 30, or 40 mass%) alloys and pure Nb, (b) TixTa alloys and pure Ta and (c) TixZr alloys and pure Zr subjected to alkali treatment under the above conditions are
shown in Fig. 3. As shown in Fig. 3, for Ti10Nb, Ti20Nb, Ti30Nb alloys, Ti10Ta, Ti20Ta and Ti30Ta alloys, the surface still preserve the grinding trace (Figs. 3 (a, 1), (a, 2), (a, 3), (b, 1), (b, 2) and (b, 3)), which is similar with the surface of pure Ti subjected to the alkali treatment. Moreover, many microcracks are observed on the surface of the Ti10Zr and Ti20Zr alloys (Figs. 3 (c, 1) and (c, 2)). For the surface of Ti30Zr alloy, the microcracks became smaller or disappear (Fig. 3 (c, 3)). On the other hand, many clear microcracks are formed on the surfaces of the Ti40Nb alloy and pure Nb, (Figs. 3 (a, 4) and (a, 5)). The Ti40Ta alloy surface retains traces of grinding (Fig. 3 (b, 4)) while there are clear microcracks in the surface of pure Ta (Fig. 3 (b, 5)). The surfaces of the Ti40Zr alloy and pure Zr are smoother than those of the Ti10Zr, Ti20Zr and Ti30Zr alloys (Figs. 3 (c, 4) and (c, 5)).
The TF-XRD profiles of the (a) Ti10M (M=Nb, Ta, or Zr), (b) Ti20M, (c) Ti30M and (d) Ti40M alloys are shown in Fig. 4. The component of the surfaces of the Ti 10Nb, Ti20Nb, Ti10Zr and Ti20Zr alloys subjected to the alkali treatment is Na2Ti5O11as shown in Figs. 4(a) and 4(b).
Likewise, Na5TaO514) is formed on the surfaces of the Ti
10Ta and Ti20Ta alloys. The components of the surfaces of the Ti30Nb and Ti40Nb alloys subjected to the alkali treatment are Na2Ti5O11 and TiNb as shown in Figs. 4(c)
[image:2.595.319.533.68.231.2]and 4(d). The surfaces of the Ti30Ta and Ti40Ta alloys
Table 1 Chemical compositions of TixNb, TixTa and TixZr alloys.
Alloy Alloying element content (mass%) Oxygen (mass%)
Nb Ta Zr
Ti10Nb 9.88 <0.08
Ti20Nb 19.5 <0.08
Ti30Nb 29.7 <0.08
Ti40Nb 39.6 <0.08
Ti10Ta 9.88 <0.08
Ti20Ta 19.7 <0.08
Ti30Ta 29.7 <0.08
Ti40Ta 40.0 <0.08
Ti10Zr 10.0 <0.08
Ti20Zr 19.8 <0.08
Ti30Zr 30.0 <0.08
Ti40Zr 40.1 <0.08
30
μ
m
Fig. 1 SEM image of pure Ti subjected to alkali treatment in 1 mol/L NaOH solution at 363 K for 259.2 ks.
20 25 30 35 40 45 50 55 60
Intensity (a.u.)
Diffraction angle 2
θ
/ degreePure Ti Ti
Na2Ti5O11
(100)
(002)
(101)
(102)
(110)
(310)
(0
20)
[image:2.595.46.291.83.258.2] [image:2.595.322.534.282.428.2]subjected to the alkali treatment are mainly composed of Na5TaO5 and Na2Ti5O11. The surfaces of the Ti30Zr and
Ti40Zr alloys subjected to the alkali treatment are mainly composed of Na2Ti5O11. The components of the surfaces of
pure Nb and pure Ta subjected to the alkali treatment are Na8Nb6O19 and Na5TaO5, respectively, while there is no
component change on the smooth surface of pure Zr subjected to the alkali treatment as shown in Fig. 4(e). These SEM images and TF-XRD profiles suggest that the clear microcracks observed on the surfaces of Ti40Nb, pure Nb and pure Ta correspond to a thick layer of sodium titanate, sodium niobate and sodium tantalate, respectively.
3.2 HAp precipitation in SBF
Figure 5 shows an SEM image of the surface of pure Ti soaked in the SBF for 1 week after the alkali treatment in 1 mol/L NaOH solution at 363 K for 259.2 ks. The pure Ti surface is completely covered by HAp, suggesting that soaking the specimen in the SBF for 1 week after the alkali
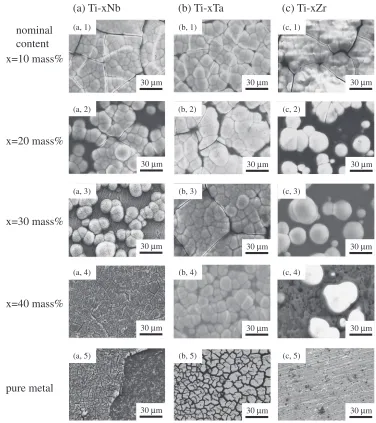
treatment is sufficient to initiate formation of HAp on the surface of pure Ti. This is evidence of good HAp formability. The SEM images of surface of the (a) TixNb (nominal content x=10, 20, 30, or 40 mass%) alloys and pure Nb, (b) TixTa alloys and pure Ta and (c) TixZr alloys and pure Zr soaked in the SBF for 1 week after the alkali treatment under the above conditions are shown in Fig. 6. The TF-XRD profiles of surfaces of the (a) TixNb (nominal content
x=10, 20, 30, or 40 mass%), (b) TixTa and (c) TixZr alloys soaked in the SBF for 1 week after the alkali treatment at above condition are shown in Fig. 7.
As shown in Figs. 6 (a, 1), (b, 1) and (c, 1) the HAp completely covers the surfaces of the Ti10Nb, Ti10Ta and Ti10Zr alloys after soaking in the SBF. Two typical diffraction peaks, which are corresponded to HAp, are observed in the TF-XRD profiles of the surfaces of the Ti 10Nb, Ti10Ta and Ti10Zr alloys (Figs. 7 (a, 1), (b, 1) and (c, 1)). The HAp formability of the TiNb and TiZr alloys is decreased as the Nb and Zr content is increased from 10 to
30 μm
30 μm
30 μm
30 μm
30 μm
30 μm
30 μm
30 μm
30 μm
30 μm
30 μm
30 μm
30 μm
30 μm
30 μm (a, 1)
(a, 2)
(a, 3)
(a, 4)
(a, 5)
(b, 1)
(b, 2)
(b, 3)
(b, 4)
(b, 5)
(c, 1)
(c, 2)
(c, 3)
(c, 4)
(c, 5)
(a) Ti-xNb
(b) Ti-xTa
(c) Ti-xZr
x=10 mass%
x=20 mass%
x=30 mass%
x=40 mass%
pure metal
nominal
content
[image:3.595.106.486.69.491.2]100 mass%(pure metals). As shown in Figs. 6 (a, 3), (c, 3) and (c, 4), isolated HAp is formed on the surfaces of the Ti 30Nb, Ti30Zr and Ti40Zr alloys after soaking in the SBF. Although the two typical diffraction peaks of HAp can still be observed in the TF-XRD profiles (Figs. 7 (c, 3) and (c, 4)) of the surfaces of the Ti30Zr and Ti40Zr alloys, they are not detected on the surface of the Ti30Nb alloy. These results indicate that the particle size of isolated HAp formed on the Ti30Nb alloy surface is smaller than that on the surfaces of Ti30Zr and Ti40Zr alloys. In addition, there is no HAp on the surfaces of the Ti40Nb alloy, pure Nb and pure Zr (Figs. 6 (a, 4), (a, 5) and (c, 5)). On the other hand, the HAp formability of TiTa alloys is almost constant with
increasing Ta content from 10 to 40 mass% (Figs. 6 (b, 2), (b, 3) and (b, 4)) and the two typical HAp diffraction peaks are observable on the surfaces of the Ti20Ta, Ti30Ta and Ti40Ta alloys. However, there is no HAp on the surface of pure Ta (Fig. 6 (c, 5)). These results suggest that the TiTa alloys have better HAp formability as compared with the cases in the TiNb and TiZr alloys.
4. Discussion
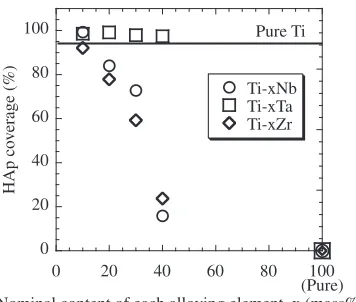
Figure 8 shows the variation in HAp coverage on the surfaces of the TixM (nominal content x=10, 20, 30, or 40 mass%; M=Nb, Ta, or Zr) alloys and each pure metal as
Intensity (a.u.)
Diffraction angle 2θθ / degree (a, 1) Ti-10Nb
(a, 2) Ti-10Ta (a, 3) Ti-10Zr
Intensity (a.u.)
Diffraction angle 2θ / degree (e, 1) Pure Nb
(e, 2) Pure Ta (e, 3) Pure Zr
Intensity (a.u.)
Diffraction angle 2θ / degree (c, 1) Ti-30Nb
(c, 2) Ti-30Ta (c, 3) Ti-30Zr
(c) Ti-30M
Intensity (a.u.)
Diffraction angle 2θ / degree (b, 1) Ti-20Nb
(b, 2) Ti-20Ta (b, 3) Ti-20Zr
(b) Ti-20M
Unknown (a) Ti-10M
Ti Na2Ti5O11
Na5TaO5
20 25 30 35 40 45 50 55 60
Intensity (a.u.)
Diffraction angle 2θ / degree (d, 1) Ti-40Nb
(d, 2) Ti-40Ta (d, 3) Ti-40Zr
(d) Ti-40M
(e) Pure metal
(002)
(101)
(100) (102) (002)
(101)
(100)
(102)
(002)
(101)
(100) (102)
(101)
(002)
(102)
(100) (110)
(110) (200)
(200)
(200)
(020)
(310)
(110) (110) (310) (020)
(020)
(310)
(110)
(113)
(020)
(132)
(221)
(002) (101)
(102)
(002)
(101)
(100) (102)
(110)
Ti Na2Ti5O11
Na5TaO5
(102)
(020)
(002) (101)
(100)
(310) (130)
(113)
(102)
(002) (101)
(100)
(110)
Ti Na2Ti5O11
Na5TaO5
Nb
(002) (101)
(100) (020) (102) (310) (130)
(020)
(002) (101)
(100)
(310)
(101)
(101)
(002)
(100)
(130)
(310)
(101)
(002)
(312)
Ti Na2Ti5O11
Na5TaO5
Nb
(201)
Ti Na2Ti5O11
Na5TaO5
Na8Nb6O19
(301)
(030)
(113) (130) (221) (132)
(204)
(313) (151) (311) (062) (226)
(225)
20 25 30 35 40 45 50 55 60
20 25 30 35 40 45 50 55 60 20 25 30 35 40 45 50 55 60
20 25 30 35 40 45 50 55 60
[image:4.595.137.460.66.566.2]a function of the alloying elements content after soaking in the SBF for 1 week through the alkali treatment in 1 mol/L NaOH solution at 363 K for 259.2 ks as a function of the alloying elements content. The HAp coverage on the surfaces of the Ti10Ta, Ti20Ta, Ti30Ta and Ti40Ta alloys is almost constant at around 95%while it is decreased from 90 95%to 0% on the surfaces of the TixNb and TixZr alloys as the Nb and Zr content increase from 10 to 100 mass% (pure metals).
Pure Ti and Ti alloys have been known to form sodium titanate layers on their surfaces after an alkali treatment. The sodium titanate releases Na+ions from the surface gel layer into the SBF via an ion exchange with H3O+ions present in
the SBF. As a result, the HAp produced from the ionic activity in the surrounding SBF is increased by an increase in OH¹ion concentration. The increased ionic activity products accelerate apatite nucleation on the TiOH groups, which could explain the good HAp formability of pure Ti after alkali treatment.
30
μ
m
Fig. 5 SEM image of pure Ti soaked in SBF for 1 week after subjecting to alkali treatment in 1 mol/L NaOH solution at 363 K for 259.2 ks.
30 μm
30 μm
30 μm
30 μm
30 μm
30 μm
30 μm
30 μm
30 μm
30 μm
30 μm
30 μm
30 μm
30 μm
30 μm (a, 1)
(a, 2)
(a, 3)
(a, 4)
(a, 5)
(b, 1)
(b, 2)
(b, 3)
(b, 4)
(b, 5)
(c, 1)
(c, 2)
(c, 3)
(c, 4)
(c, 5)
(a) Ti-xNb
(b) Ti-xTa
(c) Ti-xZr
x=10 mass%
x=20 mass%
x=30 mass%
x=40 mass%
pure metal
nominal
content
[image:5.595.63.277.69.231.2] [image:5.595.108.484.320.743.2]On the basis of a similar mechanism for TiTa alloys after alkali treatment, the surface sodium tantalate layers would be responsible for their HAp formability as a result of the many TaOH groups formed on the surface. When sodium tantalate is in a crystalline phase on the surface, it barely releases the Na+ions, leading to the formation of only a small number of
TaOH groups on the surface and low production of HAp from ionic activity in the SBF. However, the sodium tantalate layers should be in the amorphous state,13)suggesting that the TixTa (x=10, 20, 30, or 40 mass%) alloys should have good HAp formability. For pure Ta, the clear and sharp peaks of Na5TaO5in the TF-XRD profile (Fig. 4 (e, 2)) indicate that
the thick crystalline sodium tantalate layer is formed on the surface after the alkali treatment, leading to significantly decreasing of HAp formability.
For the TiNb and TiZr alloys, the alloys showed good HAp formability when the Nb and Zr contents are lower than 10 mass% because there are enough sodium titanate mole-cules on the surfaces. However, when the Nb or Zr content is increased to 20 mass%, these alloys show low HAp formability. The number of Ti atoms on the surfaces should be decreased with increasing Nb or Zr content. Therefore, the sodium titanate on the surfaces is decreased accordingly and accounts for the low HAp formability of the Ti20Nb, Ti30Nb, Ti40Nb, Ti20Zr, Ti30Zr and Ti10Zr alloys.
For pure Nb and pure Zr, the HAp is not formed on the surfaces after soaking in the SBF through the alkali treatment. As shown in Fig. 4 (e, 1), the sodium niobate layer is formed on the surface of pure Nb. Akahori et al.12) have reported
that sodium niobate delays the ion exchange between Na+ and H3O+. This report suggests that it is difficult to form
NbOH groups on the surface through ion exchange in this
Intensity (a.u.)
Diffraction angle 2θθ / degree (b, 1) Ti-10Ta (b, 2)Ti-20Ta (b, 3) Ti-30Ta (b, 4) Ti-40Ta
(b) Ti-xTa
Unknown
Intensity (a.u.)
Diffraction angle 2θ / degree (c, 1) Ti-10Zr (c, 2)Ti-20Zr (c, 3) Ti-30Zr (c, 4) Ti-40Zr
(c) Ti-xZr
20 25 30 35 40 45 50 55 60 20 25 30 35 40 45 50 55 60 20 25 30 35 40 45 50 55 60
Intensity (a.u.)
Diffraction angle 2θ / degree (a, 1) Ti-10Nb (a, 2)Ti-20Nb (a, 3) Ti-30Nb (a, 4) Ti-40Nb
(a) Ti-xNb
(002) (101)
(101)
(002)
(200)
(102)
(002) (300)
(300)
(002)
(101)
(002)
(001)
(102)
(102)
(002) (300)
(020)
(020)
(110) (312)
(020)
(310)
(002)
(101)
(310)
(002) (300) (310) (002) (101)
(101)
(102)
(102)
(020)
Ti Na2Ti5O11
Nb HAp
(300) (001) (002) (101)
(225)
Ti Na2Ti5O11
Na2TaO5 HAp
Ti Na2Ti5O11
HAp
(102)
(002) (300) (002) (101)
(020)
(002) (300)
(002)
(101)
(020)
(002) (300) (002) (101)
(102)
(102)
(020)
(102)
(020)
(101)
(002)
(002) (300)
(002)
(300)
(310)
(002) (101)
Fig. 7 TF-XRD profiles of TixM (nominal contentx=10, 20, 30, or 40 mass%; M=Nb, Ta, or Zr) alloys soaked in SBF for 1 week through alkali treatment in 1 mol/L NaOH solution at 363 K for 259.2 ks: (a) TixNb, (b) TixTa and (c) TixZr; (a, 1) Ti10Nb, (a, 2) Ti20Nb, (a, 3) Ti30Nb, (a, 4) Ti40Nb, (b, 1) Ti10Ta, (b, 2) Ti20Ta, (b, 3) Ti30Ta, (b, 4) Ti40Ta, (c, 1) Ti10Zr, (c, 2) Ti20Zr, (c, 3) Ti30Zr and (c, 4) Ti40Zr.
0 20 40 60 80 100
0 20 40 60 80 100
Ti-xNb Ti-xTa Ti-xZr
HAp co
v
erage (%)
Nominal content of each alloying element, x (mass%) (Pure) Pure Ti
[image:6.595.136.456.65.408.2] [image:6.595.79.257.478.629.2]study. Therefore, the HAp formability of pure Nb is significantly low. Uchida et al.16) have reported that pure
Zr could form an apatite on its surface in SBF when it had been previously treated by NaOH solution with a concen-tration above 5 mol/L at 368 K for 86.4 ks, although it did not completely cover the surface. In this study, the low HAp formability of the pure Zr subjected to alkali treatment in 1 mol/L NaOH solution at 363 K for 259.2 ks is attributed to the lack of Na+ ions on the surface. Since pure Zr has higher corrosion durability in NaOH solution as compared with the cases in pure Ti, pure Nb and pure Ta, a thin Na-free zirconia hydrogel layer is formed merely on its surface, where formation of the OH¹ anion species is assumed to rarely occur.
5. Conclusions
(1) Sodium titanate is formed on the surface of pure Ti after alkali treatment in 1 M NaOH solution at 363 K for 259.2 ks. The HAp coverage on the surface of the pure Ti is around 95%after it is soaked in the SBF for 1 week.
(2) A sodium titanate layer is formed on TiNb and TiZr alloys after alkali treatment in 1 M NaOH solution at 363 K for 259.2 ks. The HAp coverage on the surfaces of the Ti10Nb and Ti10Zr alloys is around 95%after they are soaked in the SBF. However, the HAp form-ability is decreased with increasing Nb and Zr content. (3) A layer including sodium titanate and sodium tantalate is formed on the surfaces of TiTa alloys after alkali treatment in 1 mol/L NaOH solution at 363 K for 259.2 ks. The HAp coverage on the surfaces of the Ti 10Ta, Ti20Ta, Ti30Ta and Ti40Ta alloys is almost constant at around 95%after they are soaked in the SBF for 1 week.
(4) A sodium niobate layer is formed on the surface of pure Nb after alkali treatment in 1 M NaOH solution at 363 K for 259.2 ks. A thick crystalline sodium tantalate layer is formed on the surface of pure Ta and there is no component change on the surface of pure Zr after both metals underwent the same alkali treatment. The HAp coverage on the surface of pure Nb, pure Ta and pure
Zr is almost 0% after they are soaked in the SBF for 1 week.
Acknowledgments
This study was supported in part by a Grant-in-Aid for Scientific Research (A) 24246111 from the Japan Society for the Promotion of Science (JSPS). It was also supported by the inter-university cooperative research program “Innovation Research for Biosis-Abiosis Intelligent Interface” from the Ministry of Education, Culture, Sports, Science and Tech-nology, Japan.
REFERENCES
1) M. Semlitsch:Clin. Mater.2(1987) 113.
2) F. B. Christensen, M. Dalstra, F. Sejling, S. Overgaard and C. Bünger: Eur. Spine J.9(2000) 97103.
3) R. Huiskes, H. Weinans and B. van Rietberge: Clin. Orthop. Relat. Res. 274(1992) 124134.
4) Y. Noyama, T. Miura, T. Ishimoto, T. Itaya, M. Niinomi and T. Nakano: Mater. Trans.53(2012) 565570.
5) D. Kuroda, M. Niinomi, M. Morinaga, Y. Kato and T. Yashiro:Mater. Sci. Eng. A243(1998) 244249.
6) T. Ahmed, M. Long, J. Slivestri, C. Ruiz and H. J. Rack:Titanium’95: Science and Technology, ed. by P. A. Blenkinsop, W. J. Evans and H. M. Flower, (Institute of Metals, London, 1996) Vol. II, pp. 1760 1767.
7) J. A. Davidson and F. S. Gergette: Proc. Implant Manufacturing and Material Technology, (Soc. Manufact. Eng.Em871221986) pp. 122 126.
8) B. D. Ratner, A. S. Hoffman, F. J. Schoen and J. E. Lemons: Biomaterials Science, (CA: Academic Press, San Diego, 1996). 9) T. Kokubo:Biomaterials12(1991) 155163.
10) T. Kokubo, F. Miyaji, H. M. Kim and T. Nakamura:J. Am. Ceram. Soc. 79(1996) 11271129.
11) H. M. Kim, F. Miyaji, T. Kokubo and T. Nakamura:J. Biomed. Mater. Res.32(1996) 409417.
12) X. Y. Liu, P. K. Chu and C. X. Ding: Mater. Sci. Eng.47R(2004) 49121.
13) T. Akahori, M. Niinomi, M. Nakai, H. Fukuda, H. Fukui and M. Ogawa:Mater. Trans.48(2007) 293300.
14) T. Kokubo and H. Takadama:Biomaterials27(2006) 29072915. 15) International Centre for Diffraction Data-Reference Code, 00-011-0289
(Na2Ti5O11), 00-040-0808 (Na5TaO5), 00-014-0370 (Na8Nb6O19). 16) M. Uchida, H. M. Kim, F. Miyaji, T. Kokubo and T. Nakamura: