Dynamic Impact Response of Inconel 718 Alloy
under Low and High Temperatures
Woei-Shyan Lee
1;*, Chi-Feng Lin
2, Tao-Hsing Chen
3and Hong-Wei Chen
11Department of Mechanical Engineering, National Cheng Kung University, Tainan 701, Taiwan, R. O. China
2National Center for High-Performance Computing, Hsin-Shi Tainan County 744, Taiwan, R. O. China
3Department of Mechanical Engineering, National Kaohsiung University of Applied Sciences, Kaohsiung 807, Taiwan, R. O. China
Dynamic impact response of Inconel 718 alloy is studied at temperatures ranging from150to 550C and strain rates in the range of 1000
to 5000 s1using a compressive split Hopkinson pressure bar. It is found that the flow stress increases with increasing strain rate, but decreases with increasing temperature. The highest work hardening rate is observed in the specimen at the lowest temperature (150C) and the highest
strain rate (5000 s1). However, the work hardening rate is weakened by the deformation-induced temperature rise under high strain and strain rate conditions. The strain rate sensitivity increases with increasing strain rate, but decreases with increasing temperature. The activation energy varies as a function of the strain rate and temperature, and has a maximum value of 40 kJ/mol. The greatest thermal softening effect occurs at the highest strain rate of 5000 s1and temperatures in the range15025C. The microstructural observations confirm that the mechanical
response of the Inconel 718 specimens is directly related to the effects of the strain rate and temperature on the evolution of the impacted microstructure. [doi:10.2320/matertrans.M2011130]
(Received May 2, 2011; Accepted June 22, 2011; Published August 25, 2011)
Keywords: Inconel 718, impact deformation, strain rate effect, temperature sensitivity
1. Introduction
Inconel 718 is one of the most widely used nickel-based superalloys in critical applications such as aerospace components, gas turbine engines, cryogenic storage tanks, pollution control equipment, and so on. The quasi-static loading rate response of Inconel 718 has been extensively examined.1–3)However, the effects of temperature and high strain rates on the mechanical response of Inconel 718 are less well understood. In practice, the deformation mode of Inconel 718 is critically dependent upon the temperature and strain rate conditions. Thus, in designing robust Inconel 718 structures and components, it is essential that the dynamic plastic deformation behaviour of Inconel 718 is understood over a wide range of temperatures and strain rates.
The mechanical properties of structural materials under high loading rates are commonly evaluated using the split Hopkinson pressure bar (SHPB).4–8) In general, the results show that, to a greater or lesser extent, most non-metallic and composite materials exhibit a significant change in mechan-ical properties when deformed under different strain rates and temperatures. Several mechanisms have been proposed to account for the change in mechanical properties prompted by high velocity deformation, including dislocation damping,9) thermally-activated mechanisms,10) and so on. However, to obtain a broader understanding of the effects of the deformation temperature and strain rate on the mechanical response of engineering materials, a comprehensive temper-ature-dependent analysis is required.11,12)
Various studies have shown that the strain rate and temperature dependence of the flow stress in materials such as copper and titanium alloy can be directly attributed to the evolution of the microstructure during deformation.13,14) Accordingly, in the present study, a compressive SHPB
system is used to impact cylindrical Inconel 718 specimens dynamically at temperatures ranging from 150 to 550C and strain rates in the range 1000 to 5000 s1. The micro-structures of the impacted specimens are observed using optical microscopy (OM). The differing mechanical respons-es of the specimens impacted under different temperaturrespons-es and strain rates are then explained in terms of the differences in the corresponding impacted microstructures. Therefore, the present study provides brand-new detailed dynamic deformation and microstructure data under both low and high temperatures for the Inconel 718 alloy in real-world applications. Typical applications include and are not limited to high speed machining, forging and forming processes, aerospace components, gas turbine, cryogenic storage tanks pollution control equipment, and so on.
2. Experimental Procedure
Inconel 718 (AISI A2 Grade) bars with a composition of 18.29% Cr, 18.23% Fe, 4.8% Nb, 5.15% Mo, 0.97% Ti, 0.54% Al, 0.12% Co, 0.078% Si, 0.065% Mn, 0.065% Cu, 0.051% C, 0.028% W, and a balance of Ni (mass) were purchased from Gloria Material Technology Corp., Taiwan, R.O.C. The starting material was received in the form of hot-rolled bars with a diameter of 13 mm. These bars were heat treated using the standard commercial procedure, i.e. solution treated at 1050C for one hour, air cooled (AC), and then aged at 775C, 8 h, AC. The heat treated bars were machined into cylindrical specimens with a length and diameter of 9.7 mm. The ends of each specimen were then carefully finished using a grinder to ensure a close contact with the incident and transmitter bars of the SHPB apparatus during the impact tests.
The specimens were deformed at temperatures of150C, 25C, 300C and 550C under strain rates ranging from 1000 to 5000 s1. (Note that a full description of the SHPB system *Corresponding author, E-mail: [email protected]
and test procedure is provided in Ref. 4), and thus the details are omitted here.) The low test temperature of150C was obtained by fitting a refrigeration system filled with liquid nitrogen and oxygen around the specimen. Meanwhile, the elevated test temperatures of 300C and 550C, respectively, were obtained by enclosing the specimens in a clamshell radiant-heating furnace with an internal diameter of 25 mm and a heating element of length 300 mm. Prior to each test, the specimen and the two ends of the pressure bars holding the specimen were maintained at the specified test ature for approximately 10 min to ensure a uniform temper-ature distribution at the specimen/pressure bar interface. The resulting temperature gradients induced along the lengths of the two pressure bars affect both the elastic modulus of the bars and the propagation velocity of the incident, reflected and transmitted pressure pulses. Accordingly, the original equations used to compute the strain, strain rate and stress in the deformed specimens3)were modified to the forms shown by Chiddister and Malvern in15)and the current authors in.16) The impacted specimens were mounted in epoxy resin and were then ground progressively using a series of abrasive papers with grit sizes ranging from 180 to 1200-mesh. The ground specimens were polished with a micro-cloth dipped in a slurry of 0.3mmalumina, and were then etched in a solution of 10 parts HCl and 3 parts H2O2for approximately 4 s. The surface morphologies of the impacted specimens were then observed using OM. The grain size of each specimen was evaluated using a linear intercept method in accordance with the procedure laid down in ASTM E-112 based on a minimum of ten micrographs for each specimen. In addition, the local deformation area of each specimen was measured using a Quantimet 500 image analysis software package. In obtaining the measurements, ten micrographs were obtained for each specimen using a scanning electron microscope at a magnification of3500. The micrographs were then magni-fied by a factor of approximately3and transferred to the image analysis system for further processing. All of the measurements were carried out on the transverse face of the specimens following a standard polishing treatment.
3. Results and Discussions
3.1 Stress-strain curves
Figure 1 shows the stress-strain curves of the impacted Inconel 718 specimens. It can be seen that the mechanical behaviour of the specimens is significantly dependent on both the strain rate and the temperature. Specifically, the flow stress increases with increasing strain rate, but decreases with increasing temperature. Furthermore for each test condition, the flow stress increases quickly at the onset of dynamic plastic deformation, but increases more slowly at larger strains. None of the specimens fracture under the considered test conditions. Thus, it is implied that Inconel 718 has good ductility and strengthening properties over a wide range of temperatures and strain rates. In dynamic impact tests such as those performed in this study, the heat generated by the plastic work done during deformation has insufficient time to dissipate, and thus the temperature of the specimen
increas-es.17,18) Consequently, the specimen experiences a thermal
softening effect. This softening effect is revealed in the
stress-strain curves in Fig. 1 by the difference in the flow stress and work-hardening rate observed under different loading conditions. In practice, it is difficult to measure the deformation-induced temperature rise (T) directly during high speed loading. Thus,Tis generally calculated via the integral equation T ¼1=ðC pÞR0"d", where is the density (8.19 g/cm3);C pis the heat capacity (435 J/(kgK);
is the stress, andd"is the strain interval. Figure 2 shows the variation of the temperature rise with the true strain as a function of the strain rate and temperature. It is seen that the temperature rise increases with an increasing strain rate and a decreasing temperature. Thus, the maximum thermal soften-ing effect occurs in the specimen tested under the highest strain rate (5000 s1) and the lowest temperature (150C). Comparing the slopes of the various stress-strain curves in Fig. 1, it can be seen that the work hardening rate (@=@") is dependent on the strain, strain rate and temperature. Figure 3 presents the variation of the work hardening rate with the
0
True Strain,
ε
T0 400 800 1200 1600 2000
T
rue Str
ess,
σσT
/MP
a
-150 °C 25 °C 300 °C 550 °C 1000 s-1
3000 s-1
5000 s-1
0.5 0.4
0.3 0.2
0.1
Fig. 1 Stress-strain curves of Inconel 718 under different strain rates and temperatures.
0
True Strain, εT
0 40 80 120 160 200
T
emperatur
e Rise,
Δ
T
/K
1000 s-1
5000 s-1
-150 °C 25 °C 300 °C 550 °C
0.5 0.4
0.3 0.2
0.1
[image:2.595.320.534.73.272.2] [image:2.595.320.535.322.527.2]temperature at true strains of 0.1 and 0.3 and strain rates of 1000, 3000 and 5000 s1, respectively. It is observed that the maximum work hardening effect occurs at the highest strain rate of 5000 s1 for both values of the true strain and all values of the deformation temperature. Furthermore, for a constant strain and strain rate, the work hardening rate decreases approximately linearly with increasing temper-ature. Figure 2 shows that a significant deformation-induced temperature rise occurs in the specimens impacted at a large strain of 0.3. As discussed above, the temperature rise results in a thermal softening effect. However, Fig. 3 shows that the work hardening rate has a positive value for all values of the strain, strain rate and temperature. Thus, it is inferred that the dynamic work hardening effect dominates the thermal softening effect. In other words, the Inconel 718 specimens undergo stable plastic deformation under high strain rate and high temperature loading conditions. (Note that this finding is supported by the absence of adiabatic shear bands in the OM observations.)
3.2 Strain rate sensitivity
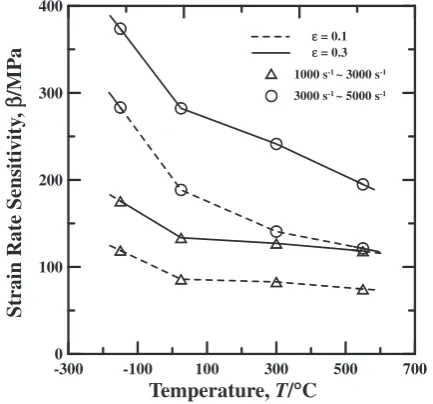
The relationship between the strain rate sensitivity of the Inconel 718 specimens and the strain rate can be visualised by plotting the flow stress against the semi-logarithmic strain rate at a constant true strain. Figure 4 shows that the strain rate sensitivity increases rapidly at strain rates of 3000 s1or more for both values of the considered strain. Previous studies have suggested that this abrupt change in the strain rate sensitivity is the result of the increasing influence of the dislocation drag mechanism at higher strain rates.19) How-ever, other researchers have attributed the enhanced strain rate sensitivity at higher strain rates to an increased rate of dislocation generation, the rapid formation of twin structures, or a greater degree of martensite transformation.20,21)
The dependence of the strain rate effect on the strain rate and temperature can be quantified using the following strain rate sensitivity parameter:
¼ ð21Þ=lnð""_2=""_1Þ; ð1Þ
where the compressive stresses2 and1are obtained from tests conducted at average strain rates of ""_2 and ""_1, respectively. Figure 5 shows the variation of the strain rate sensitivity with the temperature as a function of the strain and strain rate. The results show that the strain rate sensitivity of Inconel 718 increases with increasing strain rate and strain, but decreases with increasing temperature. At low strain rates (i.e. 1000–3000 s1), reduces significantly as the temper-ature is increased from150C to 25C, and then reduces more slowly as the temperature is further increased to 550C. By contrast, at high strain rates (i.e. 3000–5000 s1), reduces rapidly over the entire temperature range. It is thought that the reduction in the strain rate sensitivity at higher temperatures is the result of a greater deformation-induced temperature rise (see Fig. 2). The reduction in the strain rate sensitivity is particularly obvious at large strain rates (3000–5000 s1).
-300
Temperature, T/°C 0
500 1000 1500 2000 2500 3000
W
o
rk Hardening Rate,
T
/
∂
∂
σ
εT
/MP
a ε ε ε ε = 0.1= 0.3 1000 s -1
3000 s-1
5000 s-1
700 500
300 100
-100
Fig. 3 Variation of work hardening rate with temperature as function of true strain and strain rate.
102 103 104
Strain Rate, ε/s -1
0 400 800 1200 1600 2000
T
rue Str
ess,
σT
/MP
a
ε = 0.1
ε = 0.3 -150 °C 25 °C 300 °C 550 °C
.
Fig. 4 Variation of flow stress with strain rate as function of true strain and temperature.
-300
Temperature, T/°C
0 100 200 300 400
Strain Rate Sensiti
vity
,
β
/MP
a ε ε = 0.1= 0.3
1000 s-1~ 3000 s-1
3000 s-1 ~ 5000 s-1
700 500
300 100
-100
[image:3.595.318.534.72.272.2] [image:3.595.62.278.73.269.2] [image:3.595.319.536.325.527.2]In general, the strain rate of a plastically-deforming material can be expressed in the form of the following Arrhenius equation:
_
"
"¼""_0exp Q
kT
;
where""_0is the frequency factor; Qis the activation energy for the plastic deformation process; k is the Boltzmann constant; and T is the absolute deformation temperature. Here,Qis derived as22,23)
Q¼ Tð@=@TÞ_"";";
wherevis the activation volume and can be obtained from
v ¼kTð@ln _""=@ÞT:
Figure 6 shows the variation of the activation energy with the flow stress at strains of 0.1 and 0.3, respectively. The results show that for both values of the strain, the activation energy decreases with increasing flow stress. For example, at a true strain of 0.3, the activation energy reduces from 40 kJ/mole to 0.3 kJ/mole as the flow stress is increased from 800 MPa to 1650 MPa. From a thermodynamic perspective, the thermal activation energy enables dislocations to over-come short-range obstacles. Hence, an increase in the activation energy leads to a reduction in the material’s deformation resistance.
3.3 Temperature sensitivity
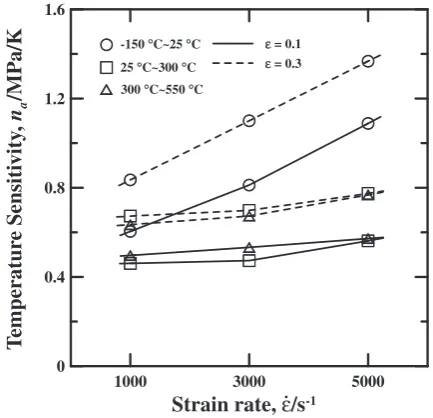
As shown in Fig. 1, the deformation temperature has a significant effect on the dynamic behaviour of the Inconel 718 specimens. Figure 7 shows the variation of the true stress with the deformation temperature as a function of the strain and strain rate. It can be seen that the stress decreases with increasing temperature at all values of the strain and strain rate. The flow stress reduces rapidly as the temperature is increased from 150C to 25C, and then reduces more slowly as the temperature is further increased to 550C. The thermal softening effect can be quantified using the following temperature sensitivity parameter:
na¼ jð21Þ=ðT2T1Þj; ð2Þ
where the compressive stresses2 and1are obtained from tests conducted at temperatures of T2 and T1, respectively. Figure 8 plots the temperature sensitivity of the Inconel 718 specimens against the strain rate as a function of the temperature and true strain. It can be seen that the temper-ature sensitivity at a large strain (0.3) is higher than that at a small strain (0.1). This is likely the result of increased adiabatic heating during the dynamic deformation process under higher strains. In addition, it is observed that the temperature sensitivity increases slightly with increasing strain rate at temperatures in the range 25300C and
300550C, but increases more rapidly at temperatures in the range 15025C. Overall, the results presented in Fig. 8 show that the deformation temperature has a greater effect on the mechanical response of Inconel 718 under high strain rates and low temperatures.
400
True Stress, σT/MPa
-10 0 10 20 30 40 50
Acti
v
ation Ener
gy
,
Q
/kJ/mole
ε = 0.1
ε = 0.3
2000 1600
1200 800
Fig. 6 Variation of activation energyQwith true stress as function of true strain.
-300
Temperature, T/°C
400 800 1200 1600 2000
T
rue str
ess,
σT
/
MP
a
ε ε = 0.1
ε ε = 0.3 1000 s-1
3000 s-1
5000 s-1
700 500
300 100
-100
Fig. 7 Variation of flow stress with temperature as function of true strain and strain rate.
1000 3000 5000
Strain rate,
ε
/s
-10 0.4 0.8 1.2 1.6
T
emperatur
e Sensiti
vity
,
n
a/MP
a/K
-150 °C~25 °C ε = 0.1 25 °C~300 °C300 °C~550 °C
ε = 0.3
.
[image:4.595.63.281.73.275.2] [image:4.595.316.535.75.271.2] [image:4.595.318.535.322.531.2]3.4 Microstructure observations
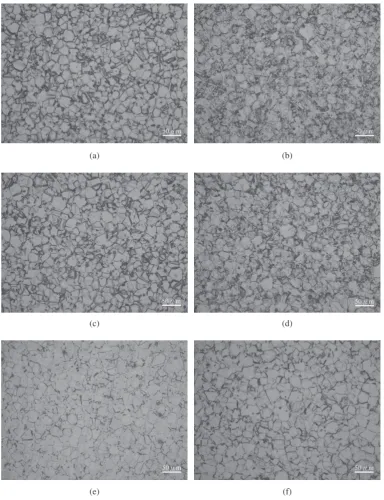
In this section, the stress-strain response of the Inconel 718 specimens under different temperatures and strain rates is clarified in terms of the corresponding evolution of the impacted microstructure. Figure 9 presents an optical micro-graph of the as-received Inconel 718. The microstructure comprises lamella-like straight annealing twins and equi-axed grains with an average grain size of 14.31mm. As shown in Figs. 10(a)–(f), the grain size of the impacted specimens is affected by both the strain rate and the temperature. In accordance with ASTM standard E112 (‘‘Standard Methods for Estimating the Average Grain Size for Metals’’), the grain size can be evaluated as
Fig. 9 Micrograph of as-received Inconel 718 (undeformed) in transverse direction.
(a) (b)
(c) (d)
[image:5.595.65.273.73.196.2](e) (f)
[image:5.595.106.491.250.751.2]N¼2n1 ð3Þ
where N is the number of grains per square inch at a magnification of100andnis an integer referred to as the ASTM grain-size number and ranges from 1 to 10, where a larger grain-size number indicates a smaller grain size. Table 1 summarizes the grain size number and grain size of the undeformed and deformed Inconel 718 specimens. It can be seen that the grain size number decreases with increasing temperature and strain rate. The growth in the grain size accounts for the reduction in flow stress with increasing temperature shown in Fig. 1. However, no softening occurs as the strain rate is increased despite the growth in the grain
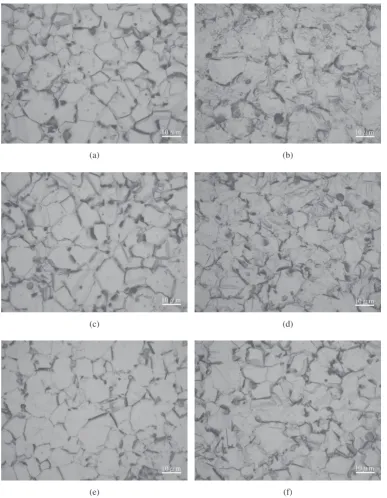
size. Thus, it is implied that the strain rate hardening effect dominates the softening effect produced by the temperature-induced grain growth. It is noted that the twin boundary is ignored in the grain size measurements since only few twins can be observed on the microstructure. This phenomenon can be confirmed by the high magnification micrographs shown in Fig. 11.
The dynamic strengthening effect and thermal softening effect result in the formation of local deformation areas in the impacted Inconel 718 specimens at the precipitates, grain boundaries and dislocations. These areas are readily etched and observed by OM. In general, a greater observable local deformation area (etching area) is indicative of a greater
(a) (b)
(c) (d)
[image:6.595.106.494.70.569.2](e) (f)
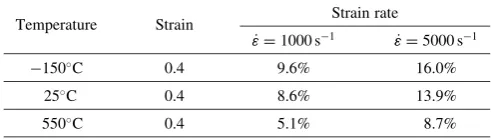
degree of work hardening. For example, comparing the undeformed specimen in Fig. 9 with the impacted specimen shown in Fig. 10(a), the wider grain boundary in Fig. 10(a) indicates a larger local deformation area. Figures 10(a)–(f) show that the local deformation area increases with increas-ing strain rate and decreasincreas-ing temperature. Table 2 presents a quantitative analysis of the local deformation area fraction (percentage) of the various specimens as a function of the strain rate and temperature. It is found that the local deformation area fraction increases with increasing strain rate, but decreases with increasing temperature. In general, the dislocations in the impacted microstructure become tangled at the local deformation area, and thus the resistance encountered by the moving dislocations increases at higher strain rates and lower temperatures. This accounts for the strengthening effect observed at higher strain rates and lower temperatures in Fig. 1.
4. Conclusions
The dynamic response of Inconel 718 has been inves-tigated at temperatures of150to 550C and strain rates of 1000 to 5000 s1 using a compressive SHPB system. The results have shown that the flow stress increases with increasing strain rate, but decreases with increasing temper-ature. In addition, the work hardening rate increases with decreasing temperature and increasing strain rate. The strain rate sensitivity increases at higher strain rates, but decreases at higher temperatures due to thermal softening effects. The maximum temperature sensitivity occurs at temperatures in the range 15025C and a strain rate of 5000 s1. The microstructural observations show that the reduction in flow stress at higher deformation temperatures is the result of
temperature-induced grain growth, while the strengthening effect under high strain rate loading conditions is the result of an increased rate of dislocation multiplication at the grain boundaries.
Acknowledgements
The authors gratefully acknowledge the financial support provided to this study by the National Science Council (NSC) of Taiwan under Contract No. NSC 98-2221-E006-035.
REFERENCES
1) R. Sarkar, P. Ghosal and V. Kumar: Mate. Des.31(2010) 4502–4507. 2) W. Lijun, X. Hui, L. Runguang, W. Shaogang and C. Zhonglin:
J. Mater. Process. Technol.137(2003) 17–20.
3) W. Z. Shao, L. Zhen, L. Yang and X. M. Zhang: Mater. Sci. Eng. A497
(2008) 479–486.
4) U. S. Lindholm: J. Mech. Phys. Solids12(1964) 317–335.
5) P. S. Follansbee and G. T. Gray: Metall. Trans.20A(1989) 863–874. 6) M. A. Meyers, Y. J. Chen, F. D. S. Marquis and D. S. Kim: Metall.
Mater. Trans.26A(1995) 2493–2501.
7) A. M. Bragov and A. K. Lomunov: Int. J. Impact Eng. 16(1995) 321–330.
8) W. S. Lee and S. T. Chiou: Compos. Pt. B-Eng.27B(1996) 193–200. 9) W. G. Ferguson, A. Kumar and J. E. Dorn: J. Appl. Phys.38(1967)
1863–1869.
10) A. Seeger: Phil. Mag.46(1955) 1194–1217.
11) K. Tanaka, K. Ogawa and T. Nojima: High Velocity Deformation of Solids, J. Shioiri, K. Kawata (Eds.), (Springer, Berlin, 1979), p. 98– 107.
12) K. Ogawa and T. Nojima: J. Sco. Mater. Sci. Jpn.37(1988) 1171– 1177.
13) W. S. Lee and C. F. Lin: J. Mater. Process. Technol.75(1998) 127– 136.
14) C. Y. Chiem and J. Duffy: Mater. Sci. Eng. A57(1983) 233–247. 15) J. L. Chiddister and L. E. Malvern: Exp. Mech.3(1963) 81–90. 16) W. S. Lee and C. F. Lin: Mater. Sci. Eng. A241(1998) 48–59. 17) M. C. Mataya and V. E. Sackschewsky: Metall. Mat. Trans. A 25
(1994) 2737–2752.
18) R. Kapoor and S. Nemat-Nasser: Mech. Mater.27(1998) 1–12. 19) P. S. Follansbee and U. F. Kocks: Acta Metall.36(1988) 81–93. 20) W. S. Lee and C. F. Lin: Metall. Mater. Trans. A33A(2002) 2801–
2810.
21) F. J. Zerill and R. W. Armstrong: Acta Metall. Mater.40(1992) 1803– 1808.
22) H. Conrad and H. Wiedersich: Acta Metall.8(1960) 128–130. 23) L. Shi and D. O. Northwood: Acta Metall. Mater. 43(1995) 453–
[image:7.595.45.550.84.208.2]460. Table 2 Local deformation area fraction (%) as function of strain rate and
temperature.
Temperature Strain Strain rate
_ "
"¼1000s1 ""_¼5000s1
150C 0.4 9.6% 16.0%
25C 0.4 8.6% 13.9%
[image:7.595.45.291.265.335.2]550C 0.4 5.1% 8.7%
Table 1 Variation of grain size number and grain size of Inconel 718 as function of strain rate and temperature.
Undeformed ASTM grain size number 8:020:10 "¼0
Grain size (mm) 14:310:9
_ "
"¼1000s1,"¼0:4 ""_¼5000s1,"¼0:4
150C ASTM grain size number 7:800:12 7:260:08
Grain size (mm) 16:51:2 24:91:5
25C ASTM grain size number 7:480:14 7:170:10
Grain size (mm) 20:51:3 27:21:6
550C ASTM grain size number 7:220:12 7:020:16