Proceedings of the 49th Annual Meeting of the Association for Computational Linguistics:shortpapers, pages 519–523,
Interactive Group Suggesting for Twitter
Zhonghua Qu, Yang Liu
The University of Texas at Dallas {qzh,yangl}@hlt.utdallas.edu
Abstract
The number of users on Twitter has drasti-cally increased in the past years. However, Twitter does not have an effective user group-ing mechanism. Therefore tweets from other users can quickly overrun and become in-convenient to read. In this paper, we pro-pose methods to help users group the peo-ple they follow using their provided seeding users. Two sources of information are used to build sub-systems: textural information cap-tured by the tweets sent by users, and social connections among users. We also propose a measure of fitness to determine which sub-system best represents the seed users and use it for target user ranking. Our experiments show that our proposed framework works well and that adaptively choosing the appropriate sub-system for group suggestion results in in-creased accuracy.
1 Introduction
Twitter is a well-known social network service that allows users to post short140character status update which is called “Tweet”. A twitter user can “follow” other users to get their latest updates. Twitter cur-rently has 19millionactive users. These users fol-lows80other users on average. Default Twitter ser-vice displays “Tweets” in the order of their times-tamps. It works well when the number of tweets the user receives is not very large. However, the flat timeline becomes tedious to read even for av-erage users with less than 80 friends. As Twitter service grows more popular in the past few years,
users’ “following” list starts to consist of Twitter ac-counts for different purposes. Take an average user “Bob” for example. Some people he follows are his “Colleagues”, some are “Technology Related Peo-ple”, and others could be “TV show comedians”. When Bob wants to read the latest news from his “Colleagues”, because of lacking effective ways to group users, he has to scroll through all “Tweets” from other users. There have been suggestions from many Twitter users that a grouping feature could be very useful. Yet, the only way to create groups is to create “lists” of users in Twitter manually by se-lecting each individual user. This process is tedious and could be sometimes formidable when a user is following many people.
system for the final suggestion. Our results show that automatic group suggestion is feasible and that selecting approximate sub-system yields additional gain than using individual systems.
2 Related Work
There is no previous research on interactive sug-gestion of friend groups on Twitter to our knowl-edge; however, some prior work is related and can help our task. (Roth et al., 2010) uses implicit so-cial graphs to help suggest email addresses a person is likely to send to based on the addresses already entered. Also, using the social network informa-tion, hidden community detection algorithms such as (Palla et al., 2005) can help suggest friend groups. Besides the social information, what a user tweets is also a good indicator to group users. To character-ize users’ tweeting style, (Ramage et al., 2010) used semi-supervised topic modeling to map each user’s tweets into four characteristic dimensions.
3 Interactive Group Creation
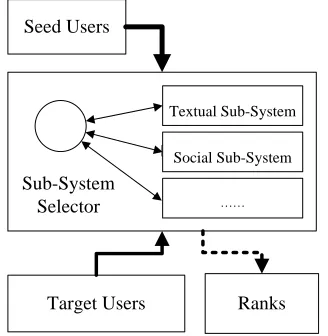
Creating groups manually is a tedious process. However, creating groups in an entirely un-supervised fashion could result in unwanted results. In our system, a user first indicates a small number of users that belong to a group, called “seeds”, then the system suggests other users that might belong to this group. The general structure of the system is shown in Figure 1.
[ Social Sub-System
…… Textual Sub-System
Sub-System Selector Seed Users
[image:2.612.104.268.499.667.2]Target Users Ranks
Figure 1: Overview of the system architecture
As mentioned earlier, we use different
informa-tion sources to determine user/group similarity, in-cluding textual information and social connections. A module is designed for each information source to rank users based on their similarity to the provided seeds. In our approach, the system first tries to detect what sub-system can best fit the seed group. Then, the corresponding system is used to generate the fi-nal ranked list of users according to the likelihood of belonging to the group.
After the rank list is given, the user can adjust the size of the group to best fit his/her needs. In addition, a user can correct the system by specifically indicat-ing someone as a “negative seed”, which should not be on the top of the list. In this paper, we only con-sider creating one group at a time with only “positive seed” and do not consider the relationships between different groups.
Since determining the best fitting sub-system or the group type from the seeds needs the use of the two systems, we describe them first. Each sub-system takes a group of seed users and unlabeled target users as the input, and provides a ranked list of the target users belonging to the group indicated by the seeds.
3.1 Tweet Based Sub-system
In this sub-system, user groups are modeled using the textual information contained in their tweets. We collected all the tweets from a user and grouped them together.
topic appearing in the user’s tweet.
Given a group of seed users, we want to find target users that are similar to the seeds in terms of their tweet content. To take multiple seed instances into consideration, we use two schemes to calculate the similarity between one target user and a seed group.
• centroid: we calculate the centroid of seeds, then use the similarity between the centroid and the target user as the final similarity value.
• average: we calculate the similarity between the target and each individual seed user, then take the average as the final similarity value.
In this paper, we explore using two different sim-ilarity functions between two vectors (ui and vi),
cosine similarity and inverse Euclidean distance, shown below respectively.
dcosine(u, v) = 1
|u||v|
n X
i=1
ui×vi (1)
deuclidean(u, v) =
1 pPn
i=1(ui−vi)2
(2)
After calculating similarity for all the target users, this tweet-based sub-system gives the ranking ac-cordingly.
3.2 Friend Based Sub-system
As an initial study, we use a simple method to model friend relationship in user groups. In the future, we will replace it with other better performing meth-ods. In this sub-system, we model people using their social information. In Twitter, social informa-tion consists of “following” relainforma-tion and “meninforma-tions”. Unlike other social networks like “Facebook” or “Myspace”, a “following” relation in Twitter is di-rected. In Twitter, a “mention” happens when some-one refers to another Twitter user in their tweets. Usually it happens in replies and retweets. Because this sub-system models the real-life friend groups, we only consider bi-directional following relation between people. That is, we only consider an edge between users when both of them follow each other. There are many hidden community detection algo-rithms that have been proposed for network graphs (Newman, 2004; Palla et al., 2005). Our task is how-ever different in that we know the seed of the target group and the output needs to be a ranking. Here, we
use the count of bi-directional friends and mentions between a target user and the seed group as the score for ranking. The intuition is that the social graph be-tween real life friends tends to be very dense, and people who belong to the clique should have more edges to the seeds than others.
3.3 Group Type Detection
The first component in our system is to determine which sub-system to use to suggest user groups. We propose to evaluate the fitness of each sub-system base on the seeds provided using a cross-validation approach. The assumption is that if a sub-system (information source used to form the group) is a good match, then it will rank the users in the seed group higher than others not in the seed.
The procedure of calculating the fitness score of each sub-system is shown in Algorithm 1. In the in-put,S is the seed users (with more than one user), U is the target users to be ranked, and subrank is a ranking sub-system (two systems described above, each taking seed users and target users as input, and producing the ranking of the target users). This pro-cedure loops through the seed users. Each time, it takes one seed userSi out and puts it together with
other target users. Then it calls the sub-system to rank the new list and finds out the resulting rank for Si. The final fitness score is the sum of all the ranks
for the seed instances. The system with the highest score is then selected and used to rank the original target users.
Algorithm 1 Fitness of a sub-system for a seed group
proc fitness(S, U, subrank) ≡ ranks:=∅
fori:= 1tosize(S)do U0:=Si∪U
S0:=S\Si
r:=subrank(U0, S0);
t:=rankOf(Si, r);
ranks:=ranks∪t; od f itness:=sum(ranks);
print(f itness);
end
4 Data
twitter users as the reference friend group in testing and evaluation. We exclude users that have less than 20or more than150friends; that do not have a qual-ified list (more than20and less than200list mem-bers); and that do not use English in their tweets. After applying these filtering criteria, we found 87 lists from12 users. For these qualified users, their 1,383 friends information is retrieved, again using Twitter API. For the friends that are retrieved, their 180,296tweets and584,339friend-of-friend infor-mation are also retrieved. Among all the retrieved tweets, there are65,329mentions in total.
5 Experiment
In our experiment, we evaluate the performance of each sub-system and then use group type detection algorithm to adaptively combine the systems. We use the Twitter lists we collected as the reference user groups for evaluation. For each user group, we randomly take out 6 users from the list and use as seed candidate. The target user consists of the rest of the list members and other “friends” that the list cre-ator has. From the ranked list for the target users, we calculate the mean average precision (MAP) score with the rank position of the list members. For each group, we run the experiment 10 times using ran-domly selected seeds. Then the average MAP on all runs on all groups is reported. In order to evaluate the effect of the seed size on the final performance, we vary the number of seeds from2to6using the 6 taken-out list members.
In the tweet based sub-system, we optimize its hy-per parameter automatically based on the data. After trying different numbers of topics in LDA, we found optimal performance with 50 topics (α = 0.5 and β = 0.04).
System Seed Size
2 3 5 6
Tweet Sub
CosCent 28.45 29.34 29.54 31.18 CosAvg 28.37 29.51 30.01 31.45 EucCent 27.32 28.12 28.97 29.75 EucAvg 27.54 28.74 29.12 29.97 Social Sub 26.45 27.78 28.12 30.21 Adaptive 30.17 32.43 33.01 34.74 BOW baseline 23.45 24.31 24.73 24.93
[image:4.612.74.298.587.687.2]Random Baseline 17.32
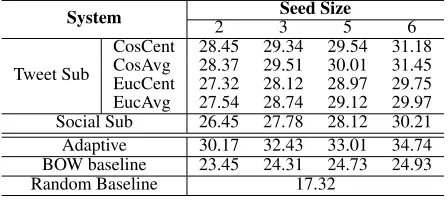
Table 1: Ranking Result (Mean Average Precision) using Different Systems.
Table 1 shows the performance of each sub-system as well as the adaptive sub-system. We include the baseline results generated using random ranking. As a stronger baseline (BOW baseline), we used co-sine similarity between users’ tweets as the similar-ity measure. In this baseline, we used a vocabulary of5000words that have the highest TF-IDF values. Each user’s tweet content is represented using a bag-of-words vector using this vocabulary. The ranking of this baseline is calculated using the average simi-larity with the seeds.
In the tweet-based sub-system, “Cos” and “Euc” mean cosine similarity and inverse Euclidean dis-tance respectively as the similarity measure. “Cent” and “Avg” mean using centroid vector and average similarity respectively to measure the similarities between a target user and the seed group. From the results, we can see that in general using a larger seed group improves performance since more informa-tion can be obtained from the group. The “CosAvg” scheme (which uses cosine similarity with average similarity measure) achieves the best result. Using cosine similarity measure gives better performance than inverse Euclidean distance. This is not surpris-ing since cosine similarity has been widely adopted as an appropriate similarity measure in the vector space model for text processing. The bag-of-word baseline is much better than the random baseline; however, using LDA topic modeling to collapse the dimension of features achieves even better results. This confirms that topic modeling is very useful in representing noisy data, such as tweets.
In the adaptive system, we also used “CosAvg” scheme in the tweet based sub-system. After the au-tomatic sub-system selection, we observe increased performance. This indicates that users form lists based on different factors and thus always using one single system is not the best solution. It also demonstrates that our proposed fitness measure us-ing cross-validation works well, and that the two in-formation sources used to build sub-systems can ap-propriately capture the group characteristics.
6 Conclusion
to the likelihood of a test user being in the group. We introduced two sub-systems, based on tweet text and social information respectively. We also pro-posed a group type detection procedure that is able to use the most appropriate system for group user ranking. Our experiments show that by using differ-ent systems adaptively, better performance can be achieved compared to using any single system, sug-gesting this framework works well. In the future, we plan to add more sophisticated sub-systems in this framework, and also explore combining ranking out-puts from different sub-systems. Furthermore, we will incorporate negative seeds into the process of interactive suggestion.
References
David M. Blei, Andrew Y. Ng, Michael I. Jordan, and John Lafferty. 2003. Latent dirichlet allocation. Jour-nal of Machine Learning Research, 3:2003.
Mark Newman. 2004. Analysis of weighted networks.
Physical Review E, 70(5), November.
Gergely Palla, Imre Derenyi, Illes Farkas, and Tamas Vic-sek. 2005. Uncovering the overlapping community structure of complex networks in nature and society.
Nature, 435(7043):814–818, June.
Daniel Ramage, Susan Dumais, and Dan Liebling. 2010. Characterizing microblogs with topic models. In
ICWSM.