warwick.ac.uk/lib-publications
A Thesis Submitted for the Degree of PhD at the University of Warwick
Permanent WRAP URL:
http://wrap.warwick.ac.uk/108772
Copyright and reuse:
This thesis is made available online and is protected by original copyright.
Please scroll down to view the document itself.
Please refer to the repository record for this item for information to help you to cite it.
Our policy information is available from the repository home page.
Conduction Processes in Spinel
Ferrites.
Peter John Phillips BSc (Hons)
A thesis submitted for the degree of Doctor of Philosophy
July 1991
University o f Warwick
Departm ent o f Physics
University o f Warwick
THE BRITISH LIBRARY
D O C U M E N T SUPPLY C E N T R E
BRITISH THESES
N O T I C E
The quality of this reproduction is heavily dependent upon the quality
of the original thesis submitted for microfilming. Every effort has been
made to ensure the highest quality of reproduction possible.
If pages are missing, contact the university which granted the degree.
Some pages may have indistinct print, especially if the original pages
were poorly produced o r if the university sent us an inferior copy.
Previously copyrighted materials Gournal articles, published texts, etc.)
are not filmed.
Reproduction of this thesis, other than as permitted under the United
Kingdom Copyright Designs and Patents A c t 1988, o r under specific
agreement with the copyright holder, is prohibited.
T H IS TH ESIS H A S B EEN M IC R O F IL M E D E X A C T L Y A S R E C E IV E D
Abstract
An apparatus has been designed, constructed and tested for measurements o f resistivity and thermopower, having the following novel
features:-I) buffer amplifiers with driven shields to make measurements on highly resistive specimens,
II) “ in house” software and hardware developed to automate the measurements and,
III) a new method of temperature measurement for thermopower studies.
Measurements have been carried out on single crystal Z n x F e3 _x 0 4 and M n x F e3 _x 0 4 with 0 <X <1 in the temperature range 4.2K-300K.
The results strongly suggest that substitutional disorder plays an important role in the electrical transport properties o f ferrites. The electrical conductivity for high X near 300K is interpreted in terms o f nearest-neighbour hopping. The temperature dependence of G (a7’ )=dLn(<77’ )/ d ( 1/T) between 300K and 100K and the concentration dependence of G (crT ) at 100K provides evidence for the formation o f a Coulomb G ap at low X. At low temperatures, variable-range and many-electron hopping for high and low X respectively is observed. An estimate o f the effective radius of the carrier wavefunction is obtained from the conductivity measurements, which at ~0.4Á is comparable to that previously deduced for nickel ferrite.
Declaration
This thesis is submitted to the University o f Warwick in support o f my ap
plication to the degree of Doctor o f Philosophy. It contains an account o f my own
research carried out in the Department o f Physics at Portsmouth Polytechnic and
the Department of Physics at University of Warwick during the period September
1985 and June 1991 under the supervision of Dr. T.E . Whall. N o part of it has
previously been used in a degree thesis submitted to this or any other university.
The work described in this thesis is the result of my own research except where
specifically acknowledged in the text.
Contents
Page
Abstract ... iii
Declaration ... iv
Contents ... v
Acknowledgements... ix
List of F igu res... x
List of T a b le s ... xviii
1 IN TR O D U C TIO N ... 1
1.1 Spinel Ferrites ... 1
1.2 Spinel Ferrite Crystalline S tru ctu re... 2
1.3 Layout of T h e s is ... 3
2 TH EO RIES O F C O N D U C T IO N ... 5
2.1 Introduction ... 5
2.2 Single-Electron Conduction Models ... 6
2.2.1 Camphausen, Coey and Chakraverty Model ... 6
2.2.2 Cullen and Callen ... 7
2.2.3 Anderson localization ... 7
2.2.4 Hopping conduction between localized states (M iller-Abraham s) ... 8
2.2.5 Variable Range Hopping ... 10
2.2.6 Nearest Neighbour Hopping ... 13
2.3.4 Transport Properties in the Vicinity of the Coulomb Gap ... 18
2.3.5 M ulti- / Many-Electron Hopping ... 19
2.4 Small “ Dielectric” Polarons ... 22
2.4.1 Introduction ... 22
2.4.2 Polaron Size and its Binding Energy ... 23
2.4.3 Polaron Hopping Motion ... 24
2.4.4 Polaron Hopping in a Disordered Lattice — Conductivity and Therm opow er... 25
2.5 Sum m ary... 26
3 SURVEY O F PR EVIO U S IN V E S T IG A T IO N S ... 27
3.1 Introduction ... 27
3.2 Early Measurements on Ferrite Samples ... 28
3.2.1 Cobalt Ferrite (CoxFe3_ x 0 4) ... 28
3.2.2 Nickel Ferrite (N ixFe3_ x 0 4) ... 30
3.2.3 Zinc Ferrite (ZnxFe3_ x 0 4) 33
3.2.4 Manganese Ferrite (M nxFe3_ x 0 4) ... 34
3.2.5 Titanium Ferrite (T i* F e 3_ x 0 4) ... 36
3.2.6 Fluorine Ferrite (Fe30 4_ x F x ) ... 38
3.3 Sum m ary... 39
4 E X P E R IM E N T A L W O R K ... 41
4.1 Introduction ... 41
4.2 Samples Measured ... 42
4.2.1 Preparation of Samples ... 43
4.2.2 Characterization of Sam ples... 43
4.3 Sample H o ld e r ... 44
4.3.1 Choice of Thermopower Technique ... 45
4.3.2 Thermopower and Resistivity Configurations ... 46
4.4 Choice of Temperature Sensor... 47
4.4.1 Silicon Diodes ... 48
4.4.2 Calibration o f Diodes ... 49
4.5 P T F E Clamps ... .50
4.6 Thermal Anchoring ... 51
4.7 Cryogenic System ... 5.'}
4.8 Electronics ... 54
4.8.1 Thermopower Circuits ... 55
4.8.2 Resistivity Circuit ... 55
4.9 Driven Shields ... 56
4.10 Softw are... 56
4.10.1 Thermopower S o ftw a re... 56
4.10.2 Resistivity S oftw a re... 57
4.10.3 PID Control ... 58
4.11 Test Results and Conclusion ... 60
5
RESULTS AND DISCUSSION ... 61
5.1 Introduction ... 61
5.2 Reasons for Present Work ... 61
5.3 Calibration of Apparatu s... 62
5.4 Outline o f Thermopower and Electrical Conductivity Results ... 64
5.5 Analysis o f the Electrical Conductivity Results ... 65
5.5.2 Low Temperatures — T < Tq ... 71
5.6 Analysis o f the Thermopower Results ... 75
5.6.1 High Temperatures — T > T s ... 75
5.6.2 Bandwidth ... 79
5.6.3 Comparison o f G ( o T ) and eil ... go 5.6.4 Low Temperatures — T < T $ ... 81
6 S U M M A R Y A N D CONCLUSION ... 86
R E F E R E N C E S ... 88
Acknowledgements
The author in indebted to his supervisor, Dr T.E. Whall, for discussions on
experim ent and theory and his patience during the writing o f this thesis, and to
Prof. E.H.C. Parker for encouragement support.
I am grateful to the chairman of the Physics Department, Prof. S. Palmer,
for his interest in the work and to the Science and Engineering Research Council for
the funding of the studentship.
For the provision of single crystal specimens, my thanks go to Dr. V.A.M .
Brabers of Eindhoven University, Holland.
This investigation would have never been completed if it was not for the
skillful work of Mr. B.G. Pearcey of Portsmouth Polytechnic who commenced the
assembly of the cryostat, and Mr. D. Lawlor in the mechanical workshop at Warwick
who patiently completed the apparatus. W e also wish to thank Mr. D.J.M. Lee for
the machining of the ferrite specimens and Mr. T . Naylor for useful discussions on
equipment.
Finally, the author is forever grateful for the support from my parents and
List of Figures
Following
Pag»
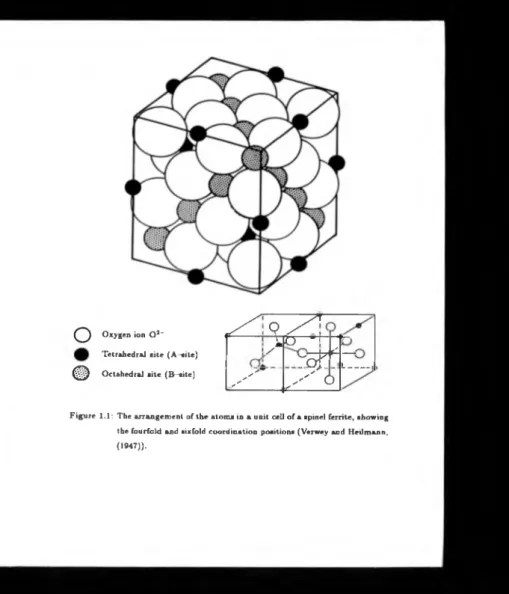
1.1 T h e arrangement o f the atoms in a unit cell of a spinel ferrite, showing
the fourfold and sixfold coordination positions (Verwey and Heilmann,
(1947)) ... 2
2.1 Single-electron energy diagram for Fe30< according to the C'amphausen,
Coey and Chakraverty model (1972) ... 6
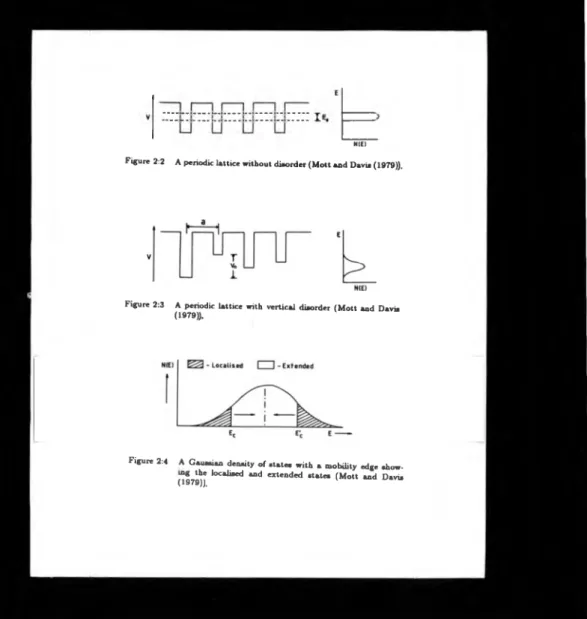
2.2 A periodic lattice without disorder. (M ott and Davis (1979)) ... 7
2.3 A periodic lattice with vertical disorder. (M ott and Davis (1979)) ... 7
2.4 A Gaussian density of states with a mobility edge showing the localised
and extended states. (M o tt and Davis (1979)) ... 7
2.5 T w o potential wells and their resulting wavefunction states ik,, and 9
2.6 A diagram showing three? possible high conductance links within a
solid ... 11
2.7 Qualitative behaviour o f the short range and long range ordering about
the Verwey temperature T v ... 11
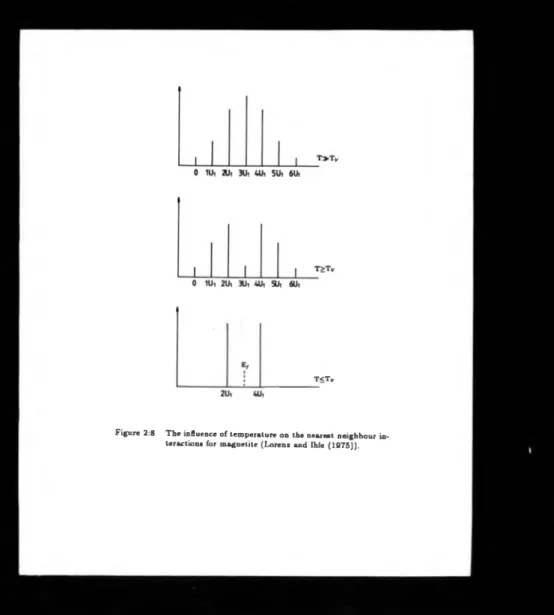
2.8 T h e influence of temperature on the nearest neighbour interactions for
magnetite. (Lorenz and Ihle(1975)) ... 16
2.9 A density of states with a Coulomb Gap showing possible peak
broadening due to impurities according to Lorenz and Ihle (1975) ... 17
2.10 A density of states with a Coulomb Gap according to Poliak and Knotek
2.11 A graph of resistivity against reciprocal temperature showing three
temperature regions as defined by Poliak and Knotek (1979) ... 17
2.12 Polaron-like multi-electron hopping conduction according to Mott
(1976) ... 20
2.13 Correlated multi-electron hopping, according to Poliak and Knotek
(1979) ... 20
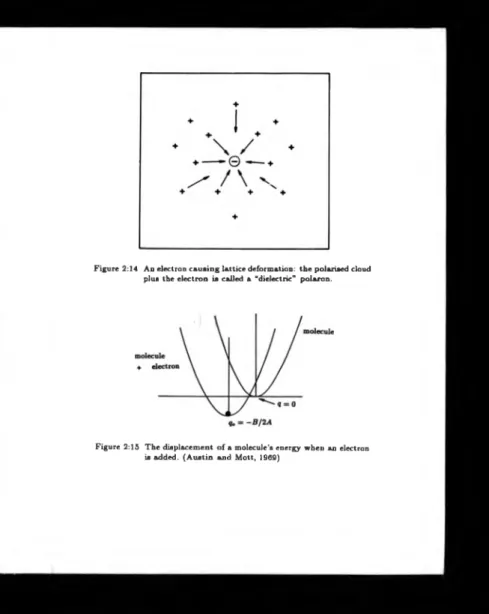
2.14 An electron causing lattice deformation: the polarised cloud plus the
electron is called a “dielectric” polaron ... 22
2.15 Th e displacement o f a molecule’s energy when an electron is added.
(Austin and M ott, 1969) ... 22
3.1 Room temperature values o f log resistivity for a series of mixed crystals
o f Co3_xFex04 near the composition CoFe2C>4. (Jonker, 1959) ... 29
3.2 Thermopower data o f Co3_xFex04. (Jonker, 1959) ... 29
3.3 Activation energies (at T = 4 5 0 K ) of the conductivity of mixed crystals
Co3_xFex04. (Jonker, 1 9 5 9 )... 29
3.4 Activation energies ( t ) o f (M eFe20 4 )i_ y(Fe30 4 ) versus y; the symbols
are A : Ni; 0 : Mn; and x : Zn. (Miyata, 1961) ... 29
3.5 Thermopower for N ii_ x F e 2+x04 versus 1000/T; X=0.046;
o: X =0.076; X: X=0.13; •: X=0.21. (Griffiths et al, 1970) ... 30
3.6 Temperature dependence o f ctT/X for N ii_ x F e 2+x 0 4; •: X=0.21;
x : X=0.13; A : X=0.06; ▼ X=0.046; X=0.03. (Griffiths et
al, 1970)... 30
3.7 |G(<tT)| (see equation 5.5) for N ixF e3 _x0 4 plotted against temperature.
3.9 T a versus X. A : for low concentrations; 0 : for higher concentrations.
(W hall et al, 1986) ... 31
3.10 Ln[G(<7)| versus Ln(T) for N ixFe3_ x 0 4 for X<0.2: lines o f slope 1.
(W hall et al, 1986) ... 31
3.11 Thermopower o f N ixFe3_ x 0 4 versus temperature for X<0.2.
(W hall et al, 1986) ... 31
3.12 Thermopower o f N ixFe3_ x 0 4 versus temperature for X>0.2.
(W hall et al, 1986) ... 31
3.13 Temperature dependence of the Seebeck coefficient o f Mn ferrites.
Th e symbols indicate the various contents. (Sirnsaetal, 1988) ... 35
3.14 Demonstration o f M ott’s law for Mn-ferrites. (Simsa et al, 1988) ... 35
3.15 The variation o f the thermoelectric power versus temperature for
manganese ferrite, according to Salerno (1986)... 36
3.16 A plot of G(<7T3' 2) versus temperature for manganese ferrite. T/v is the
Neel temperature. (Salerno, 1936) ... 36
3.17 Logarithm o f the conductivity of Fe3_ x T i * 0 4 versus 1000/T. The
dashed lines indicate the linear part o f the curves from which the
activation energies E„ have been calculated. (Kuipers, 1978) ... 37
3.18 The temperature dependence of the thermopower of the mixed series
Fe3_ x T i * 0 4. (Kuipers, 1978) ... 37
3.19 Th e magnetic transition temperature T*# of Fe3_ x T i x 0 4 ^ a function
o f X. (Kuipers, 1978) ... 37
3.20 The composition dependence of the activation energies E„ in
Fe3_ x T i * 0 4 determined from figure (3.17]. (Kuipers, 1978) ... 37
3.21 Th e low temperature data of figure [3.17] plotted versus T -1^4. The
3.22 T h e transition temperature ( T c ) from T -1^ law to T _ l law plotted
versus X for Fe3_ x T ix O «. (Kuipers, 1978) ... 37
3.23 Conductivity of Fe304_;rFx versus 1000/T. The arrows indicate the
Verwey temperatures of the samples X = 0 and X =0.035.
( Whall et al, 1977) ... 38
3.24 Seebeck coefficient o f Fe30 4 _*F .* as a function o f temperature. The
Verwey temperature ( T v ) and the Neel temperature (T/v) o f the sample
X = 0 are indicated on the figure. (W h all et al, 1977) ... 38
3.25 Measurements of the therinopower of Fe30 4_ x F x (at T = 3 0 0 K )
compared against the predictions o f the Heike’s formula. (Jones, 1985) . 38
4.1 Diagram of the arc-image furnace used in the floating zone technique.
(Brabers, 1971) ... 42
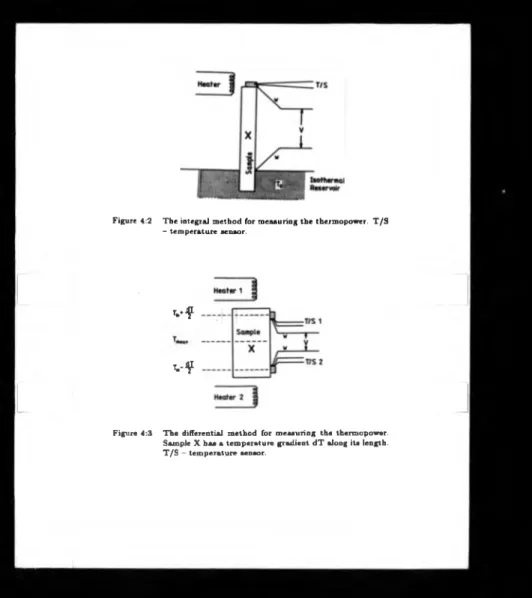
4.2 T h e integral method for measuring the thermopower. T/S temperature
sensor ... 45
4.3 T h e differential method for measuring the thermopower. Sample X has
a temperature gradient d T along its length. T/S temperature sensor. 45
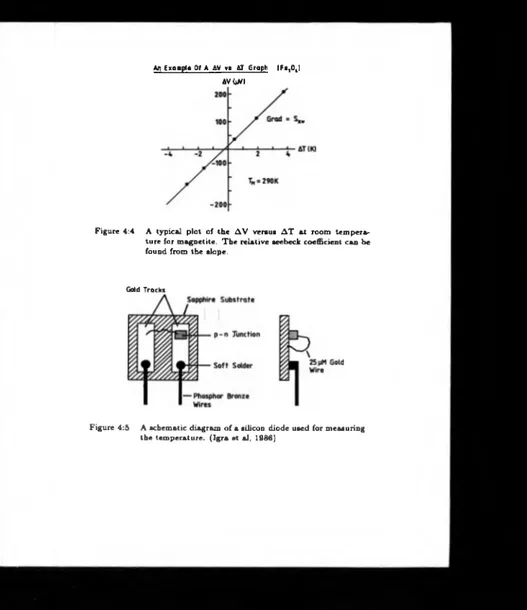
4.4 A typical plot of the A V versus A T at room temperature for magnetite.
T h e relative seebeck coefficient can be found from the slope ... 45
4.5 A schematic diagram o f a silicon diode used for measuring the
temperature. (Ig r a e ta l, 1986) ... 45
4.6 A typical plot of the voltage (for 10/iA) versus temperature for a diode,
shown in figure [4.5]. (ref. Southampton University — data sheet) ... 49
4.7 Schematic diagrams o f one of the P T F E clamps used for anchoring a
4.8 A schematic diagram showing the main details of the sample holder. PI
and P2 are the copper probes within the P T F E clamps ... 51
4.9 A schematic diagram o f the thermal anchor used, indicating the thermal
tempering rods and position of a small heater ... 52
4.10 A schematic diagram o f the cryostat showing the electronic junction
boxes, sample contraction compensator and sample holder ... 53
4.11 Th e electronics used by Keem (1975) for thermopower and resistivity
measurements ... 54
4.12 Th e experimental configurations used by Keem (1975) for measuring the
thermopower and r e s is tiv ity ... 54
4.13 Th e electronics used by the present author for measuring the
thermopower using the differential method ... 55
4.14 The electronics used by the present author for measuring the resistivity 55
4.15 A schematic diagram o f the pin-seal used. Designed by the present
author so that driven shields could be used within the cryostat ... 56
4.16 A block diagram showing the major pieces o f electronics used, which are
interfaced to a Hewlett Packard computer for automation ... 56
4.17 A flow chart showing the main features of the software for automation. 57
4.18 A flow chart showing the main features of the software for automation. 58
5.1 A plot of G(crT) versus temperature for N ixFe3_ x 0 4 with X<0.2.
The Verwey transitions, T v , are clearly shown; o: present author;
■ : Yeung, (1982) ... 63
5.2 Th e G-factor of N ixFe3_ x 0 4 versus temperature; X =0.8 — present
author, X=0.9 — Yeung (1982) ... 63
5.3 T h e thermopower of magnetite versus temperature, o: present author
used silicon diodes as the temperature sensors, x : Whall et al (198(j)
used thermocouples ... 63
5.4 Thermopower o f pure Nickel metal versus temperature; x: present author; ■: Hiatt et al, (1967); •: Grieg and Harrison, (1965) ... 63
5.5 N ix F e 3_ x 0 4 thermopower data plotted against temperature; •: present author; x: Whall et al, (1986); □ : Griffiths et al, (1970) ... 63
5.6 P lot of Log|0<7 versus 100/Temp for ZnxFe3_ x ()., ... 64
5.7 P lo t o f Log|0>7 versus 100/Temp for ZnxFe3_ x 0 4 ... 64
5.8 P lot of hog|0<7 versus 100/Temp for M nxFe:,_ * (). , ... 64
5.9 P lot o f Ixjgl0<7 versus 100/Temp for MnxFe3_ x O « ... 64
5.10 T h e thermopower o f ZnxFe3_xO * with X<0.1 plotted against temperature ... 64
5.11 T h e thermopower o f ZnxFe3_x04 with X > 0 .1 plotted against temperature ... 64
5.12 T h e thermopower o f M n*Fe3_x0 4 with 0 < X < 1 plotted against temperature ... 64
5.13 G ( o T ) [dLn(irT)/d(l/T)J of ZnxFe3_ x 0 4 with 0 < X < 1 plotted against temperature. Kach plot has a shifted origin, which is indicated on the right hand side. Th e sharp rise on the Zno.sFej.jO^ plot is interpreted as being due to the onset of magnetic disorder at the Neel point, T/v .. . 66
5.15 G(<tT V j ) |dLn(<rTs' J)/ d (l/ T )) of Z n j F e j - j O , with 0 < X < l plotted
against temperature. Each plot has a shifted origin, which is indicated
on the right-hand side. T h e sharp rise on the Zno.sFe2.2O4 plot is
interpreted as being due to the onset of magnetic disorder at the Neel
point, T/v ... 66
5.16 G fo T 3' 1) [dLn(<7T3f 2)/ d (l/ T )) o f M n ,F e ,_ * 0 4 with 0 < X < 1 plotted
against temperature. Each plot has a shifted origin, which is indicated
on the right-hand side ... 66
5.17 Values o f G(<rT).k versus X for ZnxFe3_x04 at different temperatures;
T=150K: o; T=290K: □ ; T c : ▲. Gillot et al (1981) data at 290K: x . . 69
5.18 Values of G(<rT).k versus X for MrixFe3_x 0 4 at different temperatures;
T=150K: o; T=290K: □ ; T G A ... 69
5.19 The measured inductance o f Zno.sFe2.2O4 versus temperature. The
temperature at which d l/ d T is the largest is taken as the Neel
temperature ... 69
5.20 A plot of Ln|G(<r)| for Z n * F e 3_x04 with 0 < X < 1 versus temperature.
The T “ V4 law is indicated by the solid li n e ... 71
5.21 A plot o f Ln|G(<r)| for M n x F e 3_x04 with 0 < X < 1 versus temperature.
The T “ I/4 law is indicated by the solid li n e ... 71
5.22 G(<7) versus temperature for Z n *F e3_,v04 with X<0.1. The solid lines
have a slope~15 ... 73
5.23 G(<7) versus temperature for M n^Fe3_x04 with X<0.2. The solid lines
have a slope~15 ... 73
5.24 Thermopower versus 1000/Temperature for Zno.sFe2.2O4 ... 77
5.25 Thermopower versus 1000/Temperature for Mno.sFe2.2O4 ... 77
5.26 A plot o f e ll versus the square o f the temperature for ZnxFe3_ * 0 4 with
0 < X < 1 . The number o f data points fitting the solid line falls for
increasing X ... 78
5.27 A plot of e ll versus the square o f the temperature for MnxFe3_x04
with 0 < X < 1 . The number of data points fitting the solid line falls for
increasing X ... 78
5.28 The calculated half-bandwidths plotted versus X ; x : ZnxFe3_x04i
o: MnxFe3_ x 0 4. •: ^ A X (1 — X ) — the expected half-bandwidth
curve due to disorder on the A - s it e s ... 79
5.29 A plot of G(<rT)-eIl versus X at room temperature; o: MnxFe3_ x 0 4;
x : ZnxFe3_ x 0 4 ... 80
5.30 A plot of G(<7T)-eIl versus X at T=200K; o: M n xF e3.A-04;
x : ZnxFe3_ x 0 4 ... 80
5.31 A plot o f G (<rT)-eIl versus X at T=150K; o: M n xF e3_ x 0 4;
x : ZnxFe3_ x 0 4 ... 80
5.32 Thermopower of Zno.sFe2.2O4 versus temperature; o: measured;
X: calculated using equation (5 .3 8 )... 82
5.33 Thermopower o f Mno.sFe2.2O4 versus temperature; o: measured;
List of Tables
Page
4.1 Polynomial Coefficients ... 51
5.1 E P M A results and calculated values o f X using Ln [(l-X )/2 ] __see
section 5.6.1 — for ZnjfFe3_jf04 ... gg
5.2 E P M A results and calculated values o f X using L n [(l-X )/ 2 ] __see
section 5.6.1 — for M nxFe3_ x 0 4 ... 33
5.3 Zinc F e rrite ... g4
5.4 Manganese Ferrite ... g4
5.5 Zinc F e rrite ... g^
5.6 Manganese Ferrite ... g^
Chapter 1
I N T R O D U C T I O N
1.1 Spinel F errites
Spinel ferrites have been used successfully in the electronics industry for over forty
years. Their usefulness stems from the ability to introduce a wide range of chem
ical species into the spinel lattice. By controlling the cation concentration in the
general spinel formula M x F e 3 _ x 0 4 their electrical and magnetic properties can be
tailored. Their applications are many and include microwave devices, information
storage chips, inductors for filters and recording heads. Recently they have been in
troduced to silicon wafers to m ake an improved memory chip (Cole, (1989)). These
applications use the spinel ferrite’s magnetic properties. The current scientific in
terest in ferrites is mainly concerned with their electrical properties which share
numerous features with other important electrical materials — for instance high T c
superconductors.
In 1939 Verwey studied magnetite (Fe30 4) and found that the conductivity
studied not only magnetite but magnetite doped with different eatioiiM. Neverthe
less, the conduction processes are still not fully understood.
1.2 Spinel F errite C rystalline S tru ctu re
The unit cell o f spinel ferrite contains 32 oxygen ions (O 2 -) in the form o f a cubic
close packed lattice (Verwey and lleilniann, (1947)). Amongst those oxygen ions are
64 tetrahedral and 32 octahedral interstices. O f these interstices only 8 tetrahedral
and 16 octahedral are occupied. Shown in figure (1.1) is the arrangement of the atoms
in a unit cell of a spinel showing the fourfold and sixfold coordination positions.
Th e general chemical equation is [X]/((Y 2)b0 4 where subscript A denotes a tetrahedral interstitial and B an octahedral interstitial. Magnetite has iron ions on
both sublattices and the ionic formula is:
As first pointed out by Verwey (1939) the conduction process may be thought of
as the movement of an electron on the 13 sites which can be represented by the
following chemical reaction:
This conduction process can be influenced by introducing impurities that replace
some o f the iron ions on either A or B sites. Thus, for example, zinc and manganese
ferrous ferrites which are to be studied in the present work, have the ionic formula
(see Chapter 3):
where 0 < X < 1 and M is either a zinc or manganese cation. T h e important features
of these materials as far as conduction is concerned are:
\ F t3* \ A [ F t2* F t 3*\ B ( ) * - ( M )
F t 2* + F t 3* - F t 3* + F t 2* ( 12)
(1.3)
o
Oxygen ion O 2-Tetrahedral site (A -s ite )^ Octahedral site (B -site)
\
-o
N
,
i
n
M.
1 y r
O ”
1
i 'of'
!___
.\ \ \
\
' ,___ ___ 1r
v
k
\ \ \ \ ___ __i
!>
(a ) the substitutional disorder of the manganese and zinc ions on
the A-sites should favour Anderson localization (Anderson, (1956)).
(b ) the high electron concentration is conducive to electron corre
lation effects.
(c ) the ionic nature o f the materials favours localization by polaron
formation (Holstein, (1959)).
(d ) the ferrimagnetic ordering which will play a role in the conduc
tion.
In the present work electrical conductivity and thermopower measurements
down to 4.2K are described, the aim of which is an understanding of mechanisms
(a), (b) and (c). Recent work by Barlow (1991) deals in some detail with item (d).
1.3 Layout of T hesis
Chapter 2 gives an up to date review of some o f the relevant theories that have been
developed since Verwey (1939) discovered the two orders of magnitude change in the
conductivity o f magnetite. Particular attention is paid the electrical conductivity
and thermopower. Chapter 3 gives a survey of some previous work on ferrites
including, for historical reasons, the work o f Verwey (1939) and of Jonker (1959)
and provides in its final section a justification for the present work. The present
author has developed experimental techniques for the measurement of resistivity
and thermopower, in order to make more accurate measurements on more resistive
samples, and these are described in some detail in Chapter 4. Chapter 5 describes
the results o f such measurements and compares them with previous experimental
work and with theories o f hopping conduction.
Finally, in Chapter 6 a summary is given o f the major achievements and
Chapter 2
T H E O R IE S O F C O N D U C T I O N
2.1 Introduction
Verwey (1939) was the pioneer o f investigations into the conduction processes in
magnetite. He assumed conduction o f d-elcctrons on octahedral (B ) sites as de
scribed by the following combined chemical and ionic equation:
[ F t » ) A[F e 2+ + F e 3+ = Fe*+ + F ^ \bO\~ (2.1) Because magnetite is the parent material o f ferrites an energy level diagram
and the conduction processes as described by Camphausen, Coey and Chakraverty
(1972) and Cullen and Callcn (1970, 1971 and 1973) sections 2.2.1 and 2.2.2
respectively will be given.
Since the publication of V erw ey’s results on magnetite many studies have
been carried out on both experimental and theoretical fronts. A general consen
sus is that the charge carrier in a ferrite material is to be treated as a localized
particle. Conduction occurs when a localized particle hops from one site to an
other (Austin and M ott, (1969)). Some possible hopping processes within these
the Miller-Abrahams (1960) paper on single-phonon assisted hopping conduction
between localized sites (section 2.2.4) and developments thereof.
The Miller-Abrahams theory is for single electron hops from one site to
another and not influenced by other electrons. When electrons become close to
each other, owing to a high concentration of localized carriers, an electron will
be influenced by neighbouring electrons. Therefore, in section 2.3 many electron
conduction is reviewed which starts with correlation effects giving a Coulomb Cap
for one-electron hops and then concludes with the types o f many electron hopping
possible.
When an electron is surrounded by positive and negative ions a lattice dis
tortion is possible (section 2.4). Section 2.4.3 describes in more detail this lattice
distortion termed a “polaron” and section 2.4.4 briefly comments on polaron con
duction.
2.2 Single-E lectron C onduction M odels
2.2.1
Camphausen, Coey and Chakraverty M odel
In 1972 Camphausen, Coey and Chakraverty constructed a one-electron energy
diagram for FeaO* based on data from soft x-ray, cathodoluminescence and opti-
calabsorption measurements. The result is shown in figure (2.1). Two parameters
determine the main features:
I) Crystal -field splitting (A c / ) deduced from optical data, and
II) Hund's rule - exchange splitting between spin-up and spin-down
the filled 2 p (0 ) and em p ty 4s(Fe) states: five spin-down electrons reside on the
tetrahedral (A ) sites and ten spin-up plus one spin-down electrons on the octahedral
(B ) sites.
This one-electron energy diagram shows that a solitary electron is possibly
the reason for metallic like conduction, but more information is required to examine
the electrical characteristics of FeaO« at low temperatures.
2.2.2
Cullen and Callen
Cullen and Callen in a series of papers (1970, 1971, 1973) consider a band model
based on an energy level scheme similar to that o f Camphausen et al for magnetite.
They suggest that a h alf filled band causes “ metallic” behaviour above T v , due to
a finite overlap of electronic wavefunctions. W hile below T v , inter-atomic coulomb
repulsion splits this band giving a Verwey transition. This approach might work for
a regular array of constant potential wells like that of FeaOi, but does not explain
what would happen when disorder is introduced i.e. by the addition of nickel or
zinc or manganese.
2.2.3 Anderson localization
Anderson (1958) was the first person to consider conduction within a disordered
system using a quantum-mechanical theory to describe localization. Consider the
periodic lattices shown in figures [2.2-2.3]. I f the potential wells are far apart such
that only the nearest neighbour interactions can occur and then they are gradually
brought closer together increasing the overlap o f the wavefunctions then a conduc
tion band forms of energy
N(E)
Figure 2:2 A periodic lattice without disorder (Mott and Davis (1979)).
Figure 2:3 A periodic lattice with vertical disorder (Mott and Davis (1979)).
Figure 2:4 A Gaussian density of states with a mobility edge show
where z is the coordination number and I the overlap integral number. This is known
as the tight-binding approximation.
Anderson then considered what would happen when disorder is introduced.
He pointed out that when V0/Eb was greater than a certain value depending upon z then there would be no diffusion at T =0. This condition has been studied by
Edwards and Thouless (1972) who have calculated Vo/Eb ^ 2 for z=6.
M ott (1966, 1967) took this further and pointed out that when the disorder
is large (as in figure (2.3)) and the Anderson criterion not satisfied then there exists
a certain energy Ec such that when E < E c there is no diffusion. Hence at T = 0 ,
Ec is referred to as the "mobility edge” . If the Fermi level can be swept in some
way through E c , from extended to localized states or vice-versa, a metal-insulator
transition occurs (see figure [2.4]).
2.2.4
H opp ing conduction between localized states (M ille r -
Abraliam s)
M iller-Abrahams (1960) consider two sites i and j separated by a large distance in a
disordered lattice and assume that an electron will have energy and wavefunction
</>, respectively when occupying site iand ej, <f>, when occupying site j . By analogy
with the hydrogen molecular ion it is expected that when the sites are brought closer
The resulting wavefunctions are found to
be:-* . - be:-* + (/ / A )be:-* i and (2.5)
where A = £j~£i, £j > £* and
I
= EXP [—r
0
/a].ea/*r„
(
2
.
6
)
for Is states, where “a” is the Bohr radius. The states a and b are illustrated in
figure [2.5]. The electron-phonon interaction Hep may be thought of as changing
the relative potential energies o f the two wells, leading to the possibility of states a
and b of total energy:
= Cl + ( n , + l/2).»u;„ .... I = a , b (2.7) where the second term is the vibrational energy. Transitions occur according to the
Fermi’s golden rule for the transition
probability:-u>ab(.n,n') = 7T < 6, n' I H ep \ a,n > 2 .6(Ebn ' — E an ) (2.8)
h
This formula expresses a law o f energy conservation according to which a change in
the electron energy must be balanced by the absorption of one or more phonons.
Miller-Abrahams (1960)
assume:-huq = £b -£ a (2.9) i.e. the absorption of a single phonon. Evaluating equation (2.8) and summing over
all combinations n, n’ they obtain a total intrinsic transition
probability:-<*><>= u>0.E X P [—2r,;/a].n, (2.10)
With
from equation (2.9) and with e,- ~£fc, £, ~ e0 we
get:-ufij = u *.E X P [-(«j - cj)/ifc7,].EX P(-2r,i/a] (
2
.12
)Equation (2.12), together with figure [2.5] may be thought of describing a process
in which a phonon gives an electron on site * just sufficient energy for it to tunnel
to site j , u>ij being proportional to the number o f phonons (equation (2.10)) and a
tunnelling factor EXP[-2r#/a]. Finally, taking account o f the occupancies of sites t
and j the average transition rate isl
and assuming all energies measured with respect to e j and greater than
kT:-2.2.5 Variable Range H opping
T h e two site conductance corresponding to equation (2.14) is (Ambegaokar et al,
(1
971)):-which has been obtained by assuming that the site energy difference in the presence
o f a field
is:-T h e solid is now usefully considered as a network o f conductances G t ]. Mott (1968)
in an early calculation produced a simple estimate o f the overall conductivity o f this
network by assuming that the electrons flowed through links of maximum conduc
tance. Taking the density o f electron states equal to a constant, M ott constructed (2.13)
r
0
« r
0
.EXP[-
2
a/i„).EXP
'I e j + I gj I + I - g j I2k T (2.14)
g„ = ^ i k T ) . r „ (2.15)
£ > - £ , + e F .fii (2.16)
a sphere of radius rtJ around site *. In order for an electron to hop to a site of
energy ej within this sphere the number o f sites in the energy range (t j - C i ) within
the volume should
be:-4 / 3 .»«3.(«> - d ) . N ( E ) > 1 (2.17)
Taking £,=0, £> >0 (i.e. two sites of energy greater than
£/):-G tj = 6,0.E X P (-2 a fl].E X P (-£ ,/ * 7 ’] (2.18) and substituting for e, from equation (2.17) and maximizing Mott obtained:
« - |9/(8jrQyV(fr)*7’ )),/'* (2.19)
with N (E )= N 0 giving finally:
» = a0.EXP|-(7b/r)l/*| (2.20)
with
(2.21)
More rigorous derivations of equation (2.20) followed, including that o f percolation
theory. Taking advantage of the exponential dependence o f G on R a network of
conductances is built up starting with the highest G (refer to figure (2.6]). T h e last
conductance added to form a complete link between contacts A and B is called the
critical conductance G c. Since Ge is exponentially smaller than any other conduc
tance in the chain the overall conductance of the chain is approximately equal to
Ge. Now, when further conductances are added to form parallel chains, these later
chains are effectively shorted out by the first. Therefore the overall conductance of
the network is G ~ G C. Proceeding in this way Poliak (1978) and Ambegaokar et al
(1971) obtain equation (2.19). We may write:
Figure 2:6
wi.Zr“ w°W
Ìng thr" P°“ible h'8h —
with
It follows from the percolation argument that states of energies |£*|>W are discon
nected from the critical network i.e. there is an energy layer o f width 2W centred
around E/ which gives rise to conduction.
Th e pre-exponential factor has been calculated by Kirkpatrick (1974) to be
°o oi ( B / T ) - ” .
Th e above result (equation (2.20)) is derived on the assumption of a con
stant density o f states. Poliak (1978) using, a density of states proportional to En
obtained:-Ln(cr) = l/T<«+i)/(»+4) ( 2.24)
M ott’s T -1/4 law is achieved if n=0 i.e. a constant density o f states. If n—* oo then
T -1 results i.e activated hopping conduction. Movaghar and Schirmacher (1981)
have used a density o f states which has an exponential band tail but which is constant
towards the middle o f the band and place the Fermi level in the middle of the band
tail. For low temperatures they obtain a T - '^4 dependence. Vescan et al (1972)
obtained the same result when considering a linear tail in the density of states
instead o f an exponential tail.
W e note that a T -1^4 law is associated with a constant density o f states in the
“conduction layer” and therefore it is clear that the law should always be obtained
at the lowest temperatures, providing that N (E ) is finite at E/.
Analysing many authors data Hill (1976) concluded that the T -1^4 law pre
sumed by most o f the original authors had been observed. However, a T -1^4 law is
not necessarily the consequence of variable-range hopping: Emin (1974) has noted
that a similar behaviour is a consequence of multiphonon hopping transitions.
where W (0 ) is the (nearest neighbour) conductivity activation energy extrapolated
to T = 0 . If W (0 )= 0 equation (2.32) then reduces to the metallic form (M ott and
Jones, (1936)). For a wide range o f Fermi energies Whall calculated the thermopower
to
be:-5 = A /T + B .T (2.33)
2.3 M any-E lectron Effects
2.3.1 Introduction
The previous sections have dealt with single-electron hopping mechanisms which
neglect the electron-electron interactions. A Coulomb term may be necessary when
there are many electrons in close proximity to each other. Such an interaction is
believed to cause the “metal-insulator” transition at the Verwey temperature in
magnetite where long range order is lost. Lorenz and Ihle ((1975), Ihle and Lorenz
(1973, 1974 and 1980)) have produced what is perhaps the most promising the
oretical description o f the interaction effects leading to the Verwey transition in
FeaOv Poliak and Knotek (1979) first pointed out that electron-electron interac
tions should be important in the impurity conduction. Numerous papers have been
published by Poliak and other authors, most notably Efros and Shklovskii (1984),
on this problem. Mott (1979) first applied these ideas to Fe30.|_xFx.
Lorenz and Ihle (see section 2.3.2) consider the Coulomb interactions between
nearest neighbours and next nearest neighbour for pure magnetite — the Verwey
transition is associated in their model with a complicated interplay between short
range order and long range order.
Many-electron correlation effects in impurity state hopping conduction ma
state». Efros and Shklovskii (1975) have shown that, near E/, the density o f states
to be N(E)oc|E-E/|2, and find a conductivity with a T - , ^a law. While M ott (1975,
1979) agrees with Poliak and Knotek that N (E ) is finite in the Gap giving a conduc
tivity with a T -1^4 law at low enough temperatures. Section 2.3.3 gives a description
of the nature of the Coulomb Gap. In section 2.3.4 the properties in the vicinity
of the Coulomb Gap are described. Section 2.3.5 gives details on how the Coulomb
Gap can be alleviated by different types o f many-electron hopping.
Firstly, electron electron interactions in magnetite are considered.
2.3.2 T h e model o f Lorenz and Ilile for Fe.jO^
Cullen and Callen (1970, 1971 and 1973) described magnetite as having a half filled
band with inter atomic Coulomb repulsion splitting the band to give a Verwey
transition. Lorenz and Ihle take an alternative approach in which crystal field
splitting gives U | » I > U 2, where U( is the nearest neighbour Coulomb interaction
energy, U j is the Coulomb energy due to the next nearest neighbours and I is the
overlap integral (see equation 2.2). At the highest temperatures there is complete
disorder and the density of states approximates to a set o f delta functions at 0,
U|, 2U|, 3U|, 4U|, 5U| and 6U|, with E/=3U|. Loren/ and Ihle consider that
conduction is due to tunnelling between nearest neighbour sites of the same ( 'oulomb
energy. Whall et al (1977) have pointed out that this state of affairs is similar to
that suggested by Mott (1974) in which the electron seres an Anderson localization
potential due to other electrons, but in which hopping between sites o f different
energies occurs. As the temperature is lowered there is a gradual increase; in short
range order as shown in figure- (2.7], lowering the density of states at 3U| figure
[2.8]. Next nerarerst neighbour interactions are- responsible for the development of
T<TV
and short range ordering leads to an abrupt further increase of short range order at
T y (figure [2.7]), completing the short range order process and giving the sharp two
orders o f magnitude decrease in conductivity at Tv- The major accomplishment of
this model is that it gives suitably low values of T v - because T v is determined by
long range ordering associated with U2<CUi.
Lorenz and Ihle calculate kT=0.09Ui and Ui/U2=0.04, yielding the values Ui=0.11eV and U2=0.004eV for Tv~ 1 2 0 K . They further show that the conductivity
activation energies near T v are £ ^ (T < T v )= U i= 0 .1 1 e V and £/«(T > T v )= U i/ 2 = 0 .0 5 5 e V ,
in good agreement with Adler (1968). Also, they show that a considerable amount
of SRO exists above T v
-2.3.3 T h e Coulom b Gap
When impurities are introduced into FeaO* the static ionic disorder introduced (of
Zn2+, Mn2+, N i2+, F~, etc) might be expected to broaden the levels 2Uj and 4Ui as
shown in figure [2.9] leaving a Coulomb Gap. Here the disorder might be thought
of as perturbing the electron-electron interaction effects. This situation has not
been dealt with by theorists. However, it is expected that the converse situation
i.e. impurity conduction perturbed by electron-electron interactions will serve as
an excellent guide. Remembering that in Fe3C>4 the electrons order as a result of
their mutual coulomb repulsion, we follow Poliak and consider what happens when
we add electrons to a disordered medium. First consider impurity conduction. The
first electrons to go into the disordered medium will enter sites which minimize their
Coulomb energy associated with the presence o f a random distribution o f static ions.
This will continue until there is a sufficient density of electrons for inter-electronic
interactions to be important. There will thus be a group of electrons which are
a tendency to order, situated around E/. This second group can be modeled by a
periodic electronic “lattice” . If an electron moves into a “ wrong” site on this lattice,
it costs an energy £ «, the Coulomb Cap energy. Various authors have calculated
£q (Efros (1976), Srinivasan (1971), Poliak and Knotek (1979)). T h e most useful expression for our purpose (Poliak and Knotek) is:
c„k E c lE c / (E c + A ) ) 1' 1 (2.34) where A is the disorder energy and Ec = e2/«a the Coulomb repulsion between
carriers separated by an average distance a, where n is the dielectric constant. Poliak
and Knotek (1979) predicts that the density of states in the vicinity of E/ varies
as:
N ( E ) = t> + A ( E — E/)* (2.35) Efros and Shklovskii (1975) predicted that the density o f states will vanish
at E/ i.e. o = 0 , see figure (2.10).
2.3.4
Transport Properties in the Vicinity o f the Coulomb
Gap
Poliak and Knotek (1979) define three temperature regions for the low temperature
d.c. conductivity (see figure (2.11)). At the highest temperatures, nearest-neighbour
hopping occurs, but is replaced by variable range hopping at intermediate temper
atures having a T -1^ behaviour. At even lower temperatures the electrons must be
activated across the Coulomb flap. The authors give for the dividing temperatures:
k'I\ ss 3.3W/aa and k T j ~ 2/?c/aa (2.36) where 1/a is the radius of the localized state. T , separates variable-range hopping
from nearest- neighbour hopping and T j divides the activation across the Cap and
The behaviour at the lowest temperatures is controversial. Using the fact that
at the Fermi level for single-electron hops the density of states is N (E )= (E -E / )2 and
applying M ott’s conductivity maximization procedure, Efros and Shklovskii (1975)
show that the conductivity in this temperature regime is (c.f. equation
(2.24)):-<t( T ) a K X P (- (T 0/ T ),/’ |, T„ = P S /k v (2.37)
where e is the electronic charge, kis the dielectric constant and is a numerical coefficient.
For conduction in states outside the Coulomb Gap, where the density of
states is constant, these authors agree with Mott that the conductivity obeys a
T ~ ,/4 law.
However, Poliak and Knotek (1979) and also Mott (1976) believe that cor
related multi-electron hopping will dominate over single-electron hopping and this
will be dealt with in the next section.
2.3.5
M u lti- / M any-E lectron Hopping
Mott (1976), Poliak (1980) and Poliak and Knotek (1979) have analysed the lowest
temperature regime where multi-electron hopping is thought to occur. They obtain
similar results although taking different approaches. The tw o techniques are as
follow:-M a n y —Electron H opping according to follow:-M ott
M ott considers electron-electron interactions in the following way. An elec
tron at a site A will create an electronic polaron in which neighbouring electrons
are displaced because of Coulomb repulsion, see figure [2.12]. A Coulomb Gap will
exist if when the electron hops from site A to B the neighbouring electrons at site
B remain fixed in space. Processes in which the Coulomb Gap is suppressed will
with it. If short hops occur they occur with a probability proportional to T 5, where
S=3aro/2Ln2 and ro is the hopping distance. The long hops are o f the normal
variable-range hopping type with,
= A ' . T S E X P [ - B / T,/4l (2.38) and S~10.
Efros (1976) has also considered polaron like hopping for low temperatures
but obtains different results. Efros
obtains:-«7 oc E X P ( - ( r 0/ 7 T ] (2.39)
with n=l/2.
M an y -E le c tro n H opping according to Poliak and Knotek
Poliak and Knotek (1979) consider a collective hopping configuration, see
figure [2.13]. Four sites are shown where the first and third sites are occupied while
the other two are empty. The electron on site 1 must overcome a certain amount
o f Coulomb repulsion if it wants to hop to site 2. This Coulomb repulsion can
be reduced if the electron on site 3 simultaneously hops to site 4. This is called
correlated multi-electron hopping. To find which process is the most probable at a
given temperature one needs to compare the Miller-Abrahams impedances for one
and two electron hops. The essential factors for the one-electron and two-electron
transitions are
respectively:-EXP[2ft/a].EXP[e/*7'] (2.40)
and
Figure 2:12 Polaron-like multi-electron hopping conduction according to Mott (1976).
- ♦ - 1
where e is the energy difference between initial and final states for the one-electron
hop and A is the energy reduction when the second electron hops from site 3 to
site 4. Th e process having the smallest impedance will the one that dominates the
conduction. The transition from a one-electron to a two-electron process will occur
when:-E X P (2 fl7 a ].when:-E X P (- A / * r i = 1 (2.42)
If the following approximations are made:-
A = e2/ «rc ,
where
K
= rc = (4 * / 3 ) - * '3.JV -1/3 (2.43)and N is the density o f carriers, then the transition temperature between single-
and multi-electron hopping
is:-- (2.44)
Although this derivation has used relatively crude approximations it agrees very
well with a more accurate derivation (Knotek and Poliak, (1971)).
For n-electron transitions at very low temperatures Poliak
writes:-a ( T ) « E X P|-25>0 / writes:-a ].E X P [- £ 7 * r ] (2.45) where E is the n-electron transition excitation energy and ErtJ the sum of all hopping
distances involved in the cascade process. Letting the average hopping distance of n
electrons be < r > , the first term of equation (2.45) becomes E X P [-2 n <r>/a]. Poliak
then calculates the average excitation energy for an n-electron excitation to
be:-E ~ n 'c c / d " (2.46) where d is the average number of directions in which the electron can hop and ec
procedure Poliak calculates the optimum conductivity to
be:-< r ( T ) oc 1 * * I L n d ) < r>/* (2.47) This is only valid for large n. Equation (2.47) approximates to that obtained by
Mott (see equation (2.38)) over a certain temperature range i.e. <7(T)ocTs where
s » l , but is based on a different many-electron hopping process. Poliak has given,
for this conduction process, the label “cascade-like multi-electron hopping” whilst
Fleishman et al (1978) labeled it “ variable number hopping” .
2.4 S m all “D ielectric” Polarons
2.4.1 Introduction
An electron m oving through a periodic lattice with a low mobility ( d c i t ^ V ^ s -1)
may be influenced by the positive (and negative) centres at the sites. See figure
[2.14]. If the electron is slow, as compared with the movement o f the positive ions,
then the positive centres become attracted to the electron (and the negative centres
repelled) causing a distortion in the lattice and inducing a potential well. If the
electron is very slow then the electron becomes self-trapped; this polarised cloud
plus electron is termed a “dielectric polaron” . The electron can only move, when the
potential well is deep, if it effectively takes the polaron cloud with it. ( “ Dielectric
polarons” are different to “electronic polarons” — see figure [2.12]).
Polarons have been seen in a number o f different materials; single crystal
As4S4 (Street and Gill, (1966)), orthorhombic sulphur crystals (Gibbons and Spear,
(1966)) and Li doped MnO (Crevecoeur and W it, (1970)). All these authors obtain
electron mobilities o f order 10_2cm2V - , s-1 at room temperature and above. Perhaps
the most interesting of the samples mentioned is MnO, because it is the d-electrons
on the manganese ions which are the current carriers as in the manganese and zinc
ferrites measured in this investigation. More recently polaron hopping has been
inferred in ferrites (Yeung, (1982) Because the polaron concept is applicable to
ferrites it is worth discussing some o f its main features.
2.4.2
Polaron Size and its Binding Energy
There are two sizes of polaron, the size depending upon the magnitude of lattice
deformation. When the lattice around an electron is only affected slightly such that
the electron is loosely bound then this is termed a “ large” polaron i.e. the effective
radius (rp ) of the polaron is greater than the lattice constant. Since this type of
polaron is less relevant to ferrites then it shall not be considered any further. When
the lattice is greatly deformed the electron becomes trapped inside a deep potential
well and hence is tightly bound; this is termed a “small” polaron i.e. rp less than
the lattice constant.
Austin and M ott (1969) have shown for small polarons rp to
be:-< o > r » i ,/3
2 UJ
(2.48)where < a > is the mean intersite separation. These authors also show that the
polaron binding energy
is:-WP = eJ/2 KP r P (2.49) with l//cp = l//c(oo) — 1/k, where k and /c(oo) are the dielectric constants with and without the electron respectively.
2.4.3
Polaron Hopping M otion
Austin and Mott (1969) review the molecular crystal model o f Holstein (1959). A
solid is assumed to consist of diatomic molecules having vibrational energies A q2
without an electron, where q is a configurational constant. When an electron is
added to a molecular site the energy is modified to A q2-Bq, where Bq is the energy
o f the electron (see figure [2.15]). The polaron binding energy W p (i.e. minimum
energy) is
then:-WP = B 2/4A (2.50) with equilibrium coordinate,
q0 = B / 2 A (2.51) The result corresponds to a situation in which the tunnelling probability is small, i.e.
1—»0 where I is defined by equation (2.2), and is known as non adiabatic hopping. In
the case where the electron can move backwards and forwards several times during
each excitation of the lattice the work required to achieve the approximate lattice
configuration is offset by a reduction in the kinetic energy and
W „ = Wp/2 - I (2.52) This is known as adiabatic hopping. For an electron to jump from one molecule
to another, the configurational parameters qi, q2 must be such that the electron’s
energy is the same in either molecule: thus
Bqx = Bq2 (2.53) T h e energies required to distort molecules 1 and 2 to configurations in which
q ,= q 2= q
are:-A (q 0 q )2 and A q2,
which add up to a total energy W// given by:
Wh = - 2q0q + 2q2). (2.54)
Substituting (2.55) into (2.54) the activation energy for hopping is thus:
WH = Wp/2 (2.56) and the conductivity is proportional to EXP[ W/y/kT].
At high temperatures W// is temperature independent. At low tempera
tures an intersite hop can involve the absorption and emission o f large numbers of
phonons ( “ multi-phonon assisted hopping” ). The numbers emitted and absorbed
must be roughly equal to conserve energy. Since the average number of phonons of
a particular wavevector is:
N ' = E X P ( h u , , / t T ) - 1 (2'57) processes involving a large number (N ,) of phonons freeze out for kT<Au>, (Emin,
(1974)). For optical phonons the jump rate tends to E X P ( 5u>o/kT) for T<5u>o/'Jk,
corresponding to the emission o f a phonon and absorption of another phonon of
energy 5u>o. For acoustic phonons Emin finds that the jump rate is rather similar
to a T - ,/4 law.
2.4.4
Polaron H opping in a Disordered Lattice
— Conductivity and Tlierm opower
Bottger and Bryksin (1977a d) have investigated nearest neighbour hopping in a
disordered medium for strong electron phonon coupling. They find the two site
conductance:
where N is the concentration o f sites, a is the reciprocal Bohr radius of a localised
state, fj and are the probabilities of site i and j being occupied and W// is given by
equation (2.56). Emin has pointed out that in this situation multi-phonon hopping
will freeze out at low temperatures leaving single phonon hopping. Thus, in equation
(2.58), as T —>0 W//—*0 giving a form similar to the Miller-Abrahams expression,
with Lmrocl/T1' 4. The transition temperature to single phonon hopping should
be given by A~5u>o, where A is a typical difference in energy between two sites,
A ~ k T j /<T 3'* (equation (2.23)).
Emin (1975) has considered the thermopower for strong electron-phonon
coupling and
finds:-S
ocr l/!
(2.59)
Emin’s treatment is of somewhat limited application for a real system since
he has only considered the two site hopping probability, has not taken into account of
site occupation probabilities and not averaged over the whole conductance network.
Therefore, his results can only serve as a rough guide.
2.5 Sum m ary
Th e present author has attempted to summarize theories which he believes are most
useful for an explanation o f his results on ferrites. It remains to make a synthesis
o f these ideas in Chapter 5 in order to throw some light on the observed electrical
Chapter 3
S U R V E Y O F P R E V IO U S
I N V E S T I G A T I O N S
3.1 Introduction
Since Verwey (1939) showed that there was a two orders o f magnitude transition
in the electrical conductivity at ~120K in “ pure” magnetite, many workers have
investigated this oxide to try to understand the conduction processes involved. By
doping with impurities a further understanding of the conduction process can be
achieved. The spinel ferrous ferrites have been found to have the common chemical
formula M xFe3_x04, where M is a cation that usually has a site preference and an
ionic valency o f 1+, 2 + , 3 + or 4+: in some cases, e.g. manganese, a combination of
valences is possible. It has been over fifty years since Verwey published his results
and many workers have produced papers since then.
This chapter is devoted to a survey of previous work on only a selected num
ber of spinel ferrous ferrites; these are Cobalt, Nickel, Zinc, Manganese, Titanium
and Fluorine doped ferrites. Each section will start with the earliest work on a
ticular type o f ferrite and then give the ionic formula to indicate the site preference
o f the cation. Then the papers of selected authors will be reviewed, showing their
results and their conclusions on the conduction process believed to be taking place.
Corroborative work will also be cited, and finally an in-depth review will be given
o f the most up to date publication on a particular ferrite system.
Throughout this chapter, when the ionic formula is given the characters A
and B indicate tetrahedral and octahedral site preferences, respectively.
3.2 E arly M easurem ents on Ferrite Sam ples
3.2.1 Cobalt Ferrite
(C oxFea-xC ^)
Jonker (1959) became interested in the fact that by increasing the cobalt concen
tration in magnetite, at room temperature, the resistivity gradually increased until
X = 1 where upon the resistivity increased sharply and then began to fall slowly for
increasing X. Consequently, he investigated this ferrite system, by making resistivity
and thermopower measurements on polycrystalline cobalt ferrite with 0.9<X<1.1,
having ionic
formulae:-0 < X < 1 [F e 3* ] A[C o3x* F e 3± x F e3* ) B0 3- (3.1)
\ < X < 2 [F e 3+}A[C o3+C o :? _ l F e ltx \ B 0 34- (3.2)
An advantage o f this system is that both cobalt and iron show the Verwey type
conduction:-F e 3* = conduction:-F e 3+ + t~ C o 3* = C o3* + h* (3.3) where e~ and h* represent an electron and hole respectively. Hence, both n- and p-
An oilbath was used to obtain the elevated temperatures for the resistiv
ity and thermopower measurements and a two-probe method for the resistivity.
The results obtained by Jonker are shown in figures [3.1-3.3] — Jonker has used
Co3_xFexO< with 1.9<X<2.1 to represent colbalt ferrite.
Jonker suggested a hopping type conduction, and rejected the band theory
on the grounds that a low mobility with an exponential temperature dependence
was observed. Jonker used equation (2.58) to calculate the mobility i.e. he assumed
adiabatic polaron hopping in a medium in which disorder was small.
Assuming that every Fe2+ contributed an electron and every Co3+ con
tributed a hole to the conductivity, Jonker calculated the mobilities for electrons
to be ~ 10-4cm2V - , s-1 and ~ 1 0 -8cm2V _1s-1 for holes, with activation energies
0.2eV and 0.5eV respectively. Using these p and W // values in equation (2.58)
Jonker calculated the phonon frequencies to be in the interval 1012 10l4Hz. T his he
claimed was satisfactorily close to the expected 1013Hz, considering u>o was sensitive
to the activation energy. Using approximately the same measuring techniques G illot
and Jemmali (1983) obtained comparable values to that of Jonker for p, W// and
frequency.
Gillot (1982) in a subsequent paper analysed cobalt ferrite with 0 < X < 1 by
measuring the thermopower, w ith a 20—>25K temperature gradient across the sam
ple. Taking a small polaron approach to the conduction, the theoretical expression
he obtained was identical to the Heikes formula,
Heikes --- 0 = —- p n p --- j + o j (3.4)
if the kinetic term ( a ) was assumed to be approximately zero and c = (l- X )/ (2 - X ),
ions:-Gillot achieved a good agreement with the results obtained and concluded that
small polaron hopping occurred only between octahedral lattice sites.
3.2.2
Nickel Ferrite
(N ix F e
3
_xC>
4
)
The ionic formula
is:-0 < X < 1 [F e 3+]A[N i2x+ F e2t x F e 3+] B0 2- (3.6)
Nickel ferrite has been investigated for nearly thirty years. Because there
have been vast numbers of papers published on nickel ferrites, only a few of the
most important papers will be discussed.
M iyata (1961) made conductivity measurements on N ii-y F e j+ y O * in the
temperature range 100K-300K. Fitting the data to equation (2.58) and calculating
the activation energies, Miyata found them to be in the range (5 ~ 8 )x lO -2eV, which
were comparable with Lavine’s (1959) results. Miyata found, as can be seen from
figure [3.4], that the activation energy decreased with increasing Y (alternatively,
increases with X in equation (3.6)). This agreed with the later results of Kohane
and Silverman (1962) to within ±5%.
A more thorough investigation into nickel doped ferrites was made by Grif
fiths et al (1970). For all Y (0 < Y < 1 ) they made thermopower and four-probe
resistivity measurements between 20K and 1100K. At low temperatures when the
resistivity became too high a two-probe technique was implemented. The results
are shown in figures [3.5—3.6]: figure [3.5] shows the thermopower versus reciprocal
temperature. The most striking feature is the development o f a peak for sample
Y=0.046 (i.e. high nickel concentration) as the temperature is lowered. They at
*
•
(¥


![Figure 4:6 A typical plot of the voltage (fo r 10/iA) versus tempera ture fo r a diode, shown in figure [4.5]](https://thumb-us.123doks.com/thumbv2/123dok_us/9871732.488369/95.597.38.555.16.614/figure-typical-voltage-versus-tempera-diode-shown-figure.webp)
