THE BEHAVIOUR OF REINFORCED r.ONCRETE
:BEAM-coLUMN ·JOlNTS UNDER
OYCLIC LOADmG~
A thesis .submitted for the degree of Master of Engineering in Civil Engineering
in the University of. Canterbury, Christchurch, New Zealand.
by
ENGINEERING
lllli\A~Y
i
l'rr:;,
.l :} I.\
ABSTRACT
This project investigates the behaviour of reinforced concrete· beam-column joints under the application of high intensity cyclic loading.
The experiments, wbicb were carried o~t on specimens with a beam framing in on only one side of the joint, were conducted to investigate the amount of transverse reinforcement re(}.uired for confinement and shear resistance in the joint and column regions, in order to establish the ductility available in the column, when subjected to simulated seismic loading.
Four units were tested during the experimental program, the design parameters
being:-(i) tbe amount of transverse reinforcement in the joint.
( ii)
the method of anchol'ing the beam flexural steel in the joint. (iii) the amount of transverse reinforcement in the column.The type of failure mechanism, and the cause of degradation in stiff-ness in the post-elastic range, is examined for
eacr
specimen leading to a critical appraisal of the joint detail.I gratefully acknowledge the assistance given by members of the academic and technical staff of the Civil Engineering Department, and extend my thanks to the following people:
Professol~ H.J. Hopldns, Head o.f the Civil Engineering Dept., under whose overall guidance this study was performedJ
Professor R. Park, supervisor of this project, for hhJ guidance and assistance during the experimental work and in the preparation of this thesis;
Dr. T. Paul.9.y, supervisor of this project, for his constructive suggestions and ei'lcouragement throughout this study;
Messrs H .T. Watson and P.C; Dawson, Technioal Officers, for co-ordination of the testing programme;
Mr N.W. Prebble, Senior Tecrnician, for his technical advice and practical belp throughout the preparation and testing of the specimens;
Messrs J.N. Byers, Senior Technician, J.M. Adams and S.R. Robinson, Technicians, for their valuable assistance during tasting;
Mr II. Patterson for photographic work;
Mr R.W.G. Blakeley for the design of the test rig;
Mr
s.
J. Dawson for his tireles'a efforts tracil1g diagrams;Mrs N.J. Robinson for typing the manuscript;
I also r:r;ratefully acknowledge the financial aid from my parents and the University of Canterbury.
TABLE OF CONTENTS.
ABSTRACT.
ACKNO\r.LEDGEMENTS. TABLE OF r.ONTENTS, LIST OF FIGURES. LIST OF TABLES. NOTATION.
CHAPTER ONE - INTRODUCTION. 1. 1 General.
1.2 Behaviour of Reinforced Concrete Frames. 1.3 Scope of this Research.
CHAPTER TWO - THE STATE OF THE ART. 2.1 Present Design Procedures. 2.2 Review of Previous Work.
CHAPTER THREE - TEST SPECIMENS. 3.1 Introduction.
3. 2 Design 3. 2.1 3.2.2
3.2.3
of Specimen.
Overall Specifications.
Size and Flexural Reinforcement 3. 2. 2. 1 Column.
3.2.2.2 Beam.
Transverse Reinforcement. 3.2.3.1 Joint Ties, 3.2.3.2 Column Ties. 3.2.3.3 Beam Stirrups.
3.
3. Theoretical Behaviour, 3.3.1 Elastic Range.3.3.1.1 Flexural Cracking.
of Members.
3.3.1.2 Yield Load.
3.3.1.3 Rotations and Deflections. 3.3.1.4 Steel Strains.
3.3.2 Post Elastic Range. 3.3.2.1 Ultimate Load.
3.3.2.2
Rotational Ductility. 3.4 Earthquake Loading Representation.3.4.1
Load Application. 3.4.2 Loading Sequence.~IIAPTER FOUR - UNIT 1 •
4.1
Introduction.4.2
Detail of Reinforcement.4.3
General Performance.4.4
Behaviour of Flexural Reinforcement.4. 4.
1 Column Bars.4.4.2
Beam Bars.4.5
Behaviour of Transverse Reinforcement.4.5.1
Column Ties.4. 5.
2 Joint Ties.4.5.3
Beam Stirrups~4.6
De forma tiona.4. 6. 1
Deflections.4.6.2
Moment-Rotation4.6.3
Load-Deflection4.7
Cracking.4.8
The Failure Mechanism.F:HAPTER FIVl~ - UN IT 2.
5.
1 Introducti.on.Relationships. Re la ti on ship:
5.
2 Detail of Reinforcement.5.3
General Performance.5.4
Behaviour of Flexural Reinforcement.5.4.1
Column Bars.. 5. 4. 2
Beam Bars.5.5
Bel;aviour of TranAverse Re i.nforc.3m~nt.5.5.1
Column Ties.5.5.2
Joint Ties.5.6
Deformations.5.6.1
Deflections.5.6.2
Moment-Rotation5.
6. 3 ·Load-Deflection5.7
Cracking.5.8
The Failure Mechan:i.sm.r;HAPTER SIX - IDTIT 3. 6.1 Introduction.
Relationships. Relationship.
6, 2 Detail of Reinforc~tilt.·mt.
6. 3 General Performance.·
6.
4
Behaviour of Flexural ~einforcement.6.4.1
Column Bars.6.4.2
Beam Bars.6, 5 Dehaviour of Transverse Reinforcement. 6, 5.1 Oolumn Ties.
6.5.2 Joint Ties.
6.6
Deformations.6.6.1 Deflections.
6,6.2 Moment-Rotation Relationships.
6.6.3
Load-Deflection Relationship.6.7
Cracking.6. 8
The Fapure Mechanism.CHAPTER SEVEN - UlilT
4.
7.1 Introduction.
7.
2 Detail of. Reinforcement.7.3
General Performance,7.4 Behaviour of FJexur&l Reinforcem(·mt. '7. 4. 1 Colu:nn Bars.
'7.4.2
Beam Bars.7.5 Behaviour· of Transverse Reinforcement.
7.5.1
Column Ties,7.5.2
Joint Ties.7.6
Deformations.7.6.1
Deflections.7.6.2
Moment-Rotation Relationships.7.6.3
Load-Deflection Relationship.7. 7
Cracking.'7. 8 The Failure Mechanism.
CHAPTER EIGHT - DISCUSSIOl; MlD CON•-,LUSIONS. 8.1 Comparison of Specimens.
8.2 Criticism of Detail.
8.3
Recommendations.;p:rENDIX A.
A. 1. Materials.
A. 2. Fabrication of Specimen~
A. 3. Test Rig.
A.4. Application of Load.
A.
5.
Instrumentation.A. 5.
1.. Load Measurement.A.5.2
. Rotstions.A.5.3 Deflections,
A.5.4 Strain Measurements. A.5.4.1 DEMEC Gauges,
A.5.4.2 Electric Resistance Strain Gauges.
APPENDIX B.
B.1 Design Calculations.
B.1.1 Column Reinforcement. B.1.2 Balanced Load of Column.
B.1.3 Ultimate Moment Capacity of Column. B.1.4 Beam Reinforcement.
B. 1.5 Anchorage Requiremen:ts,
B. 1.6 Analysis of U- type Anchorage Detail. B.1.7 Joint Hoops for Confinement.
B.1.8 Joint Ties for Sh8ar, B: 1,
9
Column Ties for Shear, B.1.10 Confinement of the Column. "B.1, 11 Shear in the Beam.B,2 Theoretical Predictions. B.2.1 Cracking.
B. 2. 1. 1 Beam. B.2.1.2 Column. B.2.2 Yield Load. B.2.3 Rotations. B.2.4 Deflections.
B,2.'5 Ultimate Moment of the Column. B,2,6 Rotational Ductility.
B.2.7 Tbeoretlcal Steel Strains. B.2.7.1 ~earn Steel,
B.2.7.2 Colu~1 Steel.
vii Page
135
137 137 140 142 142 142 142 143 143 144 146 146147
148 148 148 148 149 149 1501 J 1
viE Page
B.2.8 Ultimate Moment Capacity of the Column Core of UNIT
4. 159
B.2.9 Bond Stress Developed in Beam Flexural BarG. 159
LIST OF FIGURES. Figure.
1.1 Response of Framed Struct'..lre to Lateral Load. 1.2 Test Specimen.
3.1 Forces on Test Specimen.
3.2
Loading Sequence.4. 1 Reinforcing Detail for UNIT 1.
4.
2 The Distribution of Steel Strains in Column Flexur~~l Bars4.3
4.4
4.5
4.6
4.7
4.8
in UNIT 1.
(a) For Downward Load Runs. (b) For Upward Load Runs.
The Distribution of Steel Strains in UNIT 1.
(a) For Downward Load Runs. (b) For Upward Load Runs. IDliT 1 on Load Run 6.
Buckling of Column Flexural Bars. The Distribution of Joint Tie Strains
(a) At Back of Column. (b) At Side of Column.
(a) The Strain Distribution on Back (b) The Strain Distribution on Side
I
Beam Flexural Bars in
in UNIT 1.
of Joint Ties in UNIT of Joint Ties in UNIT The Load-Strain Relationship for Joint Ties in UNIT 1.
(a) Back of Ties. (b) Side of Ties.
1. 1. ix Page.
4
4
11 11 19 21 22 2425
26 2627
28
30 31 32 334. 9
Deflected Shapes of UNIT 1 at Peaks of El!.:.stic Load Runs.35
4.10 Moment-Rotation Relationshi-ps for UNIT 1; (a) Col\..unn Above the Joint.
('b) Colur.m Below the Joint.
4.11 Load-Deflection Relationship for illiiT 1.
36
4.12 UNIT 1 on Load Run 1.
4.13 Back of Joint· in UNIT 1 on Load Run
6.
4.14 ill~IT 1 on Load Run 4.
4.15 mriT 1 at Failure on Load Run
7.
4.16
Failure Mechanism of UNIT •,1.
5.1 Reinforcing Detail for ffi~IT 2.
5.
2 UNIT 2 on Load Run3.
5.3
UNIT 2
on Load Run4.
5.4
ill~IT 2 Showing Secondary Vertical Crack at Failure.5.5
The Distribution of Steel Strains in Column Flexural Barsin UNIT 2.
(a) For Downard Load. (b) For Upward Load.
5.6
The Distribution of Steel Strains in Beam Flexural Bars inUNIT 2.
(a) For Downward Load. (b) For Upward Load.
5.7
The Distribution of Joint Tie Strains in ill~IT 2. (a) At Back of Column.(b) At Side of Column.
5.8
(a)The
Strain Distribution on Back of Joint Ties (b) 'l1he Strain Distribution on Side of Joint Tiesin UNIT
in UNI'r 2. 2. X Page
.39
.39
39
41
414.3
4444
44
4647
49
50
52
53
55
56
5. 9
Back of Joint Showing Vertical Splitting Crach in illHT 2.57
5.10
The toad-Strain Relationship for Joint Ties in WHT 2. (a) Back of Ties.(b) Side of Ties.
58
59
5.
11 Deflected Shapes of UNIT 2 at Peaks of Elastic Load Runs. 60 5.12 Moment-Rotation Relationships 'for UNIT 2.(a) Column Above the Joint.
(b) Cplumn Below the Joint.
5.13
Load-Deflection Relationship for UNIT 2.9.14
UNIT 2 on Load Run5.
5.15
Crushing of Concrete in Column of UNIT 2 Immediately Above Beam-Column Junction.5. 16
UlHT2
at Failure.5.17
Failure Mechanism of UNIT 2.6.1
Reinforcing Detail for UNIT3.
6.2
UNIT3
on Load Run3.
6. 3 UNIT 3 on Load Run 4.
6.4 .UNIT ·3
on Load Run9.
6.5
The Distribution of Steel Strains in Column Flexural Barsin UNIT 3.
(a) F0r Downward .Load Runs. (b) For Upward Load Runs.
6. 6
The Distribution of Steel St1•ains in Beam Flexural Bars in UNIT 3.6.7
6.8
(a) For Downward Load Runs. (b) For Upward Load Runs.
The History of Strain for the Beam li'lexural Bars in UNIT 3. The Distribution of Joint Tie Strains in UNIT 3.
(a) At Back of Column (DEMEO and Electric Resistance Strain Gauges). xi Page
65
65
66
68
70 70 7072
7374
75
76
78
(b) At Side of Column (DEMEO Gauges).
79
(c) At Side of Column (Electric Resistance Strain Gauges).
80
6, 9
(a) The Strain Distribution on Back of Joint Ties inillHT 3.
(b) The Strain Distribution on Side o~ Joint Ties in UNIT
3.
6.10
The Load-Strain Relationship for Joint Ties in UNIT3.
(a) Bp.ck of Ties ( DENIEC and Electric Resistance Strain Gauges).
82
83
(b) Side of Ties ( DEMEC Gauges).
(c) Side of Ties (Electric Resistance Strain Gauges). (d) Inside of Ties (Electric Resistbnce Strain Gauges). 6.11 Deflected Shapes of UNIT 3 and Peaks of Elastic Load Runs. 6.12 Moment-Rotation Relationships for UNIT
3.
(a) Column Above the Joint. (b) Column Below the Joint.
6.13 Load-Deflection Relationship for UNIT 3.
6.14
UNIT3
on LoadRun 1.
6.15 UNIT 3 at Failure.
7.
1 Reinf::1rcing Detail for UNIT4.
7.2
UNIT4
on Load Run3.
7.3
illfiT4
on Load Run8.
7.4
The Distribution of Steel Strains in Column-Flexural Bars in UNIT4.
xii Page
86
87
90 90
91
93 93
(a) For Downward Load.
99
(b) For Upward Load. 100
7.5
The Distribution of Steel Strains in Beam Flexural Bars inUNIT
4.
(a) For Downward Load. 102
(b) For Upward Load. 103
7. 6 End of Top Beam Flexural Bar Lifted off Bearing Surface. 98
7.7
The Distribution of Steel Strains on Column Ties of UhiT4.
105;.8
The Distribution of Joint Tie Strains in UNIT4.
(a) At Back of Column. 106
(b) At Side of Column. 107
7.9
Th,e Load-strain Relationship for Joint Ties in UNIT4.
(a) Back of Ties. (b) Side of Ties.
7.
1.,; Deflected Shapes of UNIT4
at Peaks of Elastic Load Runs.108
7. 11 Moment-Rotation Relationships for UNIT 4. (a) Column Above the Joint.
(b)
Column Below the Joint.7.12 Load-Deflection Relationship for UNIT 4.
-~
7.13 UNIT 4 on Load Run 4. 7.14 UlHT 4 on Load Run
5.
7. 15 UNIT 4 on Load Run8.
7.16 UNIT 4 at Failure. 7.17 UNIT4
at Failure.8.1 Distribution of Internal Forces. 8.2 Forces on Joint of UNIT
4
(Run 1)·8.3
Pressure on One Leg of Tie.8.4
Dimensions of Specimen. A. 1 Reinforcing Cage of UNIT 1.A.2 Reinforcing Cage Positioned in Mould. A.3 Joint of UNIT 1 Showing Demeo Studs.
A.4
(a) Test Rig and Specimen. (b) Beam Loading Frame.A.5
Specimen Prepared for Testing.A.6 Rotation and Deflection Recording Apparatus.
A.7 Bowing of Joint Ties Due to Bursting Pressure of Column Core.
xiii
Page
112
112
114 116 116
116
117
117 120 120 126 126
131
131 131 133 133 136 136
LIST OF TABLES. Table,
4. 1 Performance of UNIT Durins Load Cycling.
5.
1 Performance of UNIT 2 During Load r.ycling. 6. 1 Performance of ill~ IT3
During Load Cycling.7.
1 J:'erformance of UNIT 4 During Load Cycling.8. 1 8,2
8.3
Bond Stress Developed in Beam F1e:wral Bars. Comparison of Theoretical
Comparison of Theoretical Deflections.
3.4 Joint Shear Reinforcement. A.1 Material Properties.
B.1 Beam Cracking Loads. B.2 Column Cracking Loads. B.3 Theoretical Yield Loads.
and Actual Loads, and Actual Rotations
B.4 Load-Rotation Relationships for the Golurm. B,
5
Load-Deflection Relationships for the Beam. B.6 Theoretical Ultimate Moments for the Column. B,7 Moment-StTess Relations~ips for Beam Steel. B, 8 Stress in ~olumn Bars.and
xiv
Page. 38 '61
92
113
119
121
123
124 130
149
XV
NOTATION.
A c
=
area of core of reinforced column, measured to the outside of the transverse reinforcement.gross area o£ section.
= Ag + (n - 1)
Ast'
the equivalent concrete area of a section. area of tension reinforcement,A' s ""
:::
=
=
=
area of compression reinforcement. area of transverse hoop bar (one leg). area of structural steel in a composite depth of equivalent rectangular stress deptb of equivalent rectangular stress conditions.
a s = area of individual reinforcing bar. av = area of transverse tie (one leg)
b
0
0
s c c b
=
-=
=
width of compression face of member. concrete compressive force.
steel compressive force.
distance from extreme compression fibre distance from extreme compression fibre balanced load conditions.
D
=
nominal diameter of reinforcing bar.section. block.
block under balanced load
to neutral axis. to neutral axis under
d = distance from extreme compression fibre to centroid of tension reinforcement.
d'
=
distance from extreme compression fibre to centroid of compressionE c E s e c e cu
=
,::::: ::: ::: reinforcement.modulus of elasticity of concrete. modulus of eb.stici ty of steel. concrete strain.
a = steel strain in tension reinforcement. s
e' = steel strain in compression reinforcement. s
e
=
yield strain in reinforcement. ye*
=
difference in strain readings from DEMEC gaugeA and electricf f c f' c
g
H
resistance gauges at same gauge locations.
=
compressive stress.=
concrete compressive stress.= concrete cylinder compressive strength. = tensile stress developed by
a
standard hook. = steel tensile stress.=
steel compressive stress.I
=
tensile strength of concrete.=
yield stress in reinforcement.= parameter in equation 'of parabola (Section
A.5.4.1).
= horizontal reaction at top and bottom of column.xvi
h'
=
maximum unsupported length of rectangular hoop measured between perpendicular legs of the hoop or supplementary cross-ties.= moment of inertia of beam. = moment of inertia of column:
k ratio of distance from extreme compression fibre to the neutral axis/d.
L
=
anchorage length of reinforcing bar. Ld=
computed development length.L
=
equivalent embedment length. eM' = modified bending moment.
Mb "' bending moment applied to beam. M ~ bending moment-applied to column.
c
M or
=
moment at first cracking.Mub
=
ultimate moment capacity of the beam. M = ultimate moment capacity of the column.xvii
M = theoretical moment strength of a section. uo
m
=
number of ties in the joint. N=
column axial load.Nb
=
axial load on column to produce balanced load conditions. N = column axial load at the ultimate strength of the column.u
n ratio of modulus of elasticity of steel to that of concrete.
p load applied at the end of the beam.
P = load on beam at first cracking. cr.
P = the maximum load applied to the beam either during.one load run max.
or over the whole test.
P* = the load on the beam at which theoretical ultimate capacity of the
u
specimen is attained.
P* = the load on the beam·at which first yield of the flexural
rain-y
foroement should theoretically occur. p = tension steel area ratio, As/ bd.
p'
=
compression steel area ratio,A~/bd.
pb
=
steel area ratio to produce balanced load conditions.p' s
=
ratio of volume of transverse reinforcement to total volume of core (out to out of ties) of a reinforced concrete column. Pt=
total steel area ratio, Ast/bd.r = length of demec studs.
s = spacing of transverse reinforcement. T = steel tensile force.
t = overall depth of section •. u
=
bond stress.umax
=
maximum bond stress developed. uu=
ultimate bond stress.V
xviii
V
=
shear force carried by reinforcement. sV
=
ultimate shear force.u
v
=
shear etress.v
=
shear stress carried by concrete. cw
=
densityof
concrete.x,y = co-ordinates of parabolic equation {section
A.5.4.1).
=
distance from centroid to extreme tension fibre.= general angles defined in text. = deflection.
6u
= lateral displacement of centre of gravity of a building at ultimate.A = deflection at end of beam due to rotation of the column.
Ov1
6v
2 = deflection at end of beam due to bending of beam.lly = lateral displacement of centre of gravity of a. building at first yt~l.d,~ ·',
b
= movement at end of demec stud due to bending of reinforcing bar.¢
= rotation of column. ¢u=
ultimate curvature.f'lliAPTER ONE.
INTRODUCTION
1.1
GENERAL:
The task of designing earthquake resistant structures has come under close scrutiny during the last decade as the effects of earthquake loading
on
stru~tural
behaviour becomes more apparent. Recent observations1'2 haveshown that many buildings, even though they have not been designed for the purpose, have the ability to resist earthquakes without undereoing any rne.jor structural damage due to the interent safety incorporated in tradi tiotlal design mathods. How~ve1·1 the fa~lure of many other huildines subjected to
Geismic excj_t.ation, and tl·e increase in construction of high-rise building$, r,as lead to a demand for increased knowledee of the e;nthquake behaviour of such structures in o~der to establish adequate seismic design criteria.
Prior to this, the design of structures insured tbat allowable stresses were not exceeded in the elastic 1·ange. However, modern earthquake - r·esistant structures are designed on the assumption that, although the large Jateral forces induced by a major earthquake in the post-elastic range may cause loc8.l overstressing, adequate ductility is available to dissipate the energy of the earthquake motions. Thus it is the aim of the more recent design methods to ensure t.hat sufficient post-elastic deformation can take place
to enable the structure to survive without collapse.
The concept of ductility in reinforced concrete entails much revjsion of tl:e tredi tional design procedures wr·icr basically depended on conr:rete for its 'strengtr·. It does r·owever, lead to more effird.etlt and economical use of construction rna terials, and increased confidelJCe by engineers in tt>eir ability to design structures able to resist tbe large post-elastic deform-ations imposed by a severe earthquake.
1. 2 BEHAVIOUR OF REINFORCED t:!ONCRETE FRAMES:
The recommendations pertaining to ductility in reinforced concrete structures were first proposed by Blume, Newmark, and Corning in 1961,1 which eventually lead to a section in the
S.E.A.o.c.
1968 Revision of "Recommended Lateral Force Requirements" which states3 "•••••••••buildings more than 160 ft. in height shall have ductile moment-resisting space frames ••••••••• The necessary ductility shall be provided by a frame of. II
structural steel ••••••••• or by a reinforced concrete frame •••••••••• Consequently the behaviour of reinforced concrete frames has been a topic of considerable interest.
Reinforced concrete frames designed as ductile moment-resisting space frames may, depending on tbe intensity of the earthquake, be subjected to several post-elastic cycles throughout its duration. With each cycle, the accumulation of damage in the failure region means a degradation in stiffness, and since ductility is determined by the ratio of deflection at ultimate to the deflection at first yield
~/Ay),
this loss of stiffness tends to increase the apparent ductility of. the structure. However the ability for energy absorption, as indicated by the area under the load-deflection curve, is generally not enhanced due to a loss in load-resisting capacity. Convent-ional theories based on maintaining the ultimate strength of the structure cannot, therefore, be forgotten in the need to satisfy ductility requirements.Since energy absorption in reinforced concrete is best acheived by yielding of the flexural reinforcement, care must be taken to ensure that other stress requirements are not underestimated. If a "brittleu failure occurs - that is, one due primarily to bond, shear or compression - little or no ductility is available for post-elastic deformations and collapse of the structure is a l:l.kely outcome. The beam-column joint is a region wher.e shear and bond stresses are critical, and since the strengtr. and ductility
of the members cannot be achieved without an adequate connecting detail, the performance of this reeion can be a decisive factor in determining tte overall behaviour of the structure.
When a reinforced concrete frame is subjected to earthquake motions it will deform as shown in Fig. 1. 1. Considering the region surrounding an exterior beam-column joint (circled) as a free body, the forces required to establish equilibrium are shown in Fig. 1.2 {a). If the assembly is rotated through the angle
a,
then the specimen i.s located conveniently for testing purposes, Fig. 1.2 {b).1.3 SCOPE OF THIS PROJECT:
The original purpose of this series of tests was to determine the amount of transverse reinforcement necessary to provide sufficient ductility and energy absorption in the column region immediately adjacent to the joint, by subjecting different specimens to high intensity cyclic loading. For this reason it was necessary to absorb tl:e energy by yielding of the column flexural steel, and therefore the ultimate flexural capacity of the beam was designed to be greater than that of the column, but other requirements for shear, bond and confinement as specified by the code were considered in tre design.
The intention was to test specimens with differing amounts of trans-verse reinforcement in the column, increasing the steel content from nominal
\
ties until the required ductility was acheived. As results obtained during the testing programme indicated that the joint was prone to fail before the ultimate moment of the column could be attained, it became increasingly obvious'that little satisfactory information concerning column ductility could be derived from the tests until an adequate joint detail could be ~· designed.
- - 1
I
I
I I
r--t---+---...
---.__;~...,j..._.__-+---,I
I
I
~~~--~~--~~~~~~~
I I
I I
~~---~r-~----~~~--~~~,
FIG. 1.1
RESPONSE OF FRAMED STRUCTURE
TO
LATERAL FORCE.·
H
0111111
p
\
(a){b)
FIG. 1.2
TEST
SPECIMEN
I
I
4
[image:23.595.50.529.66.788.2]The emphasis of the test programme, therefore, shifted from invest-igating column ductility to endeavouring to detail a joint with the strength to enforce yielding of the flexural bare. Obviously muoh of the difficulty arose from testing specimens with joints unconfined by spandrel beams.
However, although exterior· joints such as these are not often used in actual construction, the tests revealed weaknesses in the detail and gave indications of stress distributions, which would not have been .apparent had the specimens consisted of other than an isolated joint deta.il.
CHAPTER TWO
THE STATE OF THE ART
2. 1 PRESENT DESIGN PROCEDURES:
The concept of designing for ductility in reinforced concrete structures was initiated by Blume, Newmark and Corning1 and its acceptance was such
that it is now a basic design procedure incorporated in the design codes of the majority of earthquake prone countries. It is .well recognised 1
'4
that, should failure occur, the flexural yielding should preferably be enforced in the horizont~l-rather than the vertical members. Therefore it is stipulated5 that
th~
ultimate moment capacity of the column must be greater than that of the beam, where they frame into the same joint.However even though the column is designed to be stronger than the beam there are factors which in practice can greatly influence the relative strengths of the members. The most significant of these is when the
direction of the earthquake is at 45° to the axes of the building. At any beam-column joint the column is subjected to the full earthquake effect while the beams need only resist the component of the earthquake along their· longitudinal ·axes. This means that the column must be designed more than
4o%
stronger than tbe beams. If, in addition to this, thevariability in material strengths of both concrete and steel in the members combine unfavourably, then it is obviously impractical to design the
column stronger than the beam for every situation. Therefore it is specif-ied that,although the column should not attain its ultimate flexural
strength, it shall be provided with sufficient transverse reinforcement so that if it does so, it will have adequate ductility to survive the earthquake.
basic. Should a joint fail, the capacity of all members framing into the
joint is reduced or eliminated.
2 .. 2 REVIEW OF PREVIOUS WORK.
The analysis and design of structures has become increasingly theoretical due presumably to the continued sophistication of the· electronic computer, the speed and accuracy of which is unattainabl~ by the usual design procedures. However, owing to the assumptions and simplifications which must be imposed to enable the program to be adaptable, the accuracy of the results obtainable are .limited by the applicability of these restrictions. Because the pro-parties of many structural materials,. particularly reinforced concrete, are unpredictable. to the required degree of accuracy, there is a need for ex-perimental work t? be performed ·whereby the structure, or a model thereof, is subjected to forces from a simulated earthquake in order to understand the bebaviour of the actual structure8 Since much of the information
re-vealed by tests of this sort are obtained in the post-elastic range it is impractical to perfor-m any experiments on existing structures.
The recommendations developed from the results of tests on small scale specimens are not in many cases applicable to large building members
6·
Therefore the need for tests on full scale component parts of structures becomes evident and may, in some circumstances, provide the only reliable source of information.Mucr.. of the reeearcb wtich has been done on tbe ductility of columns has involved testing of members subjected to flexure and axial load7. When laree srear forces are also present the problem becomes more acute. This is the situation at a beam-column joint where these three forces are all present. Tbe work which has been done to determine the bel>.aviour of interior beam column joints8 cannot be extended to apply to exterior joints because of the special provisions re~uired -·in particular where no spandrel beams
frame into the joint to provide extra confinement.
The most significant work on exterior joints to be attempted was per-formed in the P.O.A. laboratories, a review of which is published by the
A.s.c.E.9.
Results from this paper indicate that for the identical specimensIII and IV, which were designed with the column weaker than the beam, with different column axial loads; the greater column load was more favourable for attainment of the theoretical ultimate moment capacity. Even so the ability·of the specimen to maintain its.ultimate capacity was diminished signifi'oantly after the first post-elastic cycle. The fact that the results from these two specimens did not appear to affect the conclusions to any extent, even though specimen .IV did not at any stage attail'l its theoretical ultimate capacity, indicates that the authors placed little emphasis on the performance of these specimens. The otr.er test specimens and subsequent tests10 showed that the code requirements for these beam-column joints are conservative with regard to transverse reinforcement. It is apparent that a joint, detailed according to accepted design practice, will provide
sufficient ductility and energy absorption to survive a series of post-elastic load cycles.
Megget11 developed the work on exterior joints further when he tested three specimens with different beam anchorage reinforcement in the joint. However the transverse joint reinforcement was insufficient to maintain the
integrity of the joint and brittle failures occurred in all three specimens.
Therefore it is obvious that much work is yet to be done in this field to establish an adequate mechanism for resistance in exterior joints and it is with this purpose that tre experiments reviewed herein have been under-taken.
CHAPTER THREE
TEST SPEr,n/IENS.
3.1 INTRODUCTION;
The pl:ilosophy behind the design of ·the specimens is described in this chaptar. Restrictions from c.ode requirements are outlined in an attempt to srow the reasons upon wbicr m~ny of the decisions are based.
Theoretical predictions of t'be beh:9.viour of the specimens are also formulated so tha·t, subsequently, a comparison can bE1 made with the actual behaviour.
3. 2
DESIOJil OF SPliiCIMEN:
3.2.1 Overall Specifications:
The specimen represented an e:<terior beam column assembly with
only one beam framin,q; into the joint. Al tho'..tgh the dimensions of the assembly .were determined to some extent by tre si.ze and load capacity of the existing
test rig12' it was considered necess':lry to test a full scale specimen to avoid tre possibility of sr.ale effects6· Trerefore tl:e dimensions of tre structural comvonents were a~ lare;e as possible wi t1.• in the limi tatiorw o.f t1·e apparatus.
As well as designing a speci(tlr;m in whin'' the ultimate moments of re-sist3nce of tre ~olumns were less t~an that of tre beam, as dis~ussed in section 1. 3, the detail reflected current trend in construdion in an attemrt to provide information directly a:rplicahle to practical conditions.
The strength properties of the matt'3rials used throughout tl-e design
concrete f' c
=
4,000 psi steel fy=
45,000 psi.3. 2. 2 Size and Flexural Reinforcement of Membertu
3. 2. 2. 1 · Column:
The dimensions of the column were the most important criteria when selecting representative sizes and a
15"
x15"
square column was considered to be the optimum size.The restrictions on flexural reinforcement in columns13 stipulates t:':lere must be at least four bars for tied columna so that
o.
01 <Pt<o.o8
Taking this into account, the column was
15"
x15",
with four1-!
in. diameter bars symmetrically placed, giving p=
0.0206.For t}lis column
=
.370 kips.The earthquake provisions for lateral confining steel5' apply only to columns where
Nu
>
o.
4Nb == 148 kips.Therefore the load N
=
148 kips was the minimum load on the column through-out the test.The test specimen with applied loads is shown in Fig. 3.1.
However, with the intended load arrangements, since the horizontal ¢
reactions, H, must be equal, only equal moments could be generated in the column. That is, from Appendix B,
11
12
t
t
0$
failure
" 6
1-0
+-'
u
cu
LL 8 10
>-
2
Load
+-'
Runs
-
u :::10
2
[image:30.604.47.536.46.795.2]9
11
... ltl c
0
-
ttl6
-
00::
l
to
failure
12
=·
M uc2=
M uc 1875 kip-in.It was decided that the beam.should have an ultim~te moment of resistance 20% greater than that of tr.e columns to allow for variations in material strengths.
Required Mub 1.20 x 2 Muc
=
4, 500 kip-in.The reinforcing ratio, p, was restricted13 by
~
00<
p <0.50 pby
o.005<P
<
0.023The beam width was 12 in. and the flexural reinforcement, both top and bottom, consisted of four
1t
in. diameter bars in a single layer. The depth of the beam was determined by the required moment capaoi ty. Assuming a steel couple to produce Mub=
4500 kip-inM' ub "' A f s y (d-d')
d-d' = 4200 = 20.35 in.
4.92 X 45
t =
24.6
il)..D:i.mensions of the beam were 12" x 25"~ witb four 1! in. diameter bars, top Jnd bottom, giving p = p'
=
0.018.Anchorage requirements5 (calculated in Appendix B), indicate that an ancrorage lengtr. of 32 in. is requj.red of eaor bar measured from the face of the colurpn. However, problems arise in tr.e joint with separate nnchorages for thei top and bottom bars, with 0ongestion in the joint and interlacing of the bars. Altroueh these were by no means insurmountable problems, H was decided· t'ha t l'unning the top :.md bottom steel in a continuous U t'hrough the joint would provide the best solution and also test
the capability of a detail commonly used in
N.z.
construction. The anchor-age length of the bars must transfer to the concrete both the tensile and compressive forces from the top and bottom beam bars. In this specimen, from the details given in AppendixB,
the maximum expected bond stress, u, is given by:u "" ( f s + f' ) s . D
4L
= 1.378
X41,800
X 1,224
X40
=
450
psi.A bond stress of this magnitude should be easily attainable in a well confined joint. However, tbis anchorage detail was four1d to be one of tbe reasons for deterioration in t·he joint during testing, and':'for · UNIT·
4
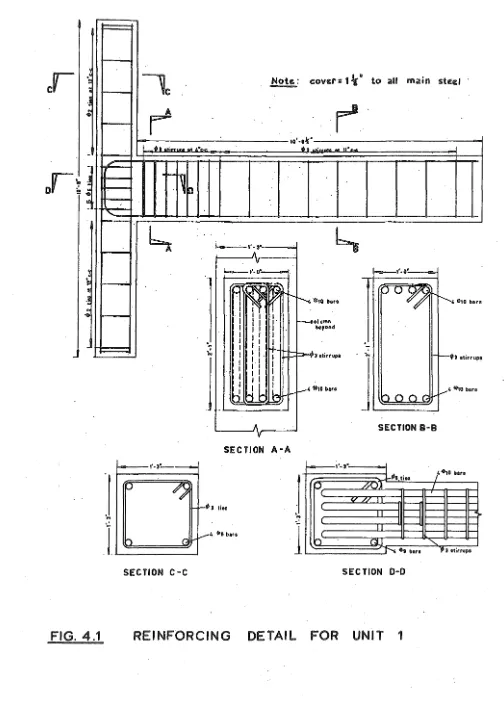
separc. te anchorages for top and bottom bars were used.3.2.3 Transverse Reinforcement:
3.2.3.1
Joint Ties:The transverse reinforcement in the joint is provided to resist both bursting forces from the concrete and shear forces.
Using
i
in. diameter hoops, five were required for confinement within the joint. (see calculations in Appendix B).I
From standard design procedure for joint detailh1g
1091 4,
six~
in.diameter joint ties are required to resist the shear forces. However because of Ue conservative nature of joint srear requirements as evidenced by
previou~
tests9 ' 10' UNIT 1 was provided wi tb fivei·
in. di9meter ,joint tiesto determine tre validity of these ~onclusions. Trese ties were insufficient to prevent deterioration of tre joint of UNIT 1, and so for UNIT 2 seven ~ in. diameter ties were proviiled, which represented 25% more transverse
reinforcement than was theoretically required. Because of the inadequacy, also, of these ties, UNITS
3
and4
bad ninei
in. diameter ties which more than satisfied the more conservative code requirements outlined in Section8. 1.
3.2.3.2 Column Tiest
The original intention of the research was to provide only
' '
suffi0ient column ties to resist the shear force, and to increase the
number of ties in succeeding specimens until adequate ductility was obtained from, the plastic hinges.
Sinoethe concrete was capable of resisting the applied shear force only nominal ties were required,in the column. These consisted of* in. diameter ties at 12 in. spacing. This reinforcement was provided for both UlliTS 1 and 2. For mnTS
3
and4
additional confinement was provided byi·
in. diameter ties at 2 in. spacing adjacent to the joint. The spacingincreased to 4 in. and eventually 8 in., further away from the joint, as shown in Figs. 6.1 and 7.1.
3.2.3.3
Beam Stirrups:The minimum shear reinforcement in flexural members means
i
in. diameter stirrups must be provided at6
in. spacing. In all specimens, stirrQps were provided at4
in~ spa~ing close to the joint, to fit con-veniently between the demec studs on the flexural bars. The spacing in-creased to the maximum spacing of 11 in. beyond the demec studs.3.3 THEORETICAL BEHAVIOUR:
3.3.1 Elastic Range:
Much of tte infonnation concerning behaviour of the specimens in
the elastic range is determined from equilibrium artd strain compatibility after the material properties have been established. The calculations are presented in Appendix B with the spe~ific results for eacr specimen included in the relevant chapter.
3.3.1.1 Flexural Crackings
Cracking first occurs in the beam then in the column. The loads at which cracking should theoretically occur are calculated and the effects are shown on the load-deflection relationships.
3.3.1.2 Yield Load:
Once f' had been. established for each specimen, the load at
0
which first yield should occur was determined. In fact, yield,whioh occurs in the column flexural bars, was observed only in UNIT
4.
The theoretical yield load is tabulated for each specimen in Table 8.1 along witr the actual loads obtained.3.3.1.3 Rotations and Deflections:
The elastic rotation of the column is calculated for both the uncracked and cracked sections and compared in Table
8.3.
Deflection at the end of the beam is :considered to be contributed to by rotation of theI
I
columrl and bending of the beam. This is shown on the load-deflection re-la tionsh ips.
The theoretical deflected shapes at the peaks of the elastic load runs are shown diagrammatically in each chapter and compared with the actual
i
shapes obtained. Joint distortion, which can have a considerable effect on the deflection of the structure was not considered in the theoretical pre-dictions. Its effent then becomes apparent when theoretical and actual values of deflection are compared.
3.3.).3
Steel Strains:The strains in the flexural reinforcement are calculated by elastic theory for the first run of loading in each direction and compared with the recorded strains on the figures of strain distribution in each chapter.
3.3.2 Post-Elastic Range •
.Although UNITS 1 , .2, and 3 do not yield in flexure, the response to the applied load is similar to what would be expected and althougt not strictly correct it is oon'venient to refer to the "elastic" and -"post-elastic" portion of each load run.
3.3.2.1
Ultimate Load:16
The ultimate loads for each specimen are calculated in Appendix B, and tabulated in Table
8.2
for comparison witp actual maximum loads obtained.3.3.2.2
Rotational Ductility:For the design specimen the ductility available can be deter-mined from consideration of the rotations at ultimate and at first yield. It has been suggested1 that although the ultimate concrete strain is gen-erally taken as 0.003, for confined concrete a more realistic figure would be 0.01. This means that provided the concrete is well confined the theoret-ical maximum rotational ductility fGctor attainable is giv~n, by .Appendix
B,
asHowever tre performance of the specimens, witt the exception of UNIT
4,
confined. The ductility factors for post-elastic load runs are computed using the method outlined by Bennett el al15 and tabulated in each chapter.
3.4
EARTHQUAKE LOADING REPRESENTATIOK&
3.4.1 Rate of Load Application:
Statio cyclic loading was applied to the end of the beam by means of screw jacks to simulate the high intensity reversals imposed by an 'earth-quake. Although earthquake loadings are dynamic in character, it has been shown16 that the strength and energy absorption characteriestics of reinforced concrete members are increased witb increased speed of loading, and, i7 that static tests can satisfactorily predict the structural response of reinforced concrete structures to earthquakes. Consequently it appears conservative to use static loading as a basis for testing seismic specimens.
3.4.2 Loading Sequence:
The load sequence applied was adjusted slightly depending on the performance of the individual specimens. However the sequence took tte
gen~ral form as shown in Fig. 3.2. The initial runs 1,2, and
3
were toestablish the stiffness of the structure. in its uncracked and cracked states. Runs
4
and5
subjected the specimen to deformations which would be expected during a major earthquake, which were followed by two elastic runs to deter-mine the stiffness and general performance after the earthquake. The remain-ing cycles were to demonstrate the response and ductility of tre structure durinp a second major earthquake.CHAPTER FOUR
UNIT 1
4.1 INTRODUCTION3
The overall performance of the first specimen is described in this chapter and account is given of the behaviour and stress distribution of reinforcing components of the structure. The way in whiob the stiffness deteriorated under continued load applica·tion leading to eventual failure of the specimen is also described.
4.
2 DETAIL OF REINFORCEMENTsThis specimen, desie;ned as described in section
3.1,
had reinforcement details as shown in Fig.4.1.
The joint hoops were sufficient for confinement according to ACI
318 - 71
and were theoretically capable of resisting 83~ of the joint shear force at theoretical ultimate. The column had only nominal ties outside the joint region.4. 3
GE}I'ERAL .PERFORMAN.CE:The cracks in the joint, wlci~r appeared early in the loading sequence, widened considerably, indicating large stresses in tre joint ties, even during tl~e ini ti3l elastic cycles. Tbe widU and number of cranks increased during subsequent cycles until eventually the cover concrete became ineffect-ive.
Most of the joint ties reached yield stress during Run 2 and were
obviouBly inadequate to resist both the shear forces in the joint and
burst-.
ing forces from the column core. Failure ~ubsequently occurred primarily
!
·~
•
FIG. 4.1
A
I
SECTION C-C
v
~~·-o·-SECTION A-A
1
...
-~
1
...
1---•'·0"
_oo~
...
~•h otirru o4 ~0 baro
SECTION B-B
J - - - t ' · t '
/.,0
~··· _, tiooP.
/..-QA( / / /
h
t-r-1"
l
") l'"n
'
]'4 olle baro ., 3 otirrupo
SECTION D-D
REINFORCING
DETAIL FOR UNIT 1
[image:38.599.45.549.118.825.2]in the joint regiono The inadequate joint shear :reinforcement allowed tbe diagonal tension cracks to widen, leading to degradation in tr.e joint stiff-ness and the moment :resisting capacity. This premature failure meant that
t~e flexural bars did not yield and the specimen attained only 71% of its computed theoretical ultimate flexural capacity.
The distressed nature of the joint after Run
5
indicated t'tat little infonnation would be provided from application of further elastic cycles and so, during Runs6
and7,
tr.e specimen was taken to its maximum deflection in eaor direction before the test was terminated.·4.4
BEHAVIOUR OF FLEXURAL REINFORCEMENT:All strain measurements were taken by DEI\IEC gauges as explained in Appendix A.
4.4.1
Column Bars:Apart from inconsistencie$ resulting from the effects described in section A.
5. 4,
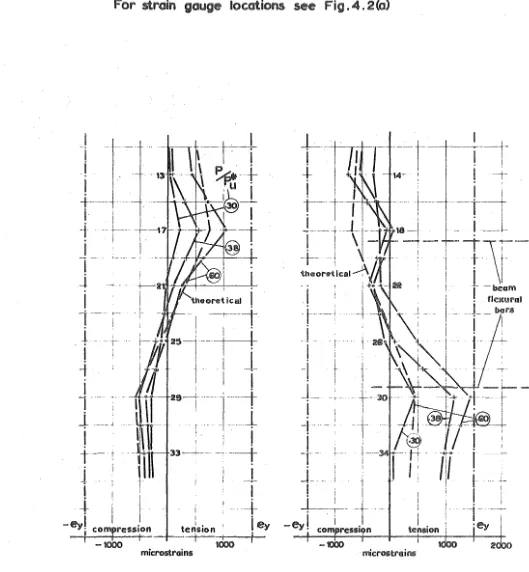
the recorded strains in the bR.rs were generally consist-ent with theoretical predictions for cyclic loading (see Figs. 4.2 (a) and4.
2 (b)).Strain readings on tre more reliable outer column bars (the two furthest from tbe beam) indicated stresses of approximately
35
ksi in eac~ bar at maximu:n load. This stress must be dissipated within the ,jo.int, by bond with tre concrete, over a distance of about 12 in., representing a bond stress, u, .r>;iven byDf s u
=
4L
= 1. 12~
4
X X 12 32000,= 820 psi
-- t-
f--,
II
I
I 13 ; -\t
·-· tI.
i
'
iI
I
. l II !
I
'
I
-t- ..
29-:
:»
-ey~ comju·euion
-tooo 1000
microstrains
13
17 18
21 22 I
25 26
l
29:r
33 I -+strain gauge location -f
•
1
·-I
_,.
-o - a -+ 14·-Run 1
"-Run 2 o-Run 3
&-Run 4 +-Run 5
beam flexural
. . I .
21
. I .
I
bll:ll'lll .
. . I . ,
·-___
.~.,...._-I
I
t
t~nsion
'e
2000
FIG. 4·2 (a) THE DISTRIBUTION OF STEEL STRAINS IN COLUMbl
[image:40.600.44.549.69.816.2]For strain gouge locations see Fig. 4.
2(a)I
i·
I I+ . -·
L--• i
I
~---
-!-I
i-- ;--'
-
~----+-
--1
-t
I
1'
l-L ---;
I
t--:
. i
j_
i
I 1+
I
l
:
-eul
.
1 . ,I
_J_
!
"; compressaon tensaon ·
...-t-r ---1000+1 -+1
--+--·-t---r,doo--+--microstrains
-~---+--1
I
18-+
-+-22
[image:41.602.38.567.112.684.2]The maximum bond otress s·: ecified by the M:I for ultimate atrength design
. 13
is 800 psi ' which is not difficult to acheive in a region which is well confined. However, these bars were not adequately confined to witrstand tr.e S)litting stresses induced by the cyclic loading, and vertical cracks down the back sides of the column during Run
4
gave evidence of parti3l bond fan ure.4.4.2
Beam Bars:The strain distributions for these bars, shown in Figs.
4.3
(a) and4.3
(b) were as expected with the steel providing the tensile force and the majority of the compressive force beinc ·resisted by the concrete.The readings of strain taken in the column at gauge locations
37
and42
were obtained fromi
in. diameter studs3
in. long, which were too flexible to produce consistently accurate results as is evident from tre distributions shown at these locations.4.5
BEHAVIOUR OF TRANSVERSB REINF'tlR~MENT:Strain measurements were again taken by DE~AE~ gauges on tre ties, Y>ow-eve:r only a genernl idea of tre be'~-.aviour of the ties ~ould be deduced since tbe aecuracy of tre strain readings was influenced by tr.e bowing of tr.e ties, as explained in section A.
5. 4.
1.4.5.1
~olumn Ties:The
!
in. diameter ttes provided only minimal resistance in shear and confinement, however for the msjority of the test when the failure was confined to t.he joint, they were rwt required since the concrete resisted all the :Jl:ear. Once cracking exte11ded ouhdde the joint region, the irJade,luacy of tr~ese ties was clearly demonstrated. Tbe level of strain mainly reflected the diversification of cracking :i.r1 the column, since37 38 39 40 41 42
-·
. ·-Run
1strain
-~~oc-Run
2
gauge
-o
o-Run
3location
- a&-Run
4
43 44 45 46 47 48
-+
+-Run
5
37 38 40 42
column
beam
-.500
- -- r - - - - -1000
FIG. 4.3(a) THE DISTRIBUTION OF STEEL STRAINS IN BEAM FLEXURAL BARS IN UNIT 1 [FOR DOWNWARD LOAD RUNS]
[image:43.602.46.545.61.684.2]25
For strain
gauge
locations see Fig .
4.
3
(a)#
Top 10. Bars
d--.'--·--
c.2 Ill -500 Ill
-
. ===-=-.
t
~~ 0
u
37 38 3~ 40 41 -42 Ill
c::
column
I
beam·e
....
Ill43
,.
44 45 46 47 48 .~e
E
I
I
c::-~ Ill
c:: 4.1
+'
500
1000
26
FIG.
4.4
UNIT 1 ON LOAD
RUN
6
FIG.4.5
BUCKLING OF COLUMN
FLEXURAL
BARS
tl-e readin&; generall;y sYowed at least yieJ d strain wrerever a cr·ack crossed the gauge location on a tie.
The inability of ttese ties to prevent buckling of tbe column f1exural bars in tte compression region, As s~own by Figs.
4.4
and4.5,
indicated that they would be tmsatisfactory i f required as lateral confining steel in the column.4.5.2
Joint Ties:C D
I
I
1I
2I
3I _.
strain gauge locations
on joint-· ties
-·---·-Run
1-~---~-Run
2
-o---o-
Run 3
- A -
--A-
Run 4
- + - _;_._
Run
5
Average· of Readings
C ·and
DI
.
27
I
5-Back of Column
1000 3000
mic:rostrains
1000 2000 3000
.ey
I
4000
-4000
I
I
--- ----+i _, ____ _
---· ---·--t··-.. I
I \. I '
I
- - + - - - i - -0 - - - 0 -
---~---+-;}49
~\t---·-0/-+
, ___
--~----~
I -------~
I
5000
Load)
UpFIG. 4.6(a) THE DISTRIBUTION OF JOINT TIE STRAINS AT BACK OF COLUMN IN UNIT 1
Readings A
I
s ---! ____
--tp ---·
-a{.- --- - -- . ----, ,,I
/P,• \
~
'
-...I
I'\j·\~:-
-~ -- • . --\- uJ
I----~V '\.A -~
I
~,
i ' h lI ...._ • '\ "
-' - i
~A--j ~~1~1-
I~~--
I / , .iE?:9
l
I 1 I _f
r
"'
i II I I I -6 -·
~
- ---~--
- jl·"f_,·'{\
i
. ... \ I
- -
·--+- ___
'X -·- .... - ..---- - - 4
I .
I ---.
I I 2 I I 3 I I 4 I I 5
4000 3000 2000 1000
microstrai IU Side of Column
3000 2000 1000
&y.
I
-0 J -0·
I
I.1'
l·l -\-
l+2 2\ - \
i .. .
i
-~--+
. ) -
I 4-3 3. I I
I
~f ~~ ~+4
4!
-!
_i..,, ·
:
.L.
-1+s
5I
I
l
I " '&. I ' "t. I '0. L~
"l--~-~~~- ~-l-). +
-I U __
. L ...
{~/1 ______L
1000
2000-microstrains
1000
ley
I \ I_-+-.o .
-0---2000
1 \
-l~'-"
i
-- - \'
.
-
'
I
,
--
%tc·,T·J·-I
'I ' .
' /rt®l-
~--~- I I !
i I ! I . -
-f·-I . -f·-I f. -0---t·-o -- -+ -- - I
1 + - i •
I
Loa~~
DownLoa~
Up)
FIG. 4. 6 (b) THE DISTRIBUTION OF JOINT TIE STRAINS AT SIDE OF COLUMN IN UNIT 1
greater amount of bending,. for downward load, than tbe lower ties would
I
be due to them either resisting a la;rger force or having less restraint for the imposed force. This is caused by the type of failure which occurred in this opecimen, and results in the opposite distribution for upward load runs.
r;.'he actual strain rendings at the back of the ties, as srown in Fig. 4.
7
(a) demonstrate tbe symmetrical curvature of each tie caused by tl1e interr;al forces in tre column core~ The strain along the sides of the ties, shown in Fig. 4. 7 (h) indicat.e a difference. in curvature, as explained in section A.5.4, rather thana
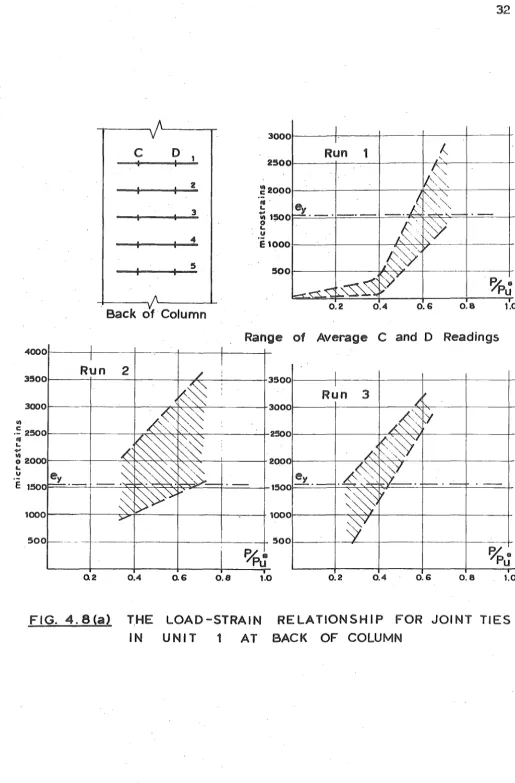
non-uniform stress along the tie.Figs. 4.8 (a) and 4.8 (b) show how the strain in tbe ties increases witb increase in applied load. for each load run. The effect that the bow-ing of the ties has on the readings is clearly shown in Run 1. At 40%
of the theoretical ultimate load tbe bowinr- of the ties appeared to be negligible, the strain readings being caused by minor diagonal tension
cracking in tt.e joint. As. tbe cracks openr::~, the ties picked up more strain untH eventually, due to a combination of >1;1·ds, and internal cracking
caus-ine, expansion of the column core, tbe strdn readir;i?.'S increased considerably.
4.5.3
Beam Stirrups:Al trough tl,ese were instrumented in this specimen, only minor flexural cracks formed .in t'be beam resul tin-s in the beam stirrups being virtually unstressed.
4. 6
DEFORII'u\TIONS:Load\
Down~
--=:-l---
---t.~----·
...I . . . _
-
~-*~: . ----x--
...
·---·~--- · ·---·~--- i · · ·-I
f=
+ ·
-
-·----·-
-)(----x-
-·-·-·-·--! I
:
-
->t---~-
-
..
_
_ --; *
'
::::n ::...~----><-I
-~·
____
"""""',..._.,.,....·~·-
..,_
.
---~-.k~-1
9 10
li) c cu L. +" li) 0 L. u
E
-·---·-Run 1
-.:---)(-Run 2
-o--
-o-Run
33000. 2000 1000 3000 2000 1000 3000 2000 1000 3000 2000 tOOO Load
--·-·-·~~---- -r·-·-·~~----
-r---r----
-1 .
---
-r---,-
--~--4-..::--.
·-r·-·-l-·-~
-- i -. - .
j-I
---· ·-
---l----
·-·--r·-·-- ·-·--r·-·-- I
. ~,
___ _
It+1
-
--1~--=+~-_-·-+·--·
_!_-.-_
-t----i- .
9 10
FIG. 4.7 (a) THE DISTRIBUTION OF STEEL STRAINS
ON
BACK OF JOINT TIES IN UNIT 1
-~1---c--·
,,
-
+ -
'. . ' I
- ' - [ ___ ' I
. ! ' I
-~-::::-·~1-·---
...,
~- --~-...:;:..:::4~--.
-~--=-.::
=F
II)
c
·-
roL.
+'
II)
0
L.
u
E
3000
2000
1000
3000
:woo
1000
5 6
3000
2000
-
--~+---+---~
-·-t-·-·-·1-·-__ :_t---:
~-=- ~t:::
__
i-
---1-3000
I 2000
1000
· · -... ~,, ..
-·+·-,-1 '
!
I
FIG. 4. 7 (b) THE DISTRIBUTION OF STEEL STRAINS 0N SIDE
OF
JOINT TIES IN UNIT 132
I
I'
t,
Run
1
I'·
('·
;;'"
',,,''"'-,ey
-·1
:~.~ ·,, '·'
...:..
.
.
..,....,..."-_
·
-t'
"
',,',
·<:Y
'~"'
·,
. ..,_~.,:;<<'"
i'-<Y
-~"\:
~~~
i:--yy
~·
'7p~
Back of Column
_,
0.2 0..4 0.6 0.8 1.0
. Range of Average C and D Readings
0 J I
1-Run
3;"'
0
!;''
''
~y.A." _..,
0 ',
"
f<>~</'
0
/..'
r:··<·,"
~"·
~~
ey
t0-.:~
...
- · -
._,
~·- ·
t - · -·
-"<">"~
<~~~
0 ...
'
~y
0
'%·
Pu~--~r---~F---~----~~~100
I
.
-·---~-j---J---<-~-4
50~J
IQ2 0.4 0.6 0.8 1.0 0.2 0.4 0.6 0.8 1.0
FIG. 4. 8 (a) T,HE LOAD-STRAIN
IN UNIT 1 AT
[image:51.599.43.558.31.813.2].. -· ..
---/'---A 8
Side of Column
0.2 0.4 0.6
33
2000~--~~---+---+-;~-r----~
~
15F~~·=·=-4·
----'·---·-+---~_,___-+--·- 00
0.2 0.4 0.6 0.8 1.0
Range of Readings A and B