Going Concern Prediction of Iranian Companies by Using
Fuzzy C-Means
Mahdi Moradi1, Mahdi Salehi2*, Hadi Sadoghi Yazdi3, Mohammad Ebrahim Gorgani4
1
Associate Professor of Accounting, Ferdowsi University of Mashhad, Iran
2
Assistant Professor of Accounting, Ferdowsi University of Mashhad, Iran
3
Associate Professor of Computer Science, Ferdowsi University of Mashhad, Iran
4
East Oil and Gas Company, National Iranian Oil Company, Teheran, Iran Email: *[email protected]
Received September 7, 2012; revised October 10, 2012; accepted October 17, 2012
ABSTRACT
Decision-making problems in the area of financial status evaluation have been considered very important. Making in- correct decisions in firms is very likely to cause financial crises and distress. Predicting going concern of factories and manufacturing companies is the desire of managers, investors, auditors, financial analysts, governmental officials, em- ployees. This research introduces a new approach for modeling of company’s behavior based on Fuzzy Clustering Means (FCM). Fuzzy clustering is one of well-known unsupervised clustering techniques, which allows one piece of data belongs to two or more clusters. The data used in this research was obtained from Iran Stock Market and Account- ing Research Database. According to the data between 2000 and 2009, 70 pairs of companies listed in Tehran Stock Exchange are selected as initial data set. Our experimental results showed that FCM approach obtains good prediction accuracy in developing a financial distress prediction model. Also, in effective features determination test the results show that features based on cash flows play more important role in clustering two classes.
Keywords: Going Concern Prediction; Fuzzy C-Means
1. Introduction
The empirical literature of going concern prediction has recently gained further momentum and attention from financial institutions. Academicians and practitioners have realized that the problem of asymmetric information between banks and firms lies at the heart of important market failures such as credit rationing and that im- provement in monitoring techniques represents a valu- able alternative to any incomplete contractual arrange- ment aimed at reducing the borrowers’ moral hazard [1]. Traditionally, there are two major research trends in fi- nancial distress prediction. One is investigating the situa- tion of failure to find the symptoms [2-4]. The other is comparing the prediction accuracy of the diverse classi- fication methods [5-6]. This study belongs to the second type of research. Among financial distress forecasting methods, discriminant analysis was the dominant method for predicting corporate failure from 1966 until the early part of the 1980s [7-9]. It gained wide popularity due to its ease of use and interpretation. However, both linear and quadratic discriminant analyses are sensitive to de- viation from multivariate normality [10]. During the 1980s,
the method was replaced by the probit [11] and logit methods (logistic regression model) [12], especially, the logit model. These two models does give a crisp rela- tionship between explanatory and response variables of the given data from a statistical viewpoint and do not assume multivariate normality, but the probit model as- sumed that the cumulative probability distribution must be standardized normal distribution, while the logit model assumed that the cumulative probability distribution must be logistic distribution. Since the 1990s, neural networks have been the most widely used techniques in developing quantitative bankruptcy prediction [13], in particular, the approximation or classification powers of the MLP trained by the backpropagation algorithm [14]. Many studies compared the neural networks backpropagation algorithm with the statistical methods and found neural networks backpropagation outperforms the other statistic methods, such as Multivariate Discriminant Analysis (MDA) [15]. Neural networks have recently been em- ployed to extract rules for solving fuzzy classification problems [16]. In particular, the Radial Basis Function Network (i.e., RBFN), have been widely used in a large number of fields, such as classification problems [17], function approximations [18] and management sciences.
*
Actually, the approximation or classification powers of the MLP trained by the backpropagation algorithm and RBFN are determined by the number of hidden nodes. In fact, the performance of backpropagation MLP is further influenced by the number of hidden layers. Additionally, an RBFN is functionally equivalent to a zero-order Su- geno fuzzy inference system under some conditions. In addition, it was proven that the zero-order Sugeno fuzzy inference system could approximate any nonlinear func- tion on a compact set to an arbitrary degree of accuracy under certain conditions. However, if a phenomenon un- der consideration does not have stochastic variability but is also uncertain in some sense, it is more natural to seek a fuzzy functional relationship for the given data, which may be either fuzzy or crisp. It is proposed the quadratic interval logit model combining logit and quadratic inter- val regression models. The result demonstrates that the quadratic interval logit model is superior to the logit model. The logit model, the quadratic interval logit mod- el, the back propagation MLP and the RBFN model all have their own advantages and limitations [19].
Literature Review
Sun and Li [20] used weighted majority voting combina-tion of multiple classifiers for FDP, and introduced an integration strategy with subject weight based on neural network for bankruptcy prediction. They all generated diverse classifiers by applying different learning algo-rithms (with heterogeneous model representations) to a single data set, and concluded that to some degree FDP based on ombination of multiple classifiers was superior to single classifiers according to accuracy rate or stability. The most used machine learning technique is the neural network model, trained by the back-propagation learning algorithm (, whose prediction accuracy outperforms sta- tistical models including Logistic Regression (LR), Lin- ear Discriminant Analysis (LDA), Multiple Discriminant Analysis (MDA) and other machine learning models, such as k-Nearest Neighbor (k-NN) and decision trees. In addition, the Back-Propagation Neural Network (BPN) model can be used as the benchmark for financial deci- sion support models. Chen and Du [21] found that pre-diction performance for the clustering approach is more aggressively influenced than the BPN model and the BPN approach obtains better prediction accuracy than the Data Mining (DM) clustering approach in developing a financial distress prediction model by applying different learning algorithms (with heterogeneous model repre-sentations) to a single data set, and concluded that to some degree FDP based on combination of multiple clas- sifiers was superior to single classifiers according to ac- curacy rate or stability. Tsai and Wu [22] ensemble mul-
tiple classifiers which were diversified by using neural networks on different data sets for bankruptcy prediction, and their experimental results showed that multiple neu- ral network classifiers did not outperform a single best neural network classifier, based on which they consi- dered that the proposed multiple classifiers system may be not suitable for the binary classification problem as bankruptcy prediction.
The purpose of this paper is to apply Fuzzy Clustering Means in going concern prediction model. Fuzzy C- Means (FCM) clustering is one of well-known unsuper- vised clustering techniques, which allows one piece of data belongs to two or more clusters.
The paper is organized as follows. In the next section we review the Fuzzy C-Means (FCM). The proposed method is explained in Section 3 with some experiments. In Section 4 we present our findings. Final section in- cludes the conclusion.
2. Technical Background
Fuzzy C-Means
FCM theory is the perfect one among many fuzzy clus- tering analysis methods that are effective for pattern re- cognition; details can be seen in reference. Considering a sample set X = {x1, x2, ···, xN}, xi Rs, which is requir-
ed to be divided into C categories; the aim of FCM is to obtain each category’s clustering centre vc by minimizing
the weighed square sum of inner-cluster error.
Therefore, its objective function is as follows
2
1 1
, 1
C N m
m cn cn
c n
J U V d m
,
, (1)With constraints
1
1
0 1, 1 , 1
0< < ,1 ,
1, 1 cn N cn n C cn c
c C n N s.t. N c C
n N
(2)where m is the smoothing parameter, which makes it effective from hard c-means to FCM. This parameter controls the sharing degree among each fuzzy categories, bigger m will result in more fuzzy division, or results in more definitive division. Its experimental range is 1.1 - 5;
μcn is subjection of xnto the cth category; dcnrepresents
the distance between xnand vc,which often is measured
in Euclidean space. Ji(U, V)—the objective function
2
Tcn n c n c n c
iterative computations using following Equations (4) to (6), whose astringency has been proved
2 11 ln 1 / 0, 1, n m C tn cn c n I Φ d d c I c In Φ
(4) where
| 1 , 0
1, 2, ,
n cn n n
I c c C d I C I (5)
1
1
1 N mxn
c N m c
n cn n v
n (6)3. Research Method
In this section we explain process of data collection and features selection, then we review fuzzy clustering algo- rithm.
3.1. Data Collection and Preprocessing
The database used in this study was obtained Iranian Stock Exchange. Based on the background of Iranian listed companies, the criteria whether the listed company is Specially Treated (ST) by Iranian Stock Exchange is used to categorize financial state into two classes, i.e. normal and distressed. The most common reason that Iran listed companies are specially treated by Iranian Stock Exchange is that they have had accumulated loss to Stockholders’ equity more than half (Iran Business law 141 Article). ST companies are considered as companies in financial distress and those never specially treated are regarded as healthy ones. This experiment uses financial data two years before the company is specially treated, which is often denoted as year (t-2) in many literatures. The data used in this research obtained from Iran Stock Market and Accounting Research Database. Ac- cording to the data between 2000 and 2009, 70 pairs of companies listed in Tehran Stock Exchange are selected as initial data set. The preprocessing operation to elimi- nate missing and outlier data is carried out: 1) Sample companies in case of missing at least one financial ratio data were eliminated. 2) Sample companies with finan- cial ratios deviating from the mean value as much as three times of standard deviation are excluded. After eli- minating companies with missing and outlier data, the final number of sample companies is 120.
3.2. Feature Selection
The current study employs 24 variables. The ratios ini-
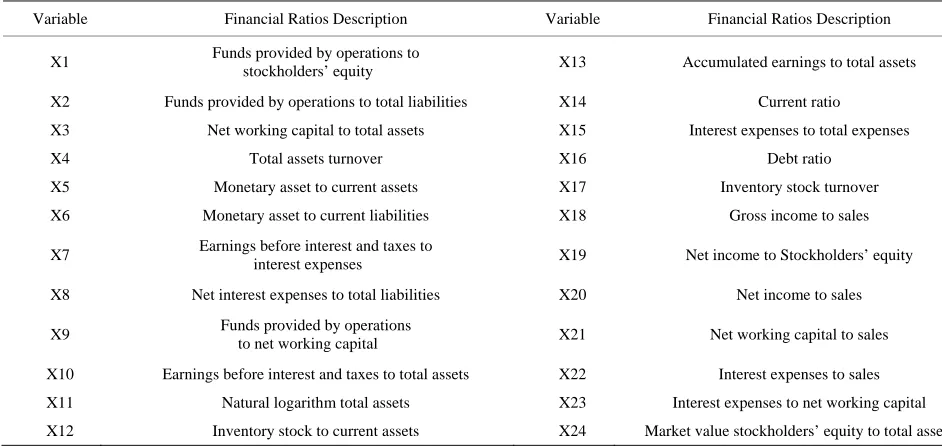
tially selected allow for a very comprehensive financial analysis of the firms including financial strength, liquid- ity, solvability, productivity of labour and capital, vari- ous kinds of margins and profitability and returns. Al- though, in the context of linear models, some of these variables have small discriminatory capabilities for de- fault prediction, the non-linear approaches used here can extract relevant information contained in these ratios to improve the classification accuracy without compromis- ing generalization. Feature selection is an important issue in bankruptcy prediction, as in other problems where a large set of attributes is available, since elimination of useless features may enhance the accuracy of detection while reducing the amount of time for processing the data. Due to the lack of an analytical model, the relative importance of the input variables can only be estimated through empirical methods. A complete analysis would require examination of all possibilities, for example, tak- ing two variables at a time to analyze their dependence or correlation, and then taking three at a time, etc. This, however, is both infeasible and not error free since the available data may be of poor quality in sampling the full input space. 24 financial ratios covering profitability, activity ability, debt ability and growth ability are se- lected as initial features (see Table 1).
3.3. Designing Fuzzy Clustering Algorithm
One another data mining techniques is fuzzy clustering. In fuzzy clustering the fuzzy separation is performed that is each data with one degree of belong is belonged to each cluster. In actual circum stances Fuzzy clustering is very more normal than hard clustering because existing data are not farced fully to depend to one of the clusters in different clusters border and they are separated with a belong degree ranging from 0 to 1, indicating their relation belong. Fuzzy set theory in clustering analysis is focused on fuzzy clustering based on fuzzy relations and objective functions.
With regard to provided explanations the fuzzy clus- tering algorithm is stated as follow (Table 2).
4. Research Findings
Fuzzy clustering algorithm has been designed so that in the first stage the data are divided to two distinctive clusters. For this purpose, this technique will determine effective features that cause to the best clustering. De- termining effective features is performed by using acci- dently selection method which it test different fea- tures1000 times to achieve to the best clustering. This algorithm is started with determining an effective feature. On the other hand, this features result in the best cluster-
Table 1. Definition of predictor variables.
Variable Financial Ratios Description Variable Financial Ratios Description
X1 Funds provided by operations to
stockholders’ equity X13 Accumulated earnings to total assets
X2 Funds provided by operations to total liabilities X14 Current ratio
X3 Net working capital to total assets X15 Interest expenses to total expenses
X4 Total assets turnover X16 Debt ratio
X5 Monetary asset to current assets X17 Inventory stock turnover
X6 Monetary asset to current liabilities X18 Gross income to sales
X7 Earnings before interest and taxes to
interest expenses X19 Net income to Stockholders’ equity
X8 Net interest expenses to total liabilities X20 Net income to sales
X9 Funds provided by operations
to net working capital X21 Net working capital to sales
X10 Earnings before interest and taxes to total assets X22 Interest expenses to sales
X11 Natural logarithm total assets X23 Interest expenses to net working capital
[image:4.595.55.526.102.325.2]X12 Inventory stock to current assets X24 Market value stockholders’ equity to total assets
Table 2. Fuzzy clustering algorithm.
a) Initial amount is consist of determining the number of clusters, amount of repeat parameter, error maximum, belong functions for one data on all clusters.
b) k = 1 is clustered by one feature. Features 1 to 24 are aligned randomly.
c) Centers of clusters and covariance matrix are determined by using relevant equivalents.
d) Amounts of data belong degree to clusters are determines according to related equivalents.
e) The repeat from b) to d) as many as 1000 times to reach the objective function to the best local minimum then algorithm is stopped.
f) Selecting effective better k based on the best result of pre-stated criteria.
g) Increasing k and repeating from second step until k = 24 is obtained.
Summary of research results based on selection feature have been provided in the following Table 4:
Will continue until to select all of the features for clustering; summary of results from testing algorithm based on fuzzy clustering by using data in the year of occurring financial distress(t year) have been provided in the following exhibit(Table 3).
where:
α1: Number of accurately categorized total going con-
cern data/on number of total going concern data.
α2: Number of total accurately categorized financial
insolvent data/number of total financial insolvent data The nearer the being different of two clusters is the
better the clustering it is and there is maximum non- conformity between two clusters. As it is seen between selecting 3 features to 12 features it have been obtained identical percents. That is, in this algorithm selection of two and twelve features for clustering have similar re- sults and there is not any difference between degrees of non-conformity between two clusters.
β1: Number of incorrect data in the first group/number
of total incorrect data and
β2: Number of incorrect data in the second group/
number of total incorrect data.
As it is observed the feature 7 (Earnings before interest and taxes to sales) have played an important role in ca- tegorizing data and it result in better clustering. With feature 7 the two fuzzy clusters is generated, 93.33 per- cent (α1) have conformity with going concern group and
100 percent (α2) have conformity with financial insolvent
and all errors (β1) is related to going concern cluster.
Now, another test is performed to determine degree of conformity for each data (firms) by Iran Business Law Article 141. In this stage, the percent of conformity for two generated clusters by fuzzy clustering with two clus- ters that have been categorized to going concern firms and insolvent groups according to article 141 is tested. It could be determined their belong percent to each groups.
Table 3. Determining effective features by using fuzzy clustering in the year of financial distress.
Number of item Effective features Degree of non-conformity
1 7 0.9643
12 17, 2, 12, 11, 15, 10, 9, 4, 20, 23, 7, 8 1.000
18 20, 22, 23, 1, 4, 14, 2, 15, 17, 9, 8, 7, 5, 6, 3, 18, 12, 21 0.9298
[image:5.595.55.541.103.190.2]24 All 0.8966
Table 4. Conformity between fuzzy clusters and clusters of Business Law Article 141 in financial distress year.
6 α1 α2 β1 β2
7 0.9333 1 1 0
17, 2, 12, 11, 15, 10, 9, 4, 20, 23, 7, 8 0.9167 1 1 0
20, 22, 23, 1, 4, 14, 2, 15, 17, 9, 8, 7, 5, 6, 3, 18, 12, 21 0.95 1 1 0
All 0.9667 1 1 0
until number of selection features would arrive to 18 features for clustering which it indicate 95% of data have classified correctly. Hereafter as the number of features increase, the percent of classification is improved until the clustering with all features result in going concern data classification with 96.67%. Clustering by this data based on belong percent of each data result in a classifi- cation type which generate higher conformity by using Article 141. Belong percent of data indicate amount of data dependence in the group.
Results from algorithm test based on fuzzy clustering by using data in the year before financial distress (t-1 year) have provided in the following Table 5.
[image:5.595.56.539.215.301.2]Another test was performed to determine the confor- mity for each data (firms) by Business law Article 141. In this test the firms are classified to going concern and insolvent groups. It could be determine their belong per- cent to each of groups. Summary of research results based on selection feature have provided in the following
Table 6.
As it is observed the feature 9 (operating cash to working capital) have played a more important role in data classification and it resulted in better clustering. So that as features increase the percent of classification have not improved but gradually as features increase the clus- tering have improved until clustering with 15 features result in to classify going concern data with 98.8%.
Results from algorithm lest based on fuzzy clustering by using data in two years before financial distress (t-2 year) have been provided in Table 7.
Now we perform another test to determine amount of conformity between data (firms) by Business Law Article 141. In this test, firms are classified to going concern and insolvent group. It could be determine their belong per- cent to each of the group. Summary of research results
based on selection feature have provided in Table 8. As it is observed feature 2 (operating cash to total li- abilities) is the first important feature for classifying data and it result in better clustering. Results of research indi- cated that as feature increase the percent of classification is improved until (as long as) clustering with 15 features result in the best classification for going concern data with 96.67%. However, here after as the features increase and including inefficient features to the model result of clustering is reduced.
Generally results of algorithm test based on fuzzy clus- tering indicated that the model in classifying going con- cern data using data in the year of financial distress, one year and two years before financial distress 96.67%, 83.44% and 77.34% of going concern firms classify cor- rectly respectively and in classifying financial insolvent data this model classify data in the year of financial dis- tress, one and two years before it 100%, 100% and 98.32% respectively.
Also, in effective features determination test the re- sults show that in the year of financial distress the fea- tures based on leverage ratios (Earnings before interest and tax deduction to interest cost) result in to separate two classes better than before and the more far from in- cident year we are the more important role the features bases on cash flows (operating net cash flows to working capital or total debt) in clustering tow classes will play.
Geometrical Describe of Belong Percent for Each Firms to Going Concern and Insolvent Classes
Table 5. Determining effective features by fuzzy clustering in the year before financial distress.
Number of item Effective features Degree of non-conformity
1 9 0.9231
4 3, 9, 15, 23 0.9608
15 9, 15, 3, 23, 18, 6, 13, 4, 5, 12, 14, 19, 2, 8, 11 0.8519
[image:6.595.58.539.102.191.2]24 All 0.8519
Table 6. Conformity for fuzzy clusters with clusters generated based on business law article 141 in the year before financial distress.
Effective features α1 α2 β1 β2
9 0.94 1 1 0
3, 9, 15, 23 0.9273 1 1 0
9, 15, 3, 23, 18, 6, 13, 4, 5, 12, 14, 19, 2, 8, 11 0.9818 1 1 0
[image:6.595.57.539.227.314.2]All 0.8344 1 1 0
Table 7. Determining effective features by using Fuzzy clustering in two years before financial distress.
Number of item Effective features degree of non-conformity
1 2 0.9667
4 2, 12, 14, 8 0.9677
15 19, 22, 14, 4, 1, 2, 3, 12, 5, 6, 10, 8, 18, 15, 20 0.8769
24 All 0.7538
Table 8. The results of the study.
Effective features α1 α2 β1 β2
2 0.8387 0.8667 0.55 0.45
2, 12, 14, 8 0.9355 0.95 0.5714 0.4286
19, 22, 14, 4, 1, 2, 3, 12, 5, 6, 10, 8, 18, 15, 20 0.9677 0.90 0.25 0.75
All 0.7734 0.9832 0.96 0.04
to insolvent class with 20% and in some data it is ob- served that data (z) belong to going concern class with 56% and to insolvent with 44%. Especially this problem matter in the data basses which data of two classes are selected based on pair sampling. To better understand of this problem the belong percents of data is indicated geometrically on the following graphs in the financial distress occurrence year. Horizontal axis show the num- ber of firms and vertical axis show the percent of belong for data to its class. Financial distress data are in the right side and going concern data are in the left side in this axis. The closer the data in its class to top horizontal axis or down are, their percent belong to its class is greater. As it is observed in the above Graphs 1-4 as features increase in the year of financial distress the two classes
have separated significantly and with high belong percent are belong (dependent) to their class.
Belong percent of data in year before financial distress in the following Graphs 5-8 states that as features in- crease the separation is performed more desirably and data show more belong to their class.
Belong percent of data in two years before financial distress in the following Graphs 9-12 is indicated.
Graph 1. Belong percent of data with one feature.
Graph 2. Belong percent of data with twelve features.
Graph 3. Belong percent of data with eighteen features.
Graph 4. Belong percent of data with all features.
Graph 5. Belong percent of data with one feature.
Graph 6. Belong percent of data with four features.
Graph 7. Belong percent of data with fifteen features.
Graph 9. Belong percent of data with one feature.
Graph 10. Belong percent of data with four features.
Graph 11. Belong percent of data with fifteen features.
Graph 12. Belong percent of data with all features.
is observed the use of all variables in two years before financial distress have resulted in data would belong to a class with lower belong percent. On the other hand, it could be concluded that the more far from the year of financial distress we are some features have not neces- sary efficiency for classification and use of all variables would not be correct in the model.
5. Conclusion
Results of algorithm test based on fuzzy clustering indi- cate that the model would cluster going concern data by using data in the year of financial distress, one two years be for financial distress with 96.67%, 85.19% and 77.74% respectively for going concern firms. Also, in effective features determination test the results show that in the year of financial distress incident the features based on profitability (earnings before interest and tax deduction to interest cost) would result in to separate tow classes more desirably and the more far from year of financial distress we are, the features based on cash flows (operating net cash flow to working capital or total debt) play more important role in clustering tow classes.
6. Suggestions for Future Researches
To guide students and researches interested to research in the area of subject of present thesis the following sugges- tions is provided:
1) Sort the data based on their belong percent in fuzzy clustering to three or four classes.
2) Use different fuzzy clustering method and deter- mine belong percent of samples based on different tech- niques to going concern and insolvent classes.
3) Compare this method with other techniques such as neural networks method or nearest.
4) Use combination of other variables (different an- other classes of financial ratios) for designing the model.
REFERENCES
[1] J. C. Bezdek, “Pattern Recognition with Fuzzy Objective Function Algorithms,” Plenum Press, New York, 1981. doi:10.1007/978-1-4757-0450-1
[2] W. H. Beaver, “Market Prices, Financial Ratios and the Prediction of Failure,” Journal of Accounting Research, Vol. 6, No. 2, 1968, pp. 179-192. doi:10.2307/2490233 [3] C. Cortes, and V. N. Vapnik, “Support Vector Networks,”
Machine Learning, Vol. 20, No. 3, 1995, pp. 273-297. doi:10.1007/BF00994018
[4] M. J. David and P. W. Robort, “Support Vector Domain Description,” Pattern Recognition Letters, Vol. 20, No. 11-13, 1999,pp.1191-1199.
doi:10.1016/S0167-8655(99)00087-2
pp. 59-65. doi:10.1016/S0950-7051(02)00053-9
[6] K. J. Kim, “Financial Time Series Forecasting Using Sup- port Vector Machines,” Neurocomputing, Vol. 55, No. 1-2, 2003, pp. 307-319.
doi:10.1016/S0925-2312(03)00372-2
[7] E. Altman, “Financial Ratios, Discriminant Analysis and the Prediction of Corporate Bankruptcy,” Journal of Fi- nance, Vol. 23, No. 4, 1968, pp. 589-609.
doi:10.1111/j.1540-6261.1968.tb00843.x
[8] E. Altman, “A Further Empirical Investigation of the Bankruptcy Cost Question,” Journal of Finance, Vol. 39, No. 4, 1984, pp. 1067-1089.
doi:10.1111/j.1540-6261.1984.tb03893.x
[9] W. H. Beaver, “Market Prices, Financial Ratios and the Prediction of Failure,” Journal of Accounting Research, Vol. 6, No. 2, 1968, pp. 179-192. doi:10.2307/2490233 [10] B. Sowmya and S. Bhattacharya, “Color Image Segmen-
tation Using Fuzzy Clustering Techniques,” IEEE Indicon Conferences, Chennai, 11-13 December 2005, pp. 41-45. [11] M. E. Zmijewski, “Methodological Issues Related to the Estimated of Financial Distress Prediction Models,” Journal of Accounting Research, Vol. 22, No. 1, 1984, pp. 59-82. doi:10.2307/2490859
[12] J. Ohlson, “Financial Ratios and the Probabilistic Predic- tion of Bankruptcy,” Journal of Accounting Research, Vol. 18, No. 1, 1980, pp. 109-131. doi:10.2307/2490395 [13] Y.-S. Ding, X.-P. Song and Y. M. Zen, “Forecasting Fi-
nancial Condition of Chinese Listed Companies Based on Support Vector Machine,” Expert Systems with Applica- tions, Vol. 34, No. 4, 2008, pp. 3081-3089.
doi:10.1016/j.eswa.2007.06.037
[14] H. Li, J. Sun and B.-L. Sun, “Financial Distress Predic-
tion Based on OR-CBR in the Principle of K-Nearest Neighbors,” Expert Systems with Applications, Vol. 36, No. 1, 2007, pp. 643-659.
[15] K. R. Solvenia, “Fuzzy C-Means Clustering and Facility Location Problems,” Proceeding of Artificial Intelligence and Soft Computing, Palma de Mallorca, 2006, p. 544. [16] M. J. Tax David and P. W. Duin Robert, “Support Vector
Data Description,” Machine Learning, Vol. 54, No. 1, 2004, pp. 45-66.
[17] F. E. H. Tay and L. Cao, “Application of Support Vector Machines in Financial Time Series Forecasting,” Omega, Vol. 29, No. 4, 2001, pp. 309-317.
doi:10.1016/S0305-0483(01)00026-3
[18] Sun and X. Hui, “Financial Distress Prediction Based on Similarity Weighted Voting CBR,” Advanced Data Min- ing and Applications, Vol. 4093, 2006, pp. 947-958. doi:10.1007/11811305_103
[19] H. Li and J. Sun, “Majority Voting Combination of Mul- tiple Case-Based Reasoning for Financial Distress Predic- tion,” Expert Systems with Applications, Vol. 36, No. 3, 2009, pp. 4363-4373. doi:10.1016/j.eswa.2008.05.019 [20] Sun and H. Li, “Data Mining Method for Listed Compa-
nies’ Financial Distress Prediction,” Knowledge-Based Sys- tems, Vol. 21, No. 1, 2008, pp. 1-5.
doi:10.1016/j.knosys.2006.11.003
[21] W. Chen and Y. Du, “Using Neural Networks and Data Mining Techniques for the Financial Distress Prediction Model,” Expert Systems with Applications, Vol. 36, No. 2, 2009, pp. 4075-4086. doi:10.1016/j.eswa.2008.03.020 [22] C. H. Tsai, “Financial Decision Support Using Neural