Rolling Fatigue Test of Large-Sized UHPC Member for
Cable Stayed Bridge
Jeong-Rae Cho, Young Jin Kim, Jong Sup Park, Eun Suk Choi, Won Jong Chin Structural Engineering Research Division, Korea Institute of Construction Technology, Goyang-Si, South Korea
Email: [email protected]
Received August 7, 2012; revised September 8, 2012; accepted September 18,2012
ABSTRACT
Recently, research strives to apply Ultra High Performance Concrete (UHPC) to large-sized structures owing to its re- markable mechanical performance and durability compared to normal concrete. The Korea Institute of Construction Technology proposed SuperBridge800, an edge girder type UHPC cable stayed bridge with central span of 800 m, through its detailed design. The bridge is designed to be erected through the connection of precast UHPC segments. The precast UHPC segment is monolithically composed of one ribbed deck slab and edge girders at each side. The connec- tion between the precast segments is achieved by steel bars at the edge girders and by UHPC cast-in-place wet joint at the slab. Despite of the outstanding mechanical performance of UHPC, the fabrication of large-sized members is a dif- ficult task since UHPC hardens faster than normal concrete and requires a special curing process. Therefore, the con- structability of large-sized UHPC segment should be secured to achieve SuperBridge800. Besides, the performance of the connection between segments should also be guaranteed, especially in terms of the fatigue performance of the UHPC cast-in-place joint, which constitutes a weak point. To that goal, two half-scaled UHPC segments are manufac- tured and the constructability is examined based on fabricating a large-sized UHPC member by connecting those seg-ments with respect to the design conditions. This study conducts rolling fatigue test on the so-fabricated large-sized UHPC member. Rolling fatigue test is carried out up to 2 million cycles considering actual vehicle load at each center and quarter points of the member. The test results confirm that the service limit state is satisfied.
Keywords: UHPC; Cable Stayed Bridge; Rolling Fatigue Test; Large-Sized UHPC Member
1. Introduction
Following the growing demand for large-sized structures with outstanding durability, the use Ultra High Perfor- mance Concrete (UHPC) is gradually increasing owing to its high strength, high durability and remarkable workability. The Korea Institute of Construction Tech- nology (KICT) implemented the development of UHPC since 2007 through the SuperBridge200, an in-house project, and is currently leading research for the applica-tion of UHPC to cable stayed bridge [1-4]. As part of this project, SuperBridge800, a UHPC cable stayed bridge with central span of 800 m, has been proposed through an optimal design process. SuperBridge800 was designed as an edge girder type cable stayed bridge as shown in
Figure 1, and the analysis of its cost effectiveness re-
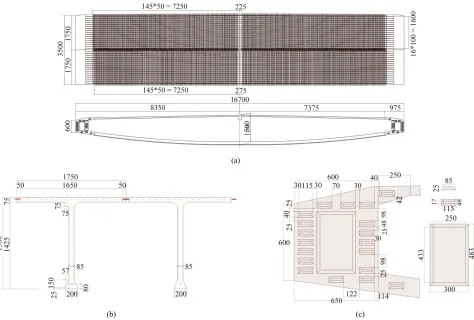
vealed that it is more cost-efficient by 23.3% than In- cheon Bridge, a steel cable stayed bridge with central span of 800 m [1]. The superstructure of SuperBridge800 is constituted by precast UHPC segments. The precast UHPC segment is monolithically composed of one ribbed deck slab and edge girders at each side. One segment is 3.5 m long, 33.4 m wide and 3 m high. The segments are
lifted using a crane before being fastened by steel bars disposed at the edge girders. Finally, the segments are designed to be connected through UHPC cast-in-place joints in the decks.
(a)
[image:2.595.62.536.391.711.2](b)
Figure 1. Rendering of SuperBridge800. (a) Schematic draw- ing; (b) Precast segments.
firmed that the service limit state is satisfied.
2. Test Program
A half-scale prototype of the large-sized UHPC member was fabricated by connecting two precast UHPC seg- ments constituting the superstructure of SuperBridge800. The precast UHPC segment is formed by monolithic composition of the ribbed deck slab with the edge girders at each side. As shown in Figure 2, the slab has dimen-
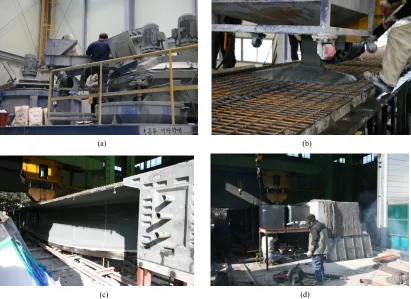
sions of 16.7 m × 1.75 m × 75 mm, and the rib of the deck slab fulfilling the function of cross beam has a thickness of 75 mm and a height varying from 1.425 m to 0.6 m. The edge girders have cross-sectional dimensions of 0.6 m × 0.6 m with shear keys disposed on the surface. The fabrication process of the prototype is explained in details in Cho et al. [5] and is summarized here. The segments were manufactured considering their precast fabrication in factory. For the first segment, after the in- stallation of the steel form, the UHPC produced in batch plant is placed and subjected to standard curing for UHPC at high temperature of 90˚C (Figures 3(a)-(c)).
The second segment is fabricated by the same process as the first segment, except that match casting is applied for the shear keys of the edge girders(Figure 3(d)). After
(a)
(b) (c)
(a) (b)
[image:3.595.93.504.85.384.2]
(c) (d)
Figure 3. Fabrication of precast UHPC segments. (a) UHPC batch plant; (b) Casting UHPC into first segment; (c) First seg-ment at completion; (d) Form of 2nd segseg-ment for match casting.
completion of the two segments, the tendons disposed at the bottom of the deck ribs are prestressed. Finally, the edge girders of the two segments are connected by steel bars and the slab-to-slab wet joint is achieved by cast- in-place UHPC using a small moving mixer (Figures 4(a) and (b)). The cast-in-place UHPC joint with a width
of 100mm is then subjected to steam curing at 70˚C con- sidering the difficulty to realize high temperature curing on site.
As shown in Figure 5, rolling fatigue test was per-
formed up to 2 million cycles at the center point of the completed large-sized UHPC member, followed by 2 million cycles at the quarter point. Figure 6 illustrates
the fatigue test at the center and quarter points. The load of the rolling fatigue test was set to 24 kN considering the actual wheel load of the Korean truck load (DB24 truck) 96 kN and the scaling factor. Loading was applied using the tire of a truck to reflect real conditions (Figure 7(a)). Repeated wheel load was applied according to the
log scale of the fatigue cycle (0, 100, 1000, 5000, 10,000, 20,000, 50,000, 100,000, 500,000, 1 million, 1.25 million, 1.5 million, 1.75 million, 2 million cycles) to evaluate the fatigue performance, followed by 3 series of static load- ing test. For the static loading test, loading was applied up to 24 kN at speed of 8 kN/min and maintained during 5 minutes. Thereafter, unloading was applied at speed of
12 kN/min. Apart from the steel bar connection at the edge girders, the original design of SuperBridge800 scheduled to strengthen additionally the connection be-tween the segments by prestressing the steel bars at the center of the segments. In order to simulate this streng- thening, a steel bar was disposed at the center of the spe-cimen and prestressed by a hydraulic jack (Figure 7(b)).
When performing rolling fatigue test, loss of the pressure applied to the steel bar occurs owing to the char- acteristics of the hydraulic jack. In order to recover this loss, jacking was re-executed prior to the static loading test to maintain the planned prestressing level of the steel bar.
Strain gages, displacement gages and crack gages were installed to measure the responses of the specimen. Fig-ure 8 presents the layout of the 9 displacement gages and
4 crack gages of which measurements are used in this paper. A total of 6 LVDT-type displacement gages were installed with 3 units at the bottom of the ribs of each segment, and three ring-type displacement gages were installed at the center of the specimen. In addition, 4 crack gages for cast-in-place wet joints were arranged at the center as shown in Figure 8.
The UHPC applied for the fabrication of the specimen was mixed according to the mix proportions listed in
Table 1 and the design strength is 180 MPa. Ordinary
[image:4.595.103.494.85.222.2]
(a) (b)
[image:4.595.197.400.252.362.2]Figure 4. Connection of segments. (a) Steel bar connection of edge girder; (b) Slab-to-slab cast-in-situ wet joint.
Figure 5. Conceptual drawing of rolling fatigue tests.
(a) (b)
Figure 6. Rolling fatigue tests. (a) Test at center point; (b) Test at quarter point.
(a) (b)
[image:4.595.102.497.389.533.2] [image:4.595.99.491.563.707.2]SE CL NW
Seg2-A
OU-A
Seg2-B
OU-B
Seg2-C
OU-C
Ring-type gauge(OU)
LVDT
Seg1-A Seg1-B Seg1-C
C1 C2
C3 C4
Crack guage Rib
UHPC wet joint
Edge girder
Segment2
Segment1
Edge girder
(a)
[image:5.595.86.510.77.418.2]
(b) (c)
[image:5.595.56.541.472.497.2]Figure 8. Installation of displacement gages. (a) Layout of displacement gages; (b) Displacement gages at girder side; (c) Ring-type displacement gage at center point.
Table 1. Mix proportions (in weight ratio).
Item W/B Cement Silica fume Sand Filler Superplasticizer Steel fiber Relative ratio 0.2 1 0 - 0.3 1.1 0.3 0.018 Vf = 2%
reactive powder. The physical and chemical properties of these two materials are arranged in Table 2. Sand with
density of 2.62 g/cm3 and average grain size smaller than
0.5 mm is used as fine aggregate. Coarse aggregate is not used. Polycarbonate high performance water-reducing agent (density 1.01 g/cm3, dark brown) is adopted as su-
perplasticizer. The filler is a material composed of parti- cles with granulometry smaller than 30 μm and is classi- fied into 5 classes according to the size. Besides, steel fiber is applied with a volume ratio of 2%.
Compressive test, direct tensile test, notched flexure tensile test and unnotched flexure tensile test were con- ducted as material tests. Table 3 arranges the average of
the measured values in each test. The detailed test results per test sample are explained in Cho et al. [5]. In the ta-ble, it can be verified that the performance of the UHPC of the cast-in-place wet joint located in the connection of the slabs and subjected to steam curing at 70˚C in order to reflect the condition on site is relatively lower than the
UHPC of the segments for which standard high tempera- ture curing was performed. The strength level of the wet joint concrete relative to that of the concrete of the seg- ments reaches 57% - 58% for the compressive strength, 25% - 26% for the direct tensile strength, 45% - 46% for the flexure tensile strength of the unnotched flexure spe- cimen, and 67% for the flexure tensile strength of the notched flexure specimen.
3. Test Results
3.1. Rolling Fatigue Test at Center Point
In the rolling fatigue test at the center point of the proto- type, no particular phenomenon was observed apart the occurrence of cracks at 20,000 cycles between the central slab and the wet joint. Figure 9 plots the static loading
Table 2. Physical and chemical properties of cement and silica fume.
Chemical composition (%) Material Specific surface area (cm2/g) Density (g/cm3) Ignition loss (%)
SiO2 Al2O3 Fe2O3 CaO MgO SO3
OPC 3413 3.15 1.40 21.0 6.4 3.1 61.3 3.0 2.3
[image:6.595.58.539.191.457.2]SF 200,000 2.10 1.50 96.0 0.3 0.1 0.4 0.1 -
Table 3. Strength test results of specimens (average).
Test Result Segment 1 Segment 2 Wet joint
Compressive test Compressive strength 207 MPa 210 MPa 121 MPa
Crack strength 9.43 MPa 8.77 MPa 3.19 MPa Direct tensile test
Tensile strength 13.64 MPa 12.89 MPa 3.40 MPa
Unnotched flexural tensile strength test Flexural tensile strength 21.71 MPa 21.28 MPa 9.85 MPa
Notched flexural tensile strength test Flexural tensile strength 20.62 MPa 20.64 MPa 13.896 MPa
(a) (b)
Figure 9. Load-deflection curve at center point wet joint (OU-B)—rolling fatigue test at center point. (a) Initial state (0 cycle); (b) After 2 million rolling fatigue cycles.
stalled at the connection between the segments at the bottom of the prototype. Slight loss of the performance occurs after 2 million cycles but residual deformation under loading is not observed in the load-deflection curves.
Figures 10-12 plot the peak displacement correspond-
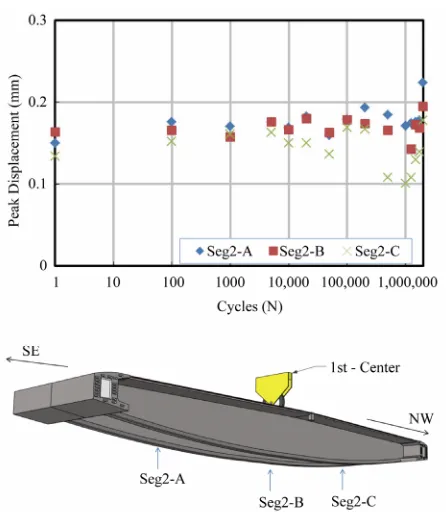
ing to the maximum load of 24 kN measured by the in- stalled 9 displacement gages in the static loading test per loading cycle. In the static loading test, the maximum load of 24 kN is the value instructed to the actuator and the actual measured load varies by about 1 kN. Accord- ingly, the results are normalized with reference to 24 kN. The displacements measured by the gages installed in the segment ribs and shown in Figures 10 and 11 do not
exhibit significant difference in the longitudinal direction of the member with a range of 0.3 - 0.4 mm (Segment 1) or 0.1 - 0.2 mm (Segment 2). The difference in the values between the segments can be attributed to the effect of eccentricity.
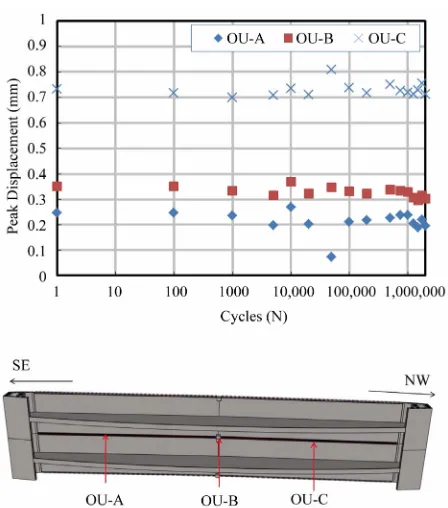
The range of the displacement measured at the bottom
of the deck in Figure 12 is 0.7 - 0.9 mm at the center and
0.3 - 0.4 mm at both ends. This difference indicates that the load is distributed from the loading point through the deck. The displacement gage OU-B of Figure 12 pro-
vides the most meaningful value as being the displace- ment of the deck below the loading point. It can be seen that the peak value at initial state is 0.7 mm and becomes 0.85 mm after 2 million cycles, which shows the occur- rence of very slight loss of the performance.
Figure 13 arranges the peak values measured by the
crack gages installed in the cast-in-place wet. There is no indication that the crack width increases with larger num- ber of rolling fatigue cycles.
Figure 10. Lateral displacement of segment 1—rolling fa-tigue test at center point.
Figure 11. Lateral displacement of segment 2—rolling fa-tigue test at center point.
0.2 mm (specified for precast concrete in Korean design code) shows also that the prototype exhibits sufficient serviceability with crack width of 0.07 mm.
3.2. Rolling Fatigue Test at Quarter Point
The rolling fatigue test at the center point was perform-
Figure 12. Displacement of slab-to-slab wet joint—rolling fatigue test at center point.
Figure 13. Crack width with respect to fatigue loading cy-cle—rolling fatigue test at center point.
ed up to 2 million cycles by moving the loading from the center point to the quarter (1/4) point. Figure 14
plots the static loading test results at initial state and after 2 million loading cycles. In the figure, the dis- placement corresponds to the value measured by the ring-type displacement gages installed at the connec- tion between the segments at the bottom of the proto- type. No loss of the performance is observed after 2 million cycles and residual deformation under loading is not found in the load-deflection curves.
Figures 15-17 arrange the peak displacement corre-
[image:7.595.60.283.363.619.2] [image:7.595.315.535.365.507.2](a)
[image:8.595.312.533.82.336.2](b)
Figure 14. Load-deflection curve at quarter point wet joint (OU-C)—rolling fatigue test at quarter point. (a) Initial state (0 cycle); (b) After 2 million rolling fatigue cycles.
Figure 15. Lateral displacement of segment 1—rolling fa-tigue test at quarter point.
Figure 16. Lateral displacement of segment 2—rolling fa-tigue test at quarter point.
segment ribs and shown in Figures 15 and 16 do not
exhibit significant difference in the longitudinal direction of the member with a range of 0.2 - 0.4 mm.
The range of the displacement measured at the bottom of the deck in Figure 17 is 0.7 - 0.8 mm at the quarter
point below the loading point, 0.3 - 0.4 mm at the center, and 0.2 - 0.3 mm at the 3/4 point, which indicates that the load is distributed from the loading point through the deck. The displacement gage OU-C of Figure 17 pro-
vides the most meaningful value as being the displace- ment of the deck below the loading point. It can be seen that the peak value at initial state is 0.7 mm and is 0.7 mm after 2 million cycles, which shows the absence of the loss of performance.
Figure 18 arranges the peak values measured by the
crack gages installed in the cast-in-place wet joint. In the test at quarter point, the crack gages C3 and C4 are dis- carded from the analysis due to dysfunction. In the figure, there is no indication that the crack width increases with larger number of rolling fatigue cycles.
[image:8.595.60.285.458.704.2]Figure 17. Displacement of slab-to-slab wet joint—rolling fatigue test at quarter point.
Figure 18. Crack width with respect to fatigue loading cy-cle—rolling fatigue test at quarter point.
4. Conclusion
The Korea Institute of Construction Technology pro- posed SuperBridge800, an edge girder type UHPC cable stayed bridge with central span of 800 m, through its detailed design. The bridge is designed to be erected
through the connection of precast UHPC segments. The precast UHPC segment is monolithically composed of one ribbed deck slab and edge girders at each side. The connection between the precast segments is achieved by steel bars at the edge girders and by UHPC cast-in-place wet joint at the slab. In this study, two half-scaled UHPC segments were manufactured and a large-sized UHPC member was fabricated by connecting those segments with respect to the design conditions. Rolling fatigue test was conducted on the so-fabricated large-sized UHPC member to investigate the fatigue performance of the connections. Rolling fatigue test was carried out up to 2 million cycles considering actual vehicle load at each center and quarter points of the member. The test results confirmed that the service limit state is satisfied.
5. Acknowledgements
This research was supported by a grant from a Strategic Research Project (Development of Design and Construc- tion System Technology for Hybrid Cable Stayed Bridge) funded by the Korea Institute of Construction Techno- logy.
REFERENCES
[1] Korea Institute of Construction Technology, “Develop-ment of Design and Construction System for Hybrid Ca-ble Stayed Bridge,” 2010.
[2] Korea Institute of Construction Technology, “Design Specific Technology for Ultra High Performance Con-crete,” 2010.
[3] Korea Institute of Construction Technology, “Develop-ment of Deck Systems for Hybrid Cable Stayed Bridge,” 2010.
[4] C.-H. Lee, W.-J. Chin, E.-S. Choi and Y.-J. Kim, “An Experimental Study on the Joints in Ultra High Perform-ance Precast Concrete Segmental Bridges,” Journal of the Korea Concrete Institute, Vol. 23, No. 2, 2011. pp. 235-
244. doi:10.4334/JKCI.2011.23.2.235
[image:9.595.61.287.376.528.2]