A Generic Framework for Grid-Enabled
Visualisation and Computational Steering, and its
Characterisation.
A Thesis
Submitted to the Office of Graduate Studies
of
University of Dublin, Trinity College
in Candidacy for the Degree of
Doctor of Philosophy
by Ronan Watson
Declaration
I, the undersigned, declare that this work has not previously been submitted as an
exercise for a degree at this, or any other University, and that unless otherwise stated,
is my own work.
Ronan Watson
Permission to Lend and/or Copy
I, the undersigned, agree that Trinity College Library may lend or copy this thesis
upon request.
Ronan Watson
Acknowledgments
I would like to thank Dr. Brian Coghlan, my supervisor, for all of his help, advice
and encouragement. After five years under his supervision I am still amazed at his
supervisory skills and above all at the patience he has shown me throughout my time
here. This work would not have been possible without him.
I would like to extend my gratitude to the past and present members of the
Com-puter Architecture and Grid Group for making the last five years a thoroughly enjoyable
experience. I would especially like to mention Eamonn and John for putting up with
all of my questions and for giving me their attention and expertise no matter how busy
they were. Their consistent good humoured nature has made working here a pleasure
(even with John’s terrible terrible jokes).
I particularly thank my parents. They have always emphasised education as an
important part of my life and have gone to enormous lengths in providing me support,
both personal and financial, to make this possible. I thank them for their relentless
encouragement and interest in everything I do, and I hope that this is finally the end
of the financial part :)
Thanks to all those who generously gave permission and assistance that enabled
benchmarking on resources in Grid-Ireland, UK NGS, CSIC, NIKHEF, PSNC and
EGEE, see Section 5.6, and to Science Foundation Ireland for its financial support.
Finally, I would like to thank all my friends. I would not have been able to get
through it all without their support and loyalty. Special mention though must go to
Marc, Mark, Claire and As’ad. Their friendship has been one of the most important
things to me in the last few years, and hopefully, for many more years to come. Thanks
guys.
Abstract
This thesis presents a generic framework for grid-enabled visualisation and computa-tional steering that is amenable to characterisation using mathematical models based on benchmarked resources. The models enable designers, providers or users to select the most suited interactive computational steering and rendering resources available to them on the Grid. The framework for visualisation aims at giving a greater perfor-mance than a desktop computer can provide, achieved at a cost much cheaper than a CAVE, while allowing simultaneous usage by multiple users.
This framework provides multiscale multimodal multiuser grid-enabled visualisation and has the potential to assist the penetration of the Grid into the domain of advanced interactive 3-d visualisation and geographical rendering from a user’s desktop. While the existing desktop tools and techniques for interactive visualisation are of a general purpose nature and offer limited compute and data intensive graphical visualisation and interactivity, this framework leverages the power of the grid to offer: 1) more advanced visualisation 2) real time interactivity with the rendered content; 3) and integration with key data intensive graphical applications that would benefit from the use of the grid. The framework is conceptual, to allow users to analyse and/or design for their own specific application, but a comprehensive example application has been implemented.
To enable the characterisation of a framework for grid-enabled visualisation and computational steering, a mathematical model is constructed to help identify the com-plicated relationships between the variables of the architectures and systems used. The creation of this model allows for it to be used in a number of ways, from the prediction of application performance on a grid, the comparison of site and grid performance, to suggesting for grid providers.
Contents
Acknowledgments iv
Abstract v
List of Tables xi
List of Figures xiii
Chapter 1 Introduction 1
1.1 Motivation . . . 2
1.2 Objectives . . . 5
1.3 Contributions of the Work . . . 6
1.4 Overview of Chapters . . . 6
Chapter 2 The Grid and Interactive Visualisation 8 2.1 Introduction . . . 8
2.2 Distributed Computing . . . 9
2.2.1 Middleware . . . 9
2.2.2 Grids . . . 12
2.2.3 Clouds . . . 14
2.2.4 Future Grids-n-Clouds . . . 17
2.3 Workflow Engines . . . 17
2.3.1 Pegasus . . . 18
2.3.2 WebCom-G . . . 18
2.3.3 Kepler . . . 20
2.3.4 Taverna Workbench . . . 20
2.4 Real-Time Rendering . . . 20
2.5 Visualisation and Steering on Grids . . . 22
2.5.1 Visualisation in TeraGrid . . . 23
2.5.3 Cactus . . . 27
2.5.4 GridLab . . . 28
2.5.5 Image-Processing Grid Environment . . . 29
2.5.6 Crossgrid/int.eu.grid Visualisation Technologies . . . 30
2.5.7 Limitations . . . 31
2.6 Interactive Visualisation applications on the Grid. . . 31
2.6.1 Crossgrid Flood Crisis Simulation . . . 31
2.6.2 Crossgrid Blood Flow Simulation . . . 32
2.6.3 int.eu.grid Fusion Plasma Application . . . 33
2.6.4 RealityGrid TeraGyroid Simulation . . . 33
2.7 Visualising the Grid Itself . . . 34
2.7.1 Network Visualisation . . . 34
2.7.2 2-d Network Visualisation applications . . . 35
2.7.3 3-d Network Visualisation applications . . . 36
2.7.4 2-d and 3-d applications for Visualising Grids . . . 37
2.8 Summary . . . 39
Chapter 3 Visualisation Framework for a Grid 45 3.1 Introduction . . . 45
3.2 Multiscale Multimodal Grid Visualisation Framework . . . 45
3.2.1 The Coarse-Scale Simulation Resource example . . . 46
3.2.2 The Mid-Scale Simulation Resource example . . . 47
3.2.3 The Fine-Scale Rendering Resource . . . 47
3.2.4 The Interaction Resources . . . 48
3.3 The Visual Pipeline . . . 48
3.3.1 Computation . . . 48
3.3.2 Rendering . . . 50
3.3.3 Display . . . 50
3.3.4 Interaction . . . 50
3.3.5 Other Activities . . . 51
3.4 VirtualGrid . . . 52
3.4.1 Multimodal Visualisation . . . 53
3.4.2 VirtualGrid Simulation Architecture . . . 53
3.4.3 Mid-scale Simulation Architecture . . . 54
3.4.4 VirtualGrid Run-Time Operation . . . 56
3.4.5 Model Construction . . . 57
Chapter 4 Mathematical Model and Benchmarks for Visualisation
Frame-work Characterisation 61
4.1 Introduction . . . 61
4.2 Statistical Modelling . . . 62
4.2.1 Linear Regression Analysis . . . 63
4.2.2 Markov Chains . . . 64
4.3 Selection of the Statistical Model . . . 66
4.4 Visualisation Framework Characterisation . . . 68
4.4.1 Resource Benchmarking . . . 70
4.4.2 Model Construction . . . 71
4.5 Benchmarks for Framework Characterisation . . . 71
4.6 Benchmarking of Heterogeneous Resources . . . 72
4.6.1 Benchmarks . . . 73
4.6.2 Micro-benchmarks . . . 74
4.7 Summary . . . 76
Chapter 5 Grid Framework Characterisation 77 5.1 Introduction . . . 77
5.2 Example Coarse-scale/Mid-scale Resource Benchmarking . . . 77
5.3 Example Coarse-scale/Mid-scale Model Construction . . . 78
5.3.1 Fastest Fourier Transform in the West (FFTW) . . . 79
5.3.2 FFTW Model Construction (for/on) the Grid-Ireland Coarse-scale/Mid-scale Resources . . . 83
5.3.3 FFTW Model Construction for the EGEE Grid Coarse-scale/Mid-scale Resources . . . 92
5.4 Example Fine-scale Resource Benchmarking . . . 98
5.5 Example Fine-scale Model Construction . . . 105
5.5.1 glxspheres Model Construction for the Grid-Ireland Fine-scale Resources . . . 105
5.6 Summary . . . 109
Chapter 6 Conclusions and Future Work 110 6.1 Introduction . . . 110
6.2 Conclusions . . . 110
6.3 Uses of the Model . . . 112
6.3.1 Specification of a Visualisation Resource Provision . . . 112
6.3.2 User-selection of a Remote Rendering Resource . . . 113
6.4 Contributions of the Work . . . 116
6.5 Summary . . . 117
Bibliography 118 Appendices 133 Appendix A 134 A.1 Previously Published Paper on Visualisation Framework . . . 134
Appendix B 135 B.1 Metrics of selected graphics cards . . . 135
Appendix C 137 C.1 Example .vge XML File . . . 137
Appendix D 139 D.1 GL Core Extensions . . . 139
D.2 Windows GL extensions . . . 140
Appendix E 141 E.1 Correlation . . . 141
E.2 Significance Test . . . 142
E.3 Regression Line Estimation . . . 143
E.4 Confidence intervals in linear regression . . . 145
Appendix F 147 F.1 Benchmarking Results . . . 147
List of Tables
4.1 Sections that discuss resource benchmarking and model construction in
Grid-Ireland and EGEE . . . 73
5.1 Linear regression summary of complex data for 1-d powers of 2 FFTW application executions, with an input size parameter of 2097152 and the
EPDhrystone estimates as the independent variable. . . 84
5.2 Linear regression summary of complex data for 1-d powers of 2 FFTW application executions, with an input size parameter of 2097152 and the
EPWhetstone estimates as the independent variable. . . 84
5.3 Multiple linear regression summary of complex data for 1-d powers of 2 FFTW application executions using the EPWhetstone estimates and
the input size parameter as the independent variables. . . 85
5.4 Linear regression summary of complex data for 1-d powers of 2 FFTW application executions, with an input size parameter of 2097152 and the
EPDhrystone estimates as the independent variable. . . 93
5.5 Linear regression summary of complex data for 1-d powers of 2 FFTW application executions, with an input size parameter of 2097152 and the
EPWhetstone estimates as the independent variable. . . 94
5.6 Linear regression summary of complex data for 1-d powers of 2 FFTW application executions, with an input size parameter of 2097152 and the
EPFlops estimates as the independent variable. . . 94
5.7 Linear regression summary of glxspheres running ongr065.grid.cs.tcd.ie
at a resolution of 1024x768. . . 100
5.8 Multiple linear regression summary of glxspheres running ongr065.grid.cs.tcd.ie
at a resolution of 1024x768 with multiple users. . . 104
5.9 Multiple linear regression summary of glxspheres running ongr065.grid.cs.tcd.ie
List of Figures
1.1 Visualisation Space . . . 3
1.2 Visualisation Space. . . 3
1.3 Single Visualisation Pipeline . . . 4
1.4 Visualisation Space. . . 4
2.1 Cloud Computing . . . 15
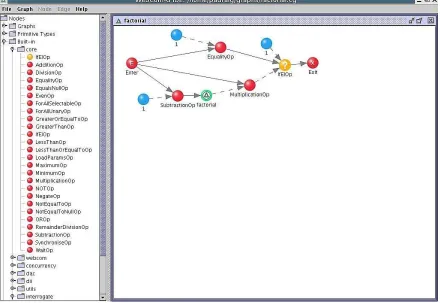
2.2 WebCom-G IDE. Image courtesy of Dr. Eamonn Kenny of the author’s host research group. . . 19
2.3 Kepler IDE showing the setup involved to solve two couple differential equations and the resulting plots. Image courtesy of Dr. John Ryan of the author’s host research group. . . 21
2.4 Taverna IDE showing the workflow set up to retrieve a html web page. Image courtesy of Dr. John Ryan of the author’s host research group. . 22
2.5 ParaView Service on UChicago/Argonne . . . 24
2.6 RealityGrid . . . 25
2.7 The Remote Steering/Visualisation Architecture of Cactus . . . 28
2.8 The general GridLab Architecture. . . 29
2.9 Image Processing Grid Architecture . . . 30
2.10 Crossgrid Flood Crisis Simulation. Image taken from the Flood Crisis Team Decision Support System Presentation [123][124] . . . 32
2.11 Crossgrid Blood Flow Simulation. Image taken from the Surgery Deci-sion Support Application Presentation [125][126] . . . 33
2.12 Different instances of the Fusion Plasma application running on the grid and visualised using MD. Image taken fromFusion Simulations, data vi-sualisation and future requirements for the interactive grid infrastructure [128] . . . 34
2.14 Etherape displaying network traffic. Image taken from Etherape: A Graphical Network Monitor [133] . . . 36 2.15 VISUAL: A 2D visualisation of 80 hours of network data on a home
network of 1020 hosts. Image taken from Home-centric visualisation of
network traffic for security administration [135] . . . 37 2.16 VISUAL: A 2D visualisation of 80 hours of network data on a home
network of 1020 hosts. Image taken from Home-centric visualisation of
network traffic for security administration [135] . . . 38 2.17 VISUAL: A 2D visualisation of 80 hours of network data on a home
network of 1020 hosts. Image taken from Home-centric visualisation of
network traffic for security administration [135] . . . 39 2.18 VISUAL: A 2D visualisation of 80 hours of network data on a home
network of 1020 hosts. Image taken from Home-centric visualisation of
network traffic for security administration [135] . . . 40 2.19 The Spinning Cube of Potential Doom displaying port activity. Image
taken fromInteractively combining 2D and 3D visualisation for network
traffic monitoring [136] . . . 41
2.20 Image taken from Interactively combining 2D and 3D visualisation for
network traffic monitoring [140] . . . 41
2.21 IDtk visualisation of network traffic. Image taken fromA User-centered
Look at Glyph-based Security Visualisation [139] . . . 42
2.22 The 2-d Real Time Monitor application. Image take from Real Time
Monitor [141] . . . 42 2.23 Real Time Monitor from the Active Security Infrastructure. Image
cour-tesy of Dr. Stuart Kenny of the author’s host research group . . . 43
2.24 Example Nagios display derived from I4C. Image take from An
Agent-Based Approach to Grid Service Monitoring [143], courtesy of Dr. Keith
Rochford. . . 44
3.1 Diagram showing the coarse-scale, mid-scale and fine-scale division of
grid resources. . . 46
3.2 The Visual Pipeline of the Multiscale Multimodal Grid Visualisation
Application . . . 50
3.3 Other actions of the Multiscale Multimodal Grid Visualisation
Applica-tion. . . 51
3.5 Selected active gLite sites in an immersive grid world created by the
author. . . 54
3.6 Multiple active gLite sites in the immersive grid world. . . 55
3.7 VirtualGrid, an example use of the multiscale multimodal visualisation
framework. . . 59
3.8 Blender modelling package with Ogre mesh exporter. Snapshot by the
author. . . 60
4.1 Mathematical model producing a list of grid resources most suitable to
the user’s job type and load. . . 61
4.2 Example linear regression graph showing the completion time achieved
at increasing numbers of computations. . . 68
4.3 Example linear regression graph showing the frames per second achieved
at increasing numbers of polygons . . . 69
4.4 Example linear regression graph showing the frames per second achieved
at increasing numbers of polygons from 2 different architecture types. . 70
4.5 Resource benchmarking: For the grid[N], with B benchmarks, where grid[N] has j resource providers. This yields performance estimates E
for each benchmark on every resource on that grid. . . 71
4.6 Model construction: For the application k on grid[N], where grid[N] has j resource providers, only h of which are tested. This yields a performance
model for application[k] on grid[N]. . . 72
4.7 Performance Ontology . . . 74
5.1 Resource benchmarking: For Grid-Ireland, with three (B=3) micro-benchmarks epdhrystone, epwhetstone, epflops, where Grid-Ireland has 8 resource providers. This yields performance estimates E for each
micro-benchmark on every resource on Grid-Ireland. . . 78
5.2 Resource benchmarking: For the EGEE Grid, with three benchmarks epdhrystone, epwhetstone, epflops, where EGEE has 270 resource providers. This yields performance estimates E for each benchmark on every
re-source on EGEE. . . 79
5.3 Model Construction: For the FFTW application on Grid-Ireland, where Grid Ireland has 8 resource providers. Normally only a subset need testing, but with so few providers, all need testing. This yields a
5.4 Completion Time for FFTW Complex Double Precision 1D Transforms
with Powers of 2 Inputs for resources on Grid-Ireland. ps004.grid.cs.tcd.ie
runs a FFTW program which is specifically compiled for the CellBE
ar-chitecture. . . 82
5.5 Estimates of EPFlops for each machine with architecture skew. . . 87
5.6 Estimates of EPFlops for each machine without architecture skew. . . . 88
5.7 Estimates of Dhrystones from each machine . . . 89
5.8 Estimates of EPWhetstone from each machine . . . 90
5.9 Scatterplot of the EPDhrystone estimates against the EPWhetstone
es-timates, showing a linear relationship. . . 91
5.10 Model Construction: For the FFTW application on EGEE, where h is
a subset of all of EGEE’s resource providers. This yields a performance
model for FFTW on every resource on EGEE. . . 92
5.11 Estimates of EPFlops for each machine plotted against FFTW
comple-tion time. . . 95
5.12 Estimates of Dhrystones from each machine against FFTW completion
time. . . 96
5.13 Estimates of EPWhetstone from each machine against FFTW
comple-tion time. . . 97
5.14 Resource benchmarking: For Grid-Ireland, with three (B=1) micro-benchmarks glxspheres, where Grid-Ireland has two fine-scale
visual-isation resource providers. This yields performance estimates E for
the micro-benchmark on every fine-scale visualisation resource on
Grid-Ireland. . . 98
5.15 Frames per second achieved by glxspheres with varying polygon input
size and resolution running on gr065.grid.cs.tcd.ie and vrengine.cs.tcd.ie. 101
5.16 Frames per second achieved by glxspheres with varying polygon input
size and resolution running on gr065.grid.cs.tcd.ie and vrengine.cs.tcd.ie. 102
5.17 Linear regression lines of glxspheres running gr065.grid.cs.tcd.ie and
vrengine.cs.tcd.ie with varying polygon input size and resolution. . . . 103 5.18 Model Construction: For the glxspheres application on Grid-Ireland,
where Grid Ireland has 2 fine-scale visualisation resource providers. This yields a performance model for glxspheres on every fine-scale visualisa-tion resource on Grid-Ireland. . . 106
B.1 Plots of selected graphics cards. . . 136
E.1 Types of correlation. . . 142
E.2 Anscombe’s quartet: All four sets are identical when examined statis-tically, but vary considerably when graphed. Data set from Graphs in Statistical Analysis [180]. . . 143
E.3 The regression line of y onx. . . 144
E.4 Confidence intervals for a0+a1x. . . 146
F.1 EPDhrystone micro-benchmark results from Grid-Ireland. . . 148
F.2 EPWhetstone micro-benchmark results from Grid-Ireland. . . 149
F.3 EPFlops micro-benchmark results from Grid-Ireland. . . 150
F.4 EPDhrystone micro-benchmark results from EGEE. . . 151
F.5 EPWhetstone micro-benchmark results from EGEE. . . 152
F.6 EPFlops micro-benchmark results from EGEE. . . 153
F.7 Completion times of the Complex Data 1-d FFTW runs, for all input sizes. . . 154
F.8 Log of Completion times of the Complex Data 1-d FFTW runs, plotted against log of all input sizes. . . 155
F.9 Scatterplot of the EPDhrystone estimates against the EPWhetstone es-timates, showing a linear relationship. . . 156
F.10 Scatterplot of the EPWhetstone estimates against the EPFlops esti-mates, showing a linear relationship. . . 157
F.11 Scatterplot of the EPDhrystone estimates against the EPFlops esti-mates, showing a linear relationship. . . 158
F.12 Frames per second output from glxspheres running on gr065.grid.cs.tcd.ie, plotted against increasing polygon input sizes, for n users where n=1,2,4,8. 159 F.13 Log of frames per second output from glxspheres running on gr065.grid.cs.tcd.ie, plotted against the logarithm of all polygon input sizes, for n users where n=1,2,4,8. . . 160
F.14 Frames per second achieved by glxspheres with varying polygon input size and resolution running on picolet.cs.tcd.ie and bacchus.cs.tcd.ie. . 161
F.15 The rendered output is sent to picolet.cs.tcd.ie. . . 162
F.17 Frames per second achieved by glxspheres with varying polygon
in-put size and resolution running on gr065.grid.cs.tcd.ie, with the
frame-spoiling VirtualGL option enabled and the rendered output sent to two
desktops, picolet.cs.tcd.ie and bacchus.cs.tcd.ie . . . 164
F.18 Frames per second achieved by glxspheres with varying polygon
in-put size and resolution running on gr065.grid.cs.tcd.ie, with the
frame-spoiling VirtualGL option enabled and the rendered output sent to two
desktops, picolet.cs.tcd.ie,bacchus.cs.tcd.ie and lambrusco.cs.tcd.ie. . . 165
F.19 Frames per second achieved by glxspheres with varying polygon input
size and resolution running ongr065.grid.cs.tcd.ieandvrengine.cs.tcd.ie,
with the frame-spoiling VirtualGL option disabled and the rendered
out-put sent to a user’s desktop. . . 166
F.20 Frames per second achieved by glxspheres with varying polygon
in-put size and resolution running on gr065.grid.cs.tcd.ie, with the
frame-spoiling VirtualGL option disabled and the rendered output sent to two
user desktops. . . 167
F.21 Frames per second achieved by glxspheres with varying polygon
in-put size and resolution running on gr065.grid.cs.tcd.ie, with the
frame-spoiling VirtualGL option disabled and the rendered output sent to three
Chapter 1
Introduction
Grids are used to allow for the secure sharing of resources across institutional and geo-graphical boundaries and for the collaboration of users through Virtual Organisations (VOs). The resources that are shared using Grids include computational power, data storage, instruments and visualisation. Traditionally users would have had to fit the scale of their scientific discovery to the isolated resources to which they had access so as to produce results in an efficient and acceptable time frame. The time spent gaining access to resources and the consequent difficulty in assembling large collabo-rations further constrained science. However projects such as EGEE [1], int.eu.grid [2] and Grid-Ireland [3] represent successful efforts to coordinate Virtual Organisations and their resources across Europe, allowing for physicists, biologists and other scien-tists to access resources that would otherwise have not been available to them and to participate in collaborative science. This provides the users with more time to concen-trate on the scientific problem at hand by reducing the time taken in considering the practicalities of resource availability.
While most of these problems can be solved in a batch submission style, some solutions require computational steering and the visualisation of complex data. Com-putational steering in a Grid environment consists of the timely transfer of results, or partial results, to the user so that they can guide future computations into some area of interest.
1.1
Motivation
With today’s volume of data that is collected and analysed, scientists are turning to the visualisation of this data to help their understanding of results from experiments and computations. This need to visualise large and complex data sets has led to the supply of expensive high performance visualisation workstations and clusters to many universities.
Visualisation Spectrum
The Visualisation Spectrum that will be discussed in this thesis ranges from tightly-coupled systems, like Cave Automatic Virtual Environments (CAVEs) for example, to loosely-coupled systems, like desktop machines. Describing a system as tightly-coupled means that each component in that system depends heavily on one or more other components in that system. If one component fails or is not available it will impact heavily on the system as a whole. Loosely-coupled systems are the opposite in that the components of a loosely-coupled system are not as dependent on each other and therefore the system will not degrade as easily as a tightly-coupled system.
Tightly-coupled systems are usually fast and safe in that the risk of transmission errors is very low. Loosely coupled systems are usually more error prone but much more flexible and scalable.
A Cave Automatic Virtual Environment (better known by the recursive acronym CAVE) is an immersive virtual reality environment where projectors are directed to three, four, five or six of the walls of a room-sized cube. The images projected to these walls are generated by a dedicated high performance visualisation cluster situated close to the CAVE. As CAVEs are tightly-coupled systems their performance is usually very good but unfortunately they are not easily scalable, are very costly and the failure of any one component can greatly affect the overall usefulness of the CAVE.
Desktop machines are loosely-coupled systems and are a cheaper alternative to CAVEs, however they are at the lower end of the spectrum. The performance of a desktop machine in rendering visualisation software will greatly depend on the quality of its video card. However the desktop machine has advantages over a CAVE in that it can be scaled to include more desktops and in doing so improve robustness.
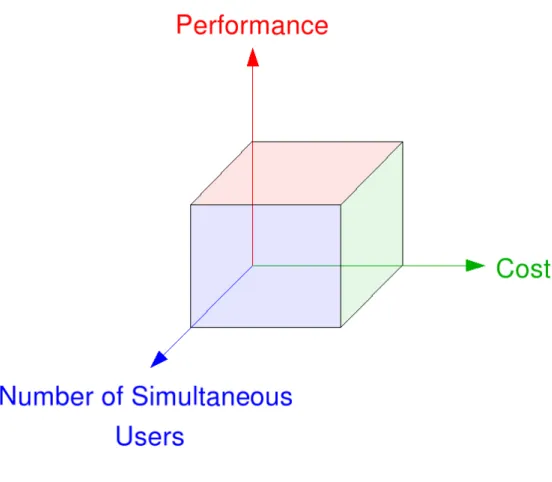
Visualisation Space
tightly-and loosely-coupled systems that are in the visualisation spectrum described in the previous section.
Figure 1.1: Visualisation Space
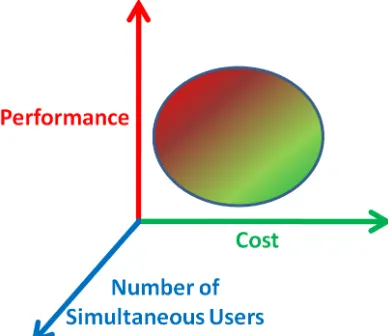
Figure 1.2(a) demonstrates a visualisation space that is far from ideal as the perfor-mance/cost envelope yields a high cost per increment of performance. Preferably, one wants the performance/cost envelope to yield a low cost per performance increment as in Figure 1.2(b).
(a) Non-ideal Performance versus Cost. (b) Ideal Performance versus Cost.
Figure 1.2: Visualisation Space.
The Visualisation Pipeline
model section of the pipeline is implemented in software running on CPUs and the
[image:22.595.224.418.540.708.2]rendering stage of the pipeline is typically performed on the GPU. Therefore the overall performance of a visualisation workstation is determined by the host system and the GPU.
Figure 1.3: Single Visualisation Pipeline
In today’s video card market there is a simple metric in determining the perfor-mance that will be achieved by the card and that is the cost of the card. In general the more spent on a video card the better the performance. The technical aspects that determine the performance of a graphics card can be measured by the memory band-width (GB/sec), peak fillrate (Billion Pixels/sec) and the number of shaders contained on a card. These metrics of a number of selected graphics cards are plotted against their cost and shown in Appendix B . The trend shows that the more expensive the card, the better values for these metrics.
These figures assume a single user using a visualisation workstation. As visuali-sation performance is very dependent on the video card, typically the users of these workstations only make use of the workstation’s highest-performance pipeline, i.e. a single pipeline, as in Figure 1.3 and graphed on Figure 1.4. What happens when more users are added?
Summary
The motivation of this thesis is to consider a framework for visualisation that gives a greater performance than a desktop computer can provide, achieved at a cost much cheaper than a CAVE, while allowing simultaneous usage by multiple users, and to do so on a mathematical basis. That is, we want to achieve a point in the visualisation space that is optimal in cost, performance while maximising the numbers of users that can avail of the visualisation resource, thereby supporting the middle ground.
This thesis presents a methodology that has been developed to share these visu-alisation facilities on demand in the same way other resources are shared for batch submission style problems and to do so on a mathematical basis. A comprehensive application which tests this framework thoroughly is also described within this thesis. This application also provides a useful example for grid users and developers to help understand better the architecture and components of the framework and its models.
1.2
Objectives
The aim of this undertaking is to investigate whether there is a cost/performance/num-ber of users ratio benefit in combining multiple heterogeneous components of a grid infrastructure to create a loosely-coupled distributed visualisation resource, over tradi-tional single-user tightly-coupled systems. Also, the author wishes to explore the area of benchmarking CPUs and GPUs, for the purpose of creating mathematical models to describe an optimised combination of these heterogeneous grid resources.
Therefore, the main focus of this thesis is the development of an interactive, exten-sible framework for real-time visualisation applications and associated mathematical models, and the evaluation of these models through testing and experimentation. That is, a multiuser multiscale framework for the middle ground that exploits distributed computing, and is
• between realtime visualisation and int.eu.grid’s[2] “human-in-the-loop”
• between multiscale visualisation and int.eu.grid’s single-scale visualisation
• between dedicated rendering engines and rendering libraries.
1.3
Contributions of the Work
The author’s contribution is the development of a generic framework for multiscale
multimodal visualisation, described in Multiscale Multimodal Visualisation on a Grid
[5], using grid infrastructure that is amenable to mathematical characterisation. This framework is built using a grid visualisation architecture developed by the author within the scope of the WebCom-G project [6] and visualisation technology developed by the CrossGrid [7] and int.eu.grid [2] projects. Statistical models for the framework are presented, based on linear regression. The thesis presents an example multimodal visualisation application developed within the framework that will ultimately serve an educational and exploratory objective by simplifying and increasing the understanding of the framework for the grid user (VO), the grid administrator, and for new grid user communities. The framework can integrate existing Grid and non-Grid tools and techniques for high end visualisation and interactivity:
• The techniques developed and utilised are described in detail in the following
chapters.
• The framework, including the acquisition of data and process involved in creating
a real-time virtual grid application, VirtualGrid [8], is described. The develop-ment procedures followed can be of use to other developers interested in creating similar real-time applications.
• The performance of the framework has been modelled in detail and this provides
developers with a measure as to the effectiveness of the techniques used, which they can apply to their own projects.
1.4
Overview of Chapters
The rest of the thesis has been divided up into the following chapters:
• Chapter 2 provides a detailed overview of the previous background and related
work in the area of distributed computing and interactive grid applications.
• Chapter 3 details the visualisation framework for the Grid which allows shared
rendering resources to be made available to grid users, and presents an example application of the framework, called VirtualGL.
• Chapter 4 presents a mathematical model for characterisation of the
• Chapter 5 evaluates the performance of the framework described in Chapter 4. Details of the test hardware and conditions are given and results from this evaluation are discussed.
• Chapter 6 concludes the work detailed in this thesis and suggests future work
Chapter 2
The Grid and Interactive
Visualisation
2.1
Introduction
This chapter covers the main research related to distributed computing, workflows, real-time visualisation, visualisation on grids and interactive visualisation applications on the Grid in the following manner:
• An introduction to distributed computing and the many different types of
dis-tributed computing which have enabled users to use multiple machines for their compute intensive applications, plus detailed specific examples of distributed computing and those projects which have developed software for research and commercial based distributed computing.
• A description of current work in the area of workflows, presenting scientific and
business workflows and the workflow engines that power them.
• An explanation of Real-Time rendering and the current state and performance
levels that are implied in using the term real-time.
• An introduction to the many grid projects that use some form of visualisation as
part of their offering to the grid environment. These projects range across the world and give a very good insight into the state of visualisation on grids, and the technologies that make these interactions with the Grid possible.
• Finally, a description of the interactive and visualisation applications that are
2.2
Distributed Computing
This section will describe distributed computing and the many types of systems that come under the umbrella description that is distributed computing. As previously explained, distributed computing is the means by which computers, that are separate entities in their own right, can be loosely coupled together to perform a computational task.
2.2.1
Middleware
Middleware is the software which provides the means by which homogeneous or het-erogeneous systems can ’talk’ to each other. This communication is usually across a network where the middleware allows multiple processes running on these systems to interact. For a long while, middleware has either been custom coded for individual projects or has come in the form of proprietary products or suites, most notably as Enterprise Application Integration (EAI) software. The emergence of industry-agreed web services specifications is now enabling convergence on standards-based distributed middleware, which in theory should allow all systems to automatically connect together on demand.
Globus
The Globus project [9][10][11][12][13] is an American multi-institutional research ef-fort that seeks to enable the construction of computational Grids. Globus provides a software infrastructure that enables applications to view distributed heterogeneous computing resources as a single virtual machine. A central element of the Globus sys-tem is the Globus Toolkit, which defines the basic services and capabilities required for constructing computational Grids. The toolkit consists of a set of components that
im-plement basic services, such as security, resource location, resource management, data
management, resource reservation, and communications.
re-source providers on a Grid for their current configuration, capabilities, and status. GIIS pulls the information from multiple GRIS services and integrates it into a single coherent resource information database. The resource information providers use a push protocol to update GRIS. Thus MDS follows both push and pull protocols for resource dissemination. Higher-level tools such as resource brokers can perform resource dis-covery by querying MDS using LDAP protocols. The MDS namespace is organised hierarchically in the form of a tree structure. Globus offers quality of service (QoS) in the form of resource reservation. Globus provides scheduling components as part of its toolkit approach but does not supply scheduling policies, relying instead on higher-level schedulers.
Legion
Whereas Globus is a collection of tools from a toolkit, Legion [16][17] provides standard operating system services - process creation and control, interprocess communication, persistent storage, security and resource management - on a Grid. By doing so, Legion abstracts the heterogeneity inherent in distributed resources and makes them look like part of one virtual machine. Legion is organised by classes and metaclasses, and
comprises of the following ideas: everything is an object,classes manage their instances
and users can define their own classes. In Legion objects represent all hardware and software components and every object is a process that responds to method calls from other objects within the system. Every Legion object has its own class object which defines and manages it and these class objects can create new instances, schedule an object for execution, activate or deactivate an object and provide state information to client objects. Users can also override or redefine the functionality of a class.
The scheduling process in Legion broadly translates to placing objects on processors. Scheduling is invoked not just for running users’ jobs but also to create any object on a Grid, such as a file, a directory, an application or even a scheduler. Legion contains
the following core object types: classes and metaclasses, host objects, vault objects,
depending on the object that is being placed and the user’s goals, as well as resource usage policies. The Legion interface is described in an Interface Definition Language (IDL) and it is written in the Mentat Programming Language (MPL), which means it is necessary to port MPL onto each platform before Legion can be installed.
Condor
Condor [18] is a high-throughput computing software framework for the parallelisation of computationally intensive tasks. It is used to manage workload on a dedicated cluster of computers and runs on Linux, Unix, Mac OS X, FreeBSD, and the Windows operating systems. Condor is developed by the Condor team at the University of WisconsinMadison [19] and is freely available for use. Condor can run both sequential and parallel jobs and it supports the standard Message Passing Interface (MPI) and Parallel Virtual Machine (PVM) libraries in addition to its own Master Worker (MW) library for extremely parallel tasks.
Condor-G [20][21] allows Condor jobs to be used on resources not under its direct control. It is mostly used to talked to Grid and Cloud resources, Globus, UNICORE and Amazon EC2, but it can also be used to talk to other batch systems, like Torque [22][23], PBS [24][25] and LSF [26][27]. Support for Sun Grid Engine is currently under development as part of the EGEE project. Condor is one of the job scheduler mechanisms supported by GRAM (Grid Resource Allocation Manager), a component of the Globus Toolkit.
Virtual Data Toolkit (VDT)
VDT provides a build test infrastructure for grid software. Its building infrastructure is based on NMI pools of heterogeneous resources, each installed with Condor. The User Interface (UI) to the Condor/NMI pools is based on a Perl implementation. Builds are triggered to produce, in particular, VDT Globus, MyProxy, GSI-OpenSSH and UberFTP-client for the gLite middleware distribution. Currently the NMI pool consists of SL 4/5 Debian 4/5, AIX, PS3(Yellow Dog Linux), MacOS and openSUSE build machines. The value of this software is that it also provides patches to the Globus distribution making the is more scalable.
Unicore
to develop distributed applications. The UNICORE design goals include a uniform and easy to use GUI, an open architecture based on the concept of an abstract job, a consistent security architecture, minimal interference with local administrative pro-cedures, exploitation of existing and emerging technologies, zero administration user interfaces through standard Web browsers and Java applets. UNICORE is designed to support batch jobs; it does not allow for interactive processes. The user is provided with a unique UNICORE user-ID to uniformly get access to all UNICORE sites. An intuitive GUI allows job preparation and control.
gLite
gLite [30][31] is a middleware which is produced by the Enabling Grids for E-sciencE (EGEE) [1] project. It follows on and makes use of contributions from many projects including LCG [32][33], Condor and Globus via VDT [34][35], and EDG [36][37]. gLite middleware is currently deployed on hundreds of sites as part of the EGEE project. The services, or node-types, that are provided by gLite include Computing Element, Workload Management, Storage Element, Catalog, Information and Monitoring, and Security and each of these services has taken components from the previously mentioned projects.
2.2.2
Grids
This section describes some of the grid projects that exist and that have used some of the middleware software described in the previous section.
EDG
The EDG (European Data Grid) project [36][37], which spanned from 2000 to 2004, greatly extended the Globus Toolkit version 2.4 with higher-level services for authori-sation, job submission, brokerage and information gathering. It can be considered the progenitor of the gLite middleware. It supported 12 Virtual Organisations and at its peak had over 1000 CPUs available to users.
EGEE
the gLite middleware and generally, the EGEE Grid infrastructure is ideal for any loosely-coupled scientific application, although support is growing for more tightly-coupled applications using the MPI API [38][39][40]. The EGEE Grid consists of, as of October 2009 [41], 296 sites in 56 countries with 76,380 CPUs available to users 24 hours a day, 7 days a week and connected to more than 131 Petabytes (over 137 million Gigabytes) of storage. Its successor will be the European Grid Infrastructure (EGI) [42], beginning in 2010.
TeraGrid
The TeraGrid project [43] was launched in 2001 by the National Science Foundation in the United States and in 2005 was extended up until 2010. Currently, TeraGrid resources include more than a petaflop of computing capability and more than 30 petabytes of online and archival data storage, with rapid access and retrieval over high-performance optical networks. TeraGrid users primarily come from United States uni-versities and currently it has 4,000 users at over 200 uniuni-versities. Academic researchers in the United States can obtain exploratory allocations in “CPU hours” based on an abstract describing the work to be done. TeraGrid computational resources run a set of software packages called “Coordinated TeraGrid Software and Services” (CTSS). CTSS provides functions such as single sign-on, remote job submission, workflow support and data movement tools. CTSS includes the Globus Toolkit and Condor, verification and validation software, and a set of compilers and programming tools.
OSG
Begun in 2004, The Open Science Grid (OSG) project [44] provides high-throughput computing across the United States. There are 72 sites and 30 virtual organisations in OSG and in total, the OSG comprises over 25,000 computers with over 43,000 processors. There are 90 distinct computational and storage nodes in the grid, which are distributed across the United States and Brazil. VDT is a product of the OSG and is used as its grid middleware distribution. High-energy physics uses a large chunk of OSG’s resources but there are several other sciences that are actively using OSG:
• nanoHUB [45][46]: is comprised of resources contributed by the Nanotechnology
community in the United States and is aimed at providing educational applica-tions, professional networking, and interactive nanotechnology simulation tools.
• LIGO [47][48]: is a project set up in 1992 at MIT and Caltech, and is a large
• CHARMM [49][50]: or Chemistry at HARvard Macromolecular Mechanics is a software application developed at Harvard University for modelling the structure and behaviour of molecular systems. Molecular dynamics jobs usually take days to complete, and as the OSG sites are optimised for shorter jobs, each long job is split into smaller jobs.
2.2.3
Clouds
Cloud computing is an emerging approach to shared infrastructure in which large pools of systems are linked together to provide IT services.
In A vision for the Internet [51], Kleinrock presents his vision from 1969 of the computing utility based on the service provisioning model, ‘As of now, computer net-works are still in their infancy, but as they grow up and become sophisticated, we will probably see the spread of “computer utilities” which, like present electric and telephone utilities, will service individual homes and offices across the country.’ This vision anticipates the massive transformation of the entire computing industry in the 21st century whereby computing services will be readily available on demand.
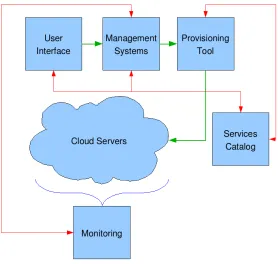
The need for such environments is fuelled by dramatic growth in connected devices, real-time data streams, and the adoption of service oriented architectures and Web 2.0 applications, such as mashups, open collaboration, social networking and mobile commerce. Continuing advances in the performance of digital components has resulted in a massive increase in the scale of IT environments, driving the need to manage them as a unified cloud. Virtualisation is playing an increasingly important role and it is one of the reasons that Cloud Computing has been named as such. With virtualization the resources available to a user can expand and collapse depending on the needs of the user. This is achieved by creating or deleting virtual machines using software like Xen [52][53]. Therefore the resources available to the user are not fixed, but continually moving and changing size (according to the requirements of the user), like a cloud. Figure 2.1 describes what a possible cloud system could be like. Here there are services such as the User Interface (UI), Management Systems and Monitoring that are persistent and in the middle lies the “cloud” resource. Obviously the owners and administrators of the cloud computing resources have a fixed set of resources, but for the user on the outside, with the aid of Xen and virtual machines, the available resources appear to be variable.
sec-Figure 2.1: Cloud Computing
tions I will describe these platforms including some of the smaller commercial offerings.
Amazon Elastic Compute Cloud - EC2
EC2 [54][55] lets a user rent time on a “cloud” of computers. The computer specifi-cations depend on the the computing needs of each user and how much the user can afford to pay. Amazon split their machines into separate instance types which differ in the speed of the CPU, amount of memory available, whether it’s a 32-bit or 64-bit
platform, the I/O performance and the storage capacity. A Standard Small Instance
offers computers with one EC2 Compute Unit, which is equivalent to a CPU of a 1.0-1.2 GHz 2007 Opteron or 2007 Xeon processor, 1.7GB of RAM, a 32-bit platform, moderate I/O performance and 160 GB of local disk. The cost of these machines is 10 cents per instance per hour. The most expensive instance available at 80 cents per
instance per hour is the High-CPU Extra Large Instance. This provices the renter with
20 EC2 Compute Units, 7GB of RAM, a 64-bit platform, high I/O performance and 1690GB of local disk.
[image:33.595.183.461.130.394.2]the user monitor the progress of the machine’s creation; when it is ready, the script displays the computer’s hostname. The image that is instantiated should have an account that lets the user log into the machine. Because EC2 is based on Xen, it should support any Linux distribution as well as NetBSD, FreeBSD, Plan 9, and some other operating systems. In practice, EC2 is largely based on the RedHat Fedora Core operating system, although there are instructions on the Internet for using it with Ubuntu distributions. Amazon makes no promises about the reliability of the EC2 computers: each machine can crash at any moment, and they are not backed up. Under normal circumstances these machines don’t crash, but, sometimes computers do fail. If a user wants reliable storage, it is advisable to run two or more EC2 machines as a cluster. A better approach, though, is to have the EC2 machines store information in S3, which is sold as a reliable, replicated service.
IBM
Blue Cloud [56] is a series of cloud computing offerings that will allow corporate data centres to operate more like the Internet by enabling computing across a distributed, globally accessible fabric of resources, rather than on local machines or remote server farms. Blue Cloud is based on IBM’s Almaden Research Centre cloud infrastructure. It includes Xen and PowerVM [57] virtualised Linux operating system images and Hadoop [58][59] parallel workload scheduling. It is based on an open-source project called Hadoop that manages computing resources across large clusters of computers.
Hadoop includes an open-source version of MapReduce, the same functional software
Google uses to efficiently distribute its computing chores across its servers around the world.
Sun Cloud
Sun Cloud [60] is an on-demand Cloud computing service operated by Sun Microsys-tems. The Sun Cloud Compute Utility provides access to a substantial computing resource over the Internet for one US dollar per CPU-hour. It is based on and sup-ports open source technologies such as Solaris 10, Sun Grid Engine, and the Java platform and is available worldwide.
and data can not exceed 10 gigabytes and must be packaged for upload to Sun Cloud as one or more ZIP files of 300 megabytes or smaller.
GoGrid
GoGrid [61] is a cloud infrastructure service and is the cloud hosting division of the ServePath Dedicated Hosting company [62] which is based in the United States. It uses Xen technology to host Linux and Windows virtual machines which are managed by a multi-server web-based control panel. They have a pay-as-you-go pricing plan that ranges from just under 10 cents an hour for one Xeon processor, 0.5GB of memory and 30GB of local storage to 152 cents and hour for 6 Xeon processors, 8GB of memory and 480 GB of local storage.
2.2.4
Future Grids-n-Clouds
In essence, Grids ease sharing and collaboration, and Clouds ease provisioning. These are not mutually exclusive, and so future marriages of the technologies are likely.
2.3
Workflow Engines
Workflow engines are applications that allow users to graphically assemble a connected job or set of jobs that they want executed. These workflow engines give simplified access to large sets of libraries, e.g. R [63][64] and Matlab [65]. There are many workflow systems in existence today, each addressing some aspect of the workflow management problem [66][67].
Workflow systems can be generally classified into two broad categories: Task-based or service-based. Task-based systems, for example Pegasus [68], generally focus on the mapping and execution capabilities and leave the higher-level composition tasks to other tools. There are many workflow systems that support application component composition and execution. Some, such as Triana [69], Kepler [70][71], and VisTrails [72], provide graphical user interfaces for workflow composition and some, such as Karajan [73], provide a scripting language to specify the workflow. Some of these workflow systems support more complex control structure loops, conditionals, and hierarchical workflow definitions.
software. Advanced applications allow users to introduce new components into the operation.
Scientific workflows found wide acceptance in the fields of bioinformatics and chem-informatics in the early 2000s, where they successfully met the need for multiple inter-connected tools, handling of multiple data formats and large data quantities.
In attempting to hide the complexity of the Grid from users, workflow engines have been adapted to include services that allow the user to utilise grid resources without having prior knowledge of grid job submission techniques. The following four sections describe examples of workflow engines that have components that are grid-enabled.
2.3.1
Pegasus
Pegasus [68], Planning for Execution in Grids, was developed as part of the GriPhyN project [47]. Pegasus is a configurable system that can map and execute complex workflows on the Grid. Pegasus receives an abstract workflow description from Chimera [74], produces a concrete workflow by means of the Concrete Workflow Generator [75], and submits it to Condor’s Directed Acyclic Graph Manager, DAGMan [18], for execution. The abstract workflow describes the transformations and data in terms of their logical names.
For example, in astronomy, users often do not want to know the details of the underlying system, instead they want to retrieve images of an area of the sky of interest to them. In such cases Pegasus is usually integrated into a portal environment where the user is presented with a web form to fill in the desired metadata attributes. Inside the portal, the workflow instance is generated automatically based on the user’s input and is given to Pegasus for mapping and then to DAGMan for execution. Examples of this approach can be seen in the Montage project [76] (an astronomy application), the Telescience portal [77] (a neuroscience application), and the Earthworks portal [78] (an earthquake science application). In all these applications, Pegasus and DAGMan are being used to run the application workflows on a national scale infrastructure such as the TeraGrid [43].
2.3.2
WebCom-G
These tools include
• APIs for languages like Java and C++.
• An XML Schema for expressing Condensed Graphs.
• Visual tools that allow users to create Condensed Graph applications graphically,
e.g WebCom-G IDE, see Figure 2.2
• High Level Language compilers that compile existing applications (written in
languages like Java) directly into Condensed Graphs. These compilers can extract parallelism from sequentially written applications and have the advantage of not requiring application developers to know anything about the Condensed Graph Model of Computing
[image:37.595.103.543.427.730.2]Applications can be built using the G IDE and submitted to a WebCom-G grid. These jobs can be executed on this grid alone but WebCom-WebCom-G also provides interoperability with other existing middlewares, e.g Globus.
2.3.3
Kepler
The Kepler workflow application [70][71] is a scientific workflow system based on Ptolemy II [80][81], developed by researchers from the US at the National Center for Ecological Analysis and Synthesis (NCEAS) at the University of California, Santa Barbara and the San Diego Supercomputer Center at the University of California, San Diego. Ptolemy II is a set of Java packages supporting heterogeneous, concurrent modelling and design. Its kernel page supports clustered hierarchical graphs, which are collections of entities and relations between those entities. Most models of computation in Ptolemy II support actor-oriented design and Kepler extends Ptolemy II by creating
an ever increasing number of components, called actors, aimed particularly at
scien-tific applications, e.g. for remote data and metadata access, data transformations, data analysis, interfacing with legacy applications, web service invocation and deployment, etc. Target application areas include bioinformatics, cheminformatics, ecoinformatics, and geoinformatics workflows, among others. Figure 2.3 shows a snapshot of the Kepler Integrated Development Environment (IDE) solving two couple differential equations and the plotted results.
2.3.4
Taverna Workbench
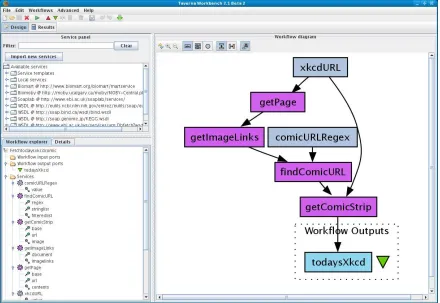
Taverna Workbench [82][83] is a workflow IDE, see Figure 2.4, created by the myGrid project [84][85] based on work in Manchester, which allows for the automation of experimental methods through the use of a number of services, including Web Services. The Taverna Workbench is used by users in many domains, such as bioinformatics, cheminformatics, astronomy, social science and music. Taverna workflows can include sub-workflows and these sub-workflows can be included in many workflows and can be shared and edited separately. Taverna workflows do not need to be executed within Taverna Workbench as they can also be run by a command line execution tool, on computational grids and from web pages or portlets. Taverna is also used to run services on computational grids such as EGEE.
2.4
Real-Time Rendering
Figure 2.3: Kepler IDE showing the setup involved to solve two couple differential equations and the resulting plots. Image courtesy of Dr. John Ryan of the author’s host research group.
real-time display rates by only covering a small physical area or Level, or restricting the users path through the virtual world with obstacles and barriers. Larger areas may be constructed by chaining levels together, but typically there is a transitional period as a new level is loaded into the computer’s memory. Real-Time Rendering is typically understood to be over 30 frames per second (fps) [86]. The visualisation pipeline can be conceived in several ways [87]. In this thesis the visualisation pipeline is considered as a sequence of four tasks,
1. computation.
2. interaction.
3. rendering.
Figure 2.4: Taverna IDE showing the workflow set up to retrieve a html web page. Image courtesy of Dr. John Ryan of the author’s host research group.
The Grid can handle the computation and delegate the data produced from the Grid to a dedicated rendering engine which can then stream the images to a display.
As the Grid is spread across a large geographical area, latency becomes a problem to real-time interaction and computational steering of applications. If there is high
network latency between therendering and display tasks of the pipeline, the minimum
frame rate of 30fps might not be achievable. Computational steering may also be affected by high-latency scheduling, which is the delay between job submission and the execution of the job.
The framework proposed in this thesis deals with the provision of this render-ing engine (hereafter called the Visualisation Engine), methods of interaction and the streaming of images which reduces the effects of latency. The framework thus completes tasks 1 to 4 of the visualisation pipeline.
2.5
Visualisation and Steering on Grids
success of these solutions in various applications is examined.
2.5.1
Visualisation in TeraGrid
No matter how users conduct science, a crucial aspect of scientific discovery is the pro-cess of understanding the information contained in the data. Analysis, visualisation, and data exploration are key components in this process. The goal of the American TeraGrid Visualisation (TGviz) effort is to combine existing resources and current tech-nology (including commodity clusters and commodity graphics, terascale visualisation clusters, Grid technology, and efforts, expertise, and tools from each of the TeraGrid partner sites) to enable new and novel ways of visually interacting with and gaining insight into science through the analysis of simulations and data. This is done through the production of visualisation services for users, and providing tools and libraries for researchers in visualisation and graphics. TeraGrid also deploys visualisation resources for batch, interactive, and collaborative visualisation. Users access TeraGrid-aware visualisation applications in a way that appears to be a desktop visualisation solution but in reality makes use of the rich TGviz resources.
The TGviz effort emphasises three principal areas:
• Investigation of challenges to running a large-scale visualisation Grid facility;
• Development of methods to effectively enable the remote interaction of users
with sophisticated visualisation systems, and the subsequent delivery of results to users from those systems
• Improvement of the data analysis capabilities of the TeraGrid community through
the availability of visualisation services.
The TeraGrid Visualisation Gateway is a web interface for gaining simplified access to a variety of TeraGrid visualisation resources and services. All new users receive a “New User Form” via U.S. postal mail that contains a username and password for the TeraGrid User Portal. This same username and password can also be used to login to the Visualisation Gateway. Once logged in to the gateway, four different services are made available to the user from the gateway:
• Proxy Manager: helps the user manage the credentials that are used to access
• Remote Visualisation: enables the launching of remote visualisation sessions on Maverick, Texas Advanced Computing Center’s (TACC) TeraGrid Visualisa-tion System [88], through the use of a Virtual Network Computing (VNC) server
1 running on Maverick and a VNC client running in a web browser on the local
resource.
• ParaView: enables the user to launch a ParaView server [94][95], a parallel
vi-sualisation application for large datasets, on the Argonne TeraGrid Vivi-sualisation cluster [96], and connect to it via a ParaView client running on a local resource, as shown in Figure 2.5.
• File Management: enables the movement of data onto and off of the TeraGrid,
as well as between TeraGrid resources. If multiple proxies are loaded, it is possible to individually select which proxy to use for the source and destination of the transfer.
Figure 2.5: ParaView Service on UChicago/Argonne
In addition to Common TeraGrid Software and Services (CTSS) available on all TeraGrid resources, the TeraGrid Visualisation Working Group has also defined Visu-alisation TeraGrid Software and Services (VTSS). The VTSS consists of a common set of applications and libraries for enabling scientific visualisation that can be found on all resources that choose to support it.
2.5.2
RealityGrid
A central theme of the UK based RealityGrid [97][98] is the facilitation of distributed and collaborative steering of parallel simulation codes and simultaneous on-line, high-end visualisation. It’s architecture is illustrated in Figure 2.6.
Figure 2.6: RealityGrid
created, to represent the steerable simulation on the Grid. The SGS publishes its loca-tion to a Registry service, so that steering clients may find it. This design means that it is possible for clients to dynamically attach to and detach from running simulations. Each running simulation emits output files after certain periods of simulation time have elapsed. The period between output emission is initially determined by guessing a timescale over which the simulation will change in a substantial way; however, this period is a steerable parameter, so that the output rate can be adjusted for optimum visualisation without producing an excessive amount of data. Visualisation clusters were used to render the data and output volumes were sent using Globus I/O from the simulation machine to the remote visualisation machine, so that the simulation could proceed independently of the visualisation; these were then rendered using the open source Visualisation Toolkit (VTK) [99][100] visualisation library into bitmap images, which were in turn multicast over the AccessGrid [101][102] using the Chromium [103], so that the state of the simulation could be viewed by scientists around the globe. In particular, this was demonstrated by performing and interacting with a simulation in front of a live worldwide audience, as part of the SCGlobal track of the SuperComput-ing 2004 conference. There are many parameters for such a visualisation, such as the region of the simulation being visualised, colour maps, isosurface levels, and orientation of the visualisation geometry. These were controlled through SGIs VizServer software, allowing control of the geometry from remote sites.
Adaptive modelling is a technique which can reduce the need for computational steering. By capturing the user’s knowledge base in more detail, information can be adapted and presented to a user in a way that is more intuitive. If the user has little grid and system knowledge, then creating jobs that gather very detailed information is a waste of resources, both storage and compute.
A lightweight visualisation system was created, which can be hosted on a mobile phone, laptop or desktop computer, to provide a set of grid-enabled software compo-nents and middleware. The basis of lightweight visualisation was to facilitate efficient and collaborative remote user access to high-end visualisation on the grid. The Reali-tyGrid PDA client [104] was designed as an intuitive visual front-end, enabling the user to discover their applications on the RealityGrid, steer their simulations in real-time and interact with high-end visualisations as if the supercomputing applications were running locally. The PDA Client provides convenient, remote, handheld access to the primary aspects of supercomputing functionality:
• Resource discovery: The PDA Client retrieves a list of all the user’s currently
to the job over the grid and display the appropriate computational steering or visualisation interface, depending on the type of job selected.
• Real-time computational steering: The user remotely steers a simulation by
entering new parameter values into an input dialog, which is displayed by the user interface. The inputted new parameter values are then dispatched to the grid to update the relevant parameters within the simulation. Once the required steering activity has been instigated it is reflected back to the PDA interface, through a client-requested parameter update, almost instantaneously.
• Visualisation: The configurable visualisation interface has been designed to
provide the same user services and level of user interaction as that of the desktop computer front-end ensuring a familiar user interface on the PDA. The user can remotely configure the image encoder settings to enable varying levels of image compression, in order to adapt the client for use on low or medium bandwidth wireless networks with higher levels of image compression yielding increased im-age serving throughput on slower networks. This method also allows the system to produce images with lossless compression when required.
2.5.3
Cactus
The programming framework Cactus [105][106] and the remote steering/visualisation architecture, see Figure 2.7, was developed at Potsdam University in Germany since the mid-1990’s specifically to enable scientists and engineers to perform the large scale simulations needed for their science. Cactus was used to perform intercontinental distributed simulation-visualisation scenarios at SC97, and at SC98, a simulation of colliding neutron stars across the two continents was shown, distributing the computa-tional grid across three supercomputers in Garching, Berlin and San Diego. Distributed demonstrations were also shown at SC’99 and SC’2000, with emphasis more on sophisti-cated and robust interactive visualisation, monitoring and steering, dynamic scenarios, exploitation of networks and the development of user portals and testbeds.
Figure 2.7: The Remote Steering/Visualisation Architecture of Cactus
the same driver to reconstruct the in-memory file which then can be accessed to read the datasets. The design means that applications can use their existing file-based I/O methods immediately for online remote data access without changing I/O interfaces. Such live streaming data from Cactus simulations can be viewed using many differ-ent visualisation tools, including Amira [109][110], IBM Data Explorer [111] and LCA Vision [112].
2.5.4
GridLab
Figure 2.8: The general GridLab Architecture.
2.5.5
Image-Processing Grid Environment
Figure 2.9: Image Processing Grid Architecture
2.5.6
Crossgrid/int.eu.grid Visualisation Technologies
A set of grid-enabled visualisation technologies were developed within the EU Cross-Grid [7] and int.eu.grid [2] projects over the period 2002-2006, that are oriented towards compute and data-intensive applications that involve the interaction of a user in the processing loop. Such applications require a response from the Grid to an action by a human agent in different time scales. Tools developed within the CrossGrid project are glogin [119], GVid [120], Grid Visualisation Kernel (GVK) [121], and the Migrating Desktop [122]. These are briefly described here.
glogin: This tool provides a tunnel into the Grid and therefore facilitates
interac-tion with the Grid’s resources.
GVid: GVid allows rendering to be done on Grid resources, with transmission of
resulting video over the Grid.
GVK: With GVK the user is able to control the execution of a grid application
visualisation tool. The link itself is established using the glogin tool
Migrating Desktop: The Migrating Desktop is a framework for a graphical user
interface for application management, grid and job monitoring, data and metadata management. This graphical environment is used as an advanced client for accessing grid resources in CrossGrid.
2.5.7
Limitations
In each of the examples above there is a problem in that the application developer’s task is to write application-specific plugins that can communicate with the appropriate web services. Is there away around this problem? For every application a plugin is required. This plugin can be very specific to the type of simulation being run within the visualisation application. For widely used software, like VTK, it may be possible to have a range of plugins available, but it would be better if no extra software was needed on the application side.
Other interactive visualisation applications have used tools such glogin to tunnel into the Grid and run the applications on the Grid through this pseudo terminal. This indeed is running an interactive application on the Grid but there are two problems with this. Firstly, when using common middleware such as Globus [9], LCG2 [32] or EGEE [1] the application has to be installed on the “gatekeeper” that the user uses glogin to connect to. Secondly this application is running on the gatekeeper and not a general compute-node.
2.6
Interactive Visualisation applications on the Grid.
Interactive applications are characterised by interaction with a person in a processing loop. Each application requires a response from the Grid to an action by that person in different time scales: from real time through intermediate delays to long waiting periods. The applications are simultaneously compute- and data-intensive.
2.6.1
Crossgrid Flood Crisis Simulation
Figure 2.10: Crossgrid Flood Crisis Simulation. Image taken from the Flood Crisis Team Decision Support System Presentation [123][124]
2.6.2
Crossgrid Blood Flow Simulation
A Grid-based prototype system for pretreatment planning in vascular interventional and surgical procedures through real-time interactive simulation of vascular structure and flow. The system consists of a distributed real-time simulation environment, with which a user interacts in Virtual Reality (VR). A 3-d model of a patient’s arteries, deri

![Figure 2.10: Crossgrid Flood Crisis Simulation. Image taken from the Flood CrisisTeam Decision Support System Presentation [123][124]](https://thumb-us.123doks.com/thumbv2/123dok_us/884516.601022/50.595.182.462.128.343/figure-crossgrid-crisis-simulation-crisisteam-decision-support-presentation.webp)
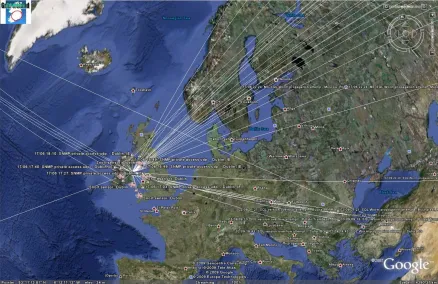
![Figure 2.20: Image taken from Interactively combining 2D and 3D visualisation fornetwork traffic monitoring [140]](https://thumb-us.123doks.com/thumbv2/123dok_us/884516.601022/59.595.100.545.132.504/figure-image-interactively-combining-visualisation-fornetwork-trac-monitoring.webp)
![Figure 2.21: IDtk visualisation of network traffic. Image taken from A User-centeredLook at Glyph-based Security Visualisation [139]](https://thumb-us.123doks.com/thumbv2/123dok_us/884516.601022/60.595.102.543.407.736/figure-visualisation-network-trac-image-centeredlook-security-visualisation.webp)