COMPARATIVE STUDY OF PRULIFLOXACIN BY VALIDATED
RPHPLC AND MICROBIAL AGAR ASSAY METHOD USING
STUDENT’S T TEST
Sweety Kanolkar1*, Teja Walke1, Yogita Sardessai2 1
Department of Quality Assurance, Goa College of Pharmacy, Panjim-Goa, India.
2
Department of Microbiology, Goa College of Pharmacy, Panjim-Goa, India.
ABSTRACT
A simple, accurate and precise RPHPLC method was developed for
determination of Prulifloxacin in tablet dosage form. The
chromatography was performed on a C18 column. Eluents were
monitored by UV detection at 279 nm using the mobile phase
Acetonitrile: Phosphate buffer pH 7(80:20). The method was
statistically validated for linearity, accuracy, precision. The linearity of
prulifloxacin was within the concentration range of 16-24 µg/mL. The
limits of detection and quantitation were 0.189 µg/ mL and 0.5751 µg/
mL respectively. Microbial agar assay was chosen as a comparison
method for the prulifloxacin determination. Assay of prulifloxacin determined in both
methods were compared statistically using student’s t test which confirmed that the two
methods are statistically similar and there is no significant difference.
KEYWORDS: prulifloxacin, RPHPLC, microbial agar assay, student’s t test.
INTRODUCTION
Prulifloxacin1-2 is an older synthetic chemotherapeutic antibiotic of the fluoroquinolone drug class. It is a prodrug which is metabolized in the body to the active compound ulifloxacin. It
has been approved for the treatment of uncomplicated and complicated urinary tract
infections, community-acquired respiratory tract infections and gastroenteritis, including
infectious diarrhoeas. The chemical name of Prulifloxacin is (RS
)-6-Fluoro-1-methyl-7-[4-(5-methyl-2-oxo-1,3-dioxolen-4-yl)methyl-1-piperazinyl]-4-oxo-4H
-[1,3]thiazeto[3,2-a]quinoline-3-carboxylic acid, as shown in chemical structure of Prulifloxacin in figure 1.
Volume 3, Issue 4, 1665-1673. Research Article ISSN 2277 – 7105
Article Received on 18 April 2014,
Revised on 14 May 2014, Accepted on 07 June 2014
*Author for Correspondence
Sweety Kanolkar
Department of Quality
Assurance, Goa College of
Fig. 1. chemical structure of prulifloxacin.
Literature surveys have revealed a number of methods for the estimation of Prulifloxacin
depending on different analytical techniques, LC-MS/MS3, RPHPLC4, HPLC5-6, UV Spectrophotometric methods7-9.
Present study describes the development and validation of RPHPLC based method for
determination of prulifloxacin and comparison of the same with previously validated
microbial agar assay method using student’s t test.
MATERIAL AND METHOD Chemicals
All the reagents used for the analysis were of analytical grade. Standard Prulifloxacin was
obtained as a gift sample from Micro labs, Bangalore .The Tablet Percin of strength 600 mg
were obtained from the market manufactured by Lupin Pharma. Acetonitrile and HPLC grade
water were procured from Merck.
Prulifloxacin Reference Solution
Accurately weighed 5 mg of prulifloxacin was transferred into 50 ml of volumetric flask and
dissolved in mobile phase to obtain a final concentration of 100 μg/ml. Aliquots of this
solution were further diluted with the same to obtain final concentrations.
Preparation of sample solution
Twenty tablets were weighed, crushed and their contents are mixed thoroughly. An
accurately weighed portion of powder equivalent to the 10 mg of Prulifloxacin was weighed
into a 100 ml volumetric flask containing about 50 ml of mobile phase. It was shaken
thoroughly for about 5-10 min. and final volume was made with the same. Further filtered
thoroughly with Whatman filter paper no. 41 to remove any insoluble matter. Aliquots of this
Preparation of mobile Phase (1 litre)
800 ml of Acetonitrile was mixed with 200 ml of buffer pH 7 and it was filtered through
0.45µm membrane filter.
Preparation of phosphate buffer pH 7 (1 litre)
0.5 g of anhydrous disodium hydrogen phosphate and 0.301 g of potassium dihydrogen
phosphate were dissolved in sufficient water to produce 1000ml.
Chromatographic conditions
The method was conducted using RPHPLC technique. Prulifloxacin was eluted isocratically
with a flow rate of 1.0 ml/min using a mobile phase consisting of Acetonitrile and phosphate
buffer pH 7 in the ratio of 80:20. The wavelength of the UV–Vis detector was set to 279 nm.
The mobile phase was prepared daily, filtered through a 0.45 μm membrane filter. Acclaim
TM
120 C18 5μm 120 A° (4.6 x 250 mm) column was used. The HPLC system was operated
at room temperature.
Method Validation10
The RPHPLC method was validated as per ICH guidelines Q2 (R1) evaluating for linearity,
precision, accuracy and robustness.
Linearity
Prulifloxacin reference solutions were prepared in triplicate at concentrations of 16, 18, 20,
22, 24 μg /ml. Standard plot was constructed and linearity was evaluated statistically by
linear regression analysis that was calculated by least-squares regression.
Precision (Analysis of prulifloxacin tablet)
The precision of the method was determined by repeatability (intra-day). Six sample
solutions of prulifloxacin tablet dosage form were prepared at 20 μg/ml. The results were
expressed as % RSD. The assay was performed and content per tablet were calculated.
Accuracy
The accuracy was determined by the recovery of known amounts of the prulifloxacin
reference standard added to the samples. The added levels were 80%, 100% and 120% of the
sample concentration (20μg/ml). The results were expressed as the percentage of
prulifloxacin reference standard recovered from the sample. All solutions were prepared in
Robustness
Robustness testing was performed to evaluate the susceptibility of measurements under
deliberate variations in selected analytical conditions. Factor assayed was the flow rate.
Variation was 0.9ml/ min and 1.1 ml/min of the mobile phase flow rate.
Microbial agar assay method
The Microbial agar assay method previously developed and validated was used as a
comparison method for the RPHPLC technique. Agar diffusion bioassay for determination of
Prulifloxacin was been carried out using the strain Salmonella typhimurium ATCC 23564 as
a test organism. To the sterile 85mm x 10 mm Petri plates 30 ml of Muller Hinton Agar was
poured and allowed to solidify. After solidification of this layer, 0.1 ml of Salmonella
typhimurium ATCC 23564 culture suspension was poured over the layer and was uniformly
spread over the entire area. Using sterile cork borer, wells were bored at the centre of the
Petri plates. 200 μl of drug solution was then filled into the well. Inoculated plates were kept
in the refrigerator at 2-8 ᴼ C for 10-15 min for the diffusion of the test solution. The plates
were then incubated at 37° c for 24 hrs. At the end of incubation period, inhibition zones
formed around the well were measured with transparent scale in millimetre. The validation of
the method showed good linearity that is R2=0.997 in range of 20-60 µg/ml, precision was evaluated as RSD were observed RSD was 0, and Mean recovery was found to be 95.37%
with RSD of 1.74%.
RESULTS AND DISCUSSION
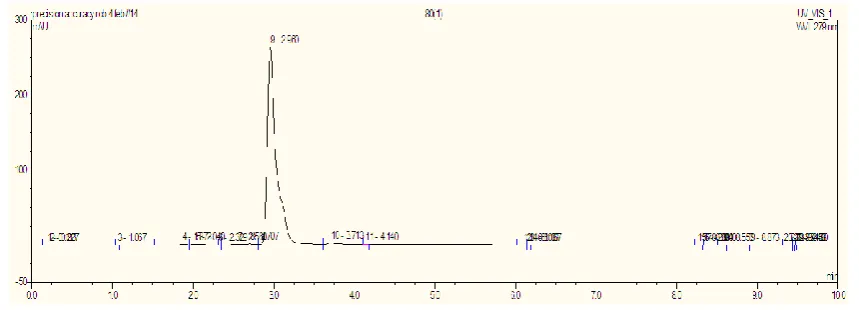
The goal of this study is to develop rapid RPHPLC methods for the analysis of Prulifloxacin
in drug samples and tablet formulations using the most commonly employed column (C18)
with UV detection at appropriate wavelength and comparing the assay results using microbial
[image:4.595.83.513.595.750.2]agar method. The representative chromatogram indicating prulifloxacin is shown in figure 2.
Calibration curve for prulifloxacin was constructed by plotting area versus concentration
[image:5.595.75.489.392.529.2]which showed good linearity in the range of 16-24 µg/ml as indicated in figure 3.
Fig. 3. calibration curve of prulifloxacin Linearity and Range
A good linear relation was found between prulifloxacin concentration and area. The linearity
data and regression analysis data is presented in Table no. 1 and 2 respectively.
Table no. 1: Linearity data Conc.
(μg/ml) Level (%)
Volume of stock (ml)
Volume of mobile phase (ml)
Total
volume Area*
16 80 1.6 8.4
10 ml
29.50437
18 90 1.8 8.2 34.04403
20 100 2 8 37.61677
22 110 2.2 7.8 40.33313
24 120 2.4 7.6 44.1324
*Average of three determinations
Table no. 2: Overview of regression analysis data
Parameter Regression analysis data
Regression coefficient 0.993
Intercept 1.581
Slope 1.777
Regression equation y = 1.777x + 1.581 Concentration range 16-24 μg/ml
Number of points 5
Precision
Precision was calculated for repeatability using prulifloxacin tablet and assay and content per
[image:5.595.168.431.577.683.2]Table no. 3: Result of precision. Sr
no.
Concentration
(μg/ml) Area Content Assay %
1
20 μg/ml
37.953 616.65 102.77
2 37.1245 603.19 100.53
3 37.7374 613.15 102.19
4 38.0082 617.55 102.92
5 37.406 607.77 101.29
6 37.2018 604.45 100.74
Mean 610.46 101.74
SD 1.031
%RSD 1.01%
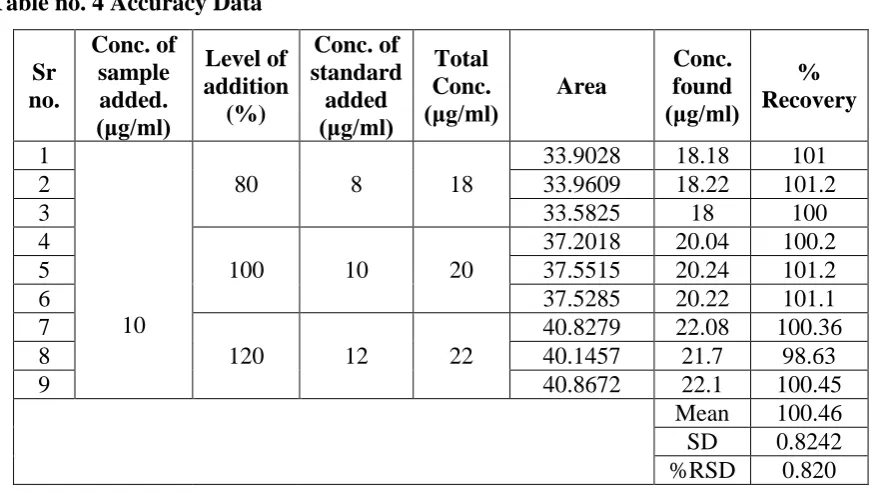
Accuracy
Accuracy studies were done as percent recovery; it was performed by adding constant
amount of the standard drug to the sample at levels of 80%, 100% and 120% of the test
concentration. Mean recovery was found to be 100.46%. The results are tabulated in Table
no. 4.
Table no. 4 Accuracy Data Sr no. Conc. of sample added. (μg/ml) Level of addition (%) Conc. of standard added (μg/ml) Total Conc. (μg/ml) Area Conc. found (μg/ml) % Recovery 1 10
80 8 18
33.9028 18.18 101
2 33.9609 18.22 101.2
3 33.5825 18 100
4
100 10 20
37.2018 20.04 100.2
5 37.5515 20.24 101.2
6 37.5285 20.22 101.1
7
120 12 22
40.8279 22.08 100.36
8 40.1457 21.7 98.63
9 40.8672 22.1 100.45
Mean 100.46
SD 0.8242
%RSD 0.820
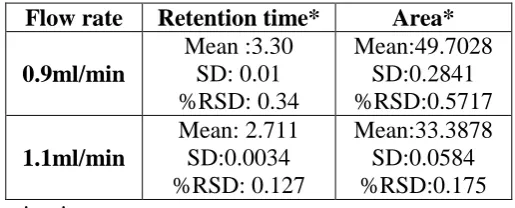
Robustness
Robustness is the ability to reproduce the analytical method under different circumstances
without the occurrence of unexpected differences in the obtained results. By evaluating the
condition, the LC method developed indicated good performance, demonstrating to be a
[image:7.595.168.426.142.246.2]robust and reliable method in the determination of the drug. Results are shown in table no. 5.
Table no. 5: Results of Robustness
Flow rate Retention time* Area* 0.9ml/min
Mean :3.30 SD: 0.01 %RSD: 0.34
Mean:49.7028 SD:0.2841 %RSD:0.5717
1.1ml/min
Mean: 2.711 SD:0.0034 %RSD: 0.127
Mean:33.3878 SD:0.0584 %RSD:0.175 * Average of 3 determinations.
Analysis of Tablet formulation by Microbiological method
Six sample solutions of prulifloxacin tablet dosage form were prepared at 20 μg/ml. The
assay was performed and content per tablet were calculated. Results are tabulated in Table
no. 6
Table no 6: Results of formulation analysis by Microbial assay Sr no. Concentration
(μg/ml)
Zone diameter (mm)
Content per
tablet (mg) Assay %
1
20 μg/ml
30 608.1 101.35
2 30 608.1 101.35
3 30 608.1 101.35
4 30 608.1 101.35
5 30 608.1 101.35
6 30 608.1 101.35
Mean 608.1 101.35
SD 0
%RSD 0
Comparison of RPHPLC and Microbial Assay in Determination of Prulifloxacin in Tablet Dosage Form.
Comparison of assay methods is been tabulated in Table no. 7.
Table no. 7: Comparison of RPHPLC and Microbial assay. % Assay
RPHPLC Microbial Assay
102.77 101.35
100.53 101.35
102.19 101.35
102.92 101.35
101.29 101.35
Assay results obtained by two methods were statistically evaluated using student’s t test,
which indicated that assay results are not statistically different (t calculated 0.925 < t theoretical
2.228) which indicated that two methods are statistically same and there is no significant
difference between the two. Therefore the methods developed and validated provide similar
results for prulifloxacin quantification in tablet dosage form11.
CONCLUSION
For daily quality control checks of pharmaceutical products it is essential to employ well
characterised, fully validated analytical method to obtain reliable results that can be
satisfactorily interpreted. The results obtained in this study show that the proposed RPHPLC
method for determination of prulifloxacin in tablet dosage form is accurate, specific, robust,
having a good linearity and precision characteristics. Moreover there is no statistical
significant difference between the RPHPLC and microbial assay (previously developed and
validated) for quantification of the drug. There the proposed RPHPLC and microbial assay
can both be routinely used for the quantification of the dosage form.
ACKNOWLEDGMENT
The authors are very much thankful to Micro Labs, Bangalore for providing the gift sample
of API, Prulifloxacin and to Goa College of Pharmacy for providing the facilities to carry out
the research work.
REFERENCES
1. Martindale. The complete Drug references, Sean C Sweetman. Pharmaceutical Press, 36th
Edn., London. 2009: 320.
2. Available from: http://en.wikipedia.org/wiki/ Prulifloxacin. Last accessed on 2014 Jan 2.
3. Guo L, Qi M, Jin X, Wang P, Zhao H. Determination of the active metabolite
of Prulifloxacin in human plasma by liquid chromatography–tandem mass
spectrometry. Journal of Chromatography.2006; 832:280-285.
4. Ravisankar P, Devalarao G , Devadasu CH, Sudhakar Saibabub G and P. Srinivasa Babu.
A Validated RP-HPLC Method for the Assay of Prulifloxacin in Marketed Drug Product
Using Levofloxacin as an Internal Standard. Int. J. Chem. Sci. 2013; 11(1):95-105.
5. Chaple D. R., Sambhare A. G. A validated stability indicating HPLC method for
Prulifloxacin. IJPT. 2010; 1(2):137-148.
6. Ravisankar P. and Devalarao G. Simultaneous separation of third and fourth generation
moxifloxacin determination in pharmaceutical dosage forms. Int J Pharm Bio Sci. 2013;
4(3):663 – 677.
7. Pokharkar D, Jadhav V, Pingale R, Dash GK. Development and Validation of
Spectrophotometric Method for Estimation of Prulifloxacin in Tablet Dosage Forms
Using Acetonitrile as a Solvent. Int.J.Pharm.Phytopharmacol.Res. 2012; 2(1): 32-34.
8. Ethiraj T, Revathi R , Dilli Prasad Acharya , Amudha M. New spectroscopic estimation of
Prulifloxacin using hydrotropic solubilization. Novel Science International Journal of
Pharmaceutical Science .2012; 1(9-10):664 -666.
9. Nagendhrababu B, Farhana MD, Jagathi V, Satishreddy K, Bakki Phanindra, Chaitanya
Kiran P. Spectrophotometric determination for Prulifloxacin . RJPBCS.2011; 2(3): 53-56.
10. Validation of Analytical Procedures. Text and Methodology Q2 (R1). ICH Harmonised
Tripartite Guideline; 2005. pg. 1-13.
11. Biostatistics for Pharmacy. Khan and Khanum. Ukaaz Publication, Second Edition. 2008.