University of Warwick institutional repository: http://go.warwick.ac.uk/wrap
A Thesis Submitted for the Degree of PhD at the University of Warwick
http://go.warwick.ac.uk/wrap/77390
This thesis is made available online and is protected by original copyright.
Please scroll down to view the document itself.
M A
E
G
NS I
T A T MOLEM
U N
IV ER
SITAS WARWIC
EN
SIS
Finding Network Modules and Motifs Regulating
Plant Stress Responses: Integration and Modelling
across Multiple Data Sets
by
Krzysztof Pola´
nski
Thesis
Submitted to the University of Warwick
for the degree of
Doctor of Philosophy
Systems Biology
Contents
List of Tables v
List of Figures vi
Acknowledgments viii
Declarations x
Abstract xi
Abbreviations xii
Gene Names xvii
Chapter 1 Introduction 1
1.1 Motivation . . . 1
1.1.1 Feeding an exponentially growing population . . . 1
1.1.2 Arabidopsis thaliana as a model organism in studying plant stress response . . . 2
1.2 Stress response in A. thaliana . . . 4
1.2.1 PAMP triggered immunity . . . 6
1.2.2 Effector triggered susceptibility . . . 7
1.2.3 Effector triggered immunity . . . 9
1.2.4 Examples of plant pathogens . . . 10
1.2.4.1 Pseudomonas syringae . . . 10
1.2.4.2 Botrytis cinerea . . . 11
1.2.5 Phytohormones in the plant stress response . . . 13
1.2.5.1 Jasmonic acid . . . 13
1.2.5.2 Salicylic acid . . . 13
1.2.5.4 Ethylene . . . 15
1.2.5.5 Crosstalk between the signalling of different phyto-hormones . . . 16
1.3 Transcription regulation and gene regulatory networks . . . 17
1.3.1 General overview of transcription . . . 18
1.3.2 Searching for a network footprint . . . 21
1.3.2.1 Clustering . . . 22
1.3.2.2 Biclustering . . . 23
1.3.3 Searching for gene regulatory network models . . . 26
1.3.3.1 Undirected co-expression networks . . . 26
1.3.3.2 Ordinary differential equation models . . . 27
1.3.3.3 Mining large-scale transcriptomic datasets for gene regulatory networks . . . 28
1.3.3.4 Experimentally derived networks . . . 30
1.4 Aims and organisation of this thesis . . . 32
Chapter 2 Wigwams: identifying gene modules co-regulated across multiple biological conditions 35 2.1 Introduction . . . 40
2.2 Materials and methods . . . 42
2.2.1 Input . . . 42
2.2.2 Identifying modules spanning multiple datasets . . . 43
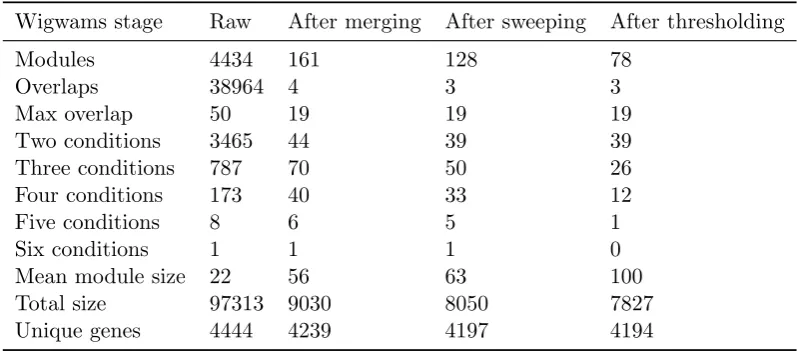
2.2.3 Merging similar modules spanning the same time series subset 46 2.2.4 Sweeping redundant modules spanning different dataset subsets 49 2.2.5 GO term and TF binding motif enrichment testing . . . 49
2.2.6 Yeast one-hybrid technique . . . 49
2.3 Results . . . 51
2.3.1 Wigwams systematically scans the data for evidence of co-regulation . . . 51
2.3.2 Wigwams effectively removes redundancy among modules . . 52
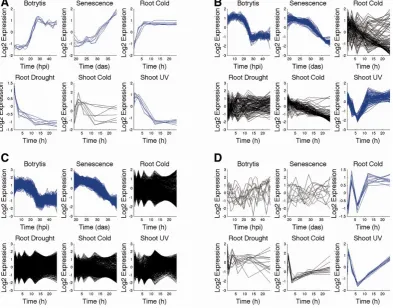
2.3.3 Wigwams reveals expression signatures of regulatory mecha-nisms . . . 53
2.3.4 Biological validation of detected modules . . . 55
2.4 Discussion . . . 58
Chapter 3 Transcriptional dynamics driving MAMP-triggered
Arabidopsis leaves following infection with Pseudomonas syringae
pv. tomato DC3000 61
3.1 Introduction . . . 65 3.2 Results . . . 68
3.2.1 Transcriptional dynamics of MTI and ETS revealed from a large-scale, highly-resolved time series expression study . . . 68 3.2.2 The majority of transcriptional changes are initiated by 6hpi 71 3.2.3 Early effector activity leads to major transcriptional changes
prior to increased bacterial growth . . . 72 3.2.4 Detailed analysis of gene expression patterns during MTI and
ETS . . . 77 3.2.5 Early sustained effector specific DEGs are predicted to
modu-late perception of external stimuli and chromatin re-organisation 81 3.2.6 Investigation of regulatory elements driving establishment of
defence or disease . . . 82 3.2.7 Multiple time series co-expression analysis predicts specific
regulation of pathogen-responsive genes . . . 85 3.2.8 Modelling the transcriptional network topology during disease
and defence . . . 88 3.3 Discussion . . . 94
3.3.1 The chronology of effector-mediated transcriptional repro-gramming . . . 94 3.3.2 Biological processes impacted by effectors . . . 96 3.3.3 An emerging role for chromatin remodeling early in the
sus-ceptible interaction . . . 97 3.3.4 Predictions of regulatory relationships underlying MTI and ETS 98 3.3.5 Network modelling highlights key effector-modulated genes . 99 3.4 Methods . . . 100
Chapter 4 Inference of functional gene regulatory networks mediat-ing Arabidopsis response to environmental stress 105
4.1 Introduction . . . 109 4.2 Results . . . 110
4.2.4 Functional inference for TFs mediating B. cinerea and P.
sy-ringae defence response . . . 124
4.2.5 Identification of a combinatorial regulation network module predicted to play a role in hormone signalling . . . 128
4.3 Discussion . . . 131
4.4 Methodology . . . 136
4.4.1 Inference of TF-only Network Models . . . 136
4.4.2 Identifying Wigwams modules . . . 137
4.4.3 Functional inference of Wigwams modules . . . 137
4.4.4 Network expansion and functional analysis . . . 137
Chapter 5 Discussion 139 5.1 Significance of the work . . . 139
5.2 Discussion of the applied methodology . . . 141
List of Tables
2.1 Gene module information during Wigwams analysis . . . 48
4.1 The distribution of Wigwams modules spanning each pair of conditions115 4.2 The comparison of the number of network edges in the original
tran-scription factor-only M-VBSSM models with the networks expanded with Wigwams modules . . . 124 4.3 The number of TFs in the individual pathogen response networks, as
well as the intersection, with predicted downstream functionality . . 127 4.4 The twelve selected genes and their prior (GO terms present in
an-notation) and inferred (result of functional analysis performed in the study) defence hormone related functionality . . . 128 4.5 The number of shared downstream targets between the five genes
List of Figures
1.1 The zigzag model, capturing the interactions between the plant and the pathogen . . . 5 1.2 Crosstalk between regulatory networks in A. thaliana response to
drought and cold . . . 19 1.3 Comparison of clustering and biclustering . . . 22
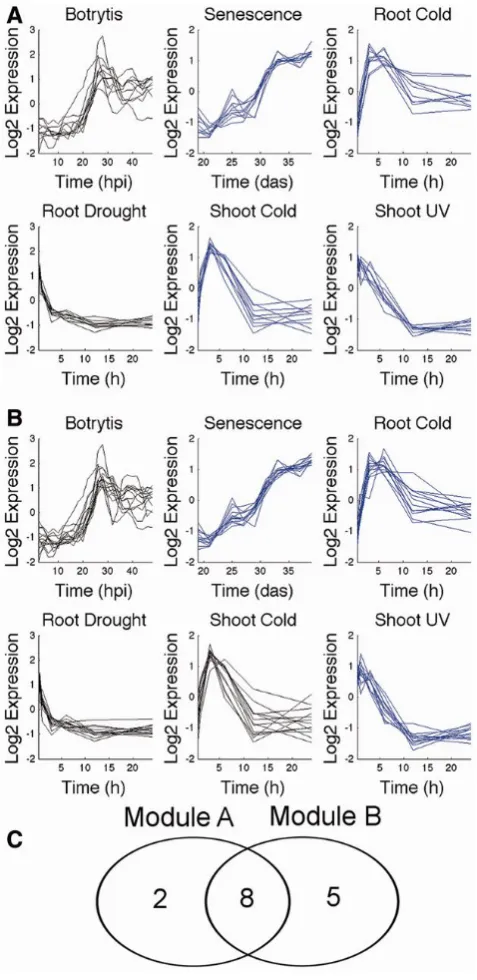
2.1 Strong evidence for dependent co-expression is detected during the module identification stage . . . 44 2.2 Merging . . . 47 2.3 Sweeping . . . 50 2.4 Four examples of modules showing different regulatory phenomena
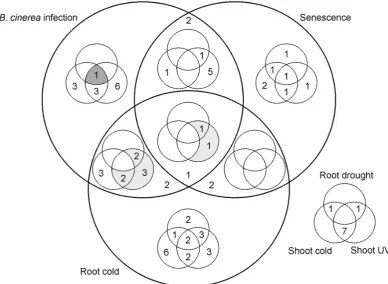
detected by Wigwams . . . 54 2.5 The number of modules identified for each combination of conditions 56 2.6 Wigwams modules are enriched in GO-terms and TF binding motifs 57
3.1 Dynamics of differentially expressed genes during basal defence and disease development . . . 70 3.2 Time at which gradients of DEGs begin to significantly differ between
treatments . . . 73 3.3 Growth curves of DC3000 and DC3000hrpA-, with selected GO terms
enriched by genes changing expression at indicated time points . . . 75 3.4 Response categories of DEGs capturing different MTI and ETS
pro-files and their validation . . . 78 3.5 Revealing links between TF binding motifs and temporal expression
patterns . . . 83 3.6 Genes containing the same transcription factor binding site(s) in their
3.7 The inferred transcription factor network model, jointly obtained for mock, DC3000hrpA-and DC3000 . . . 90 3.8 The expression profiles of three genes present in the inferred
tran-scription factor network model . . . 92
4.1 The process of obtaining M-VBSSM network models . . . 112 4.2 The number of Wigwams modules identified for each condition
com-bination and the distribution of module totals across the number of conditions they span . . . 114 4.3 The overrepresentation of GO term groups among gene members of
Wigwams modules . . . 117 4.4 The overrepresentation of regulatory motifs bound by known
tran-scription factors in the promoters of genes identified as part of Wig-wams modules . . . 119 4.5 The expression of two example Wigwams modules identified by
analysing the six Arabidopsis time course datasets . . . 120 4.6 The primary process of expanding M-VBSSM networks with
non-transcription factor genes using Wigwams modules . . . 123 4.7 The expanded M-VBSSM network connections that are in common to
both theB. cinerea andP. syringae infection models and functional inference for expanded M-VBSSM networks . . . 126 4.8 A truncated view of the five-gene combinatorial regulation hormone
Acknowledgments
Dr Katherine Denby, for being the model supervisor, giving me ample
oppor-tunities to collaborate on multiple projects and publications, and introducing the
word gobbledygook to my vocabulary.
Dr Sascha Ott, for valuable feedback keeping me focused on the big picture
and allowing me to hone my teaching skills at the programming course.
Dr B¨arbel Finkenst¨adt, for keeping me in touch with the statistical realm,
in-troducing me to the benefits of using splines for data processing, and recommending
APTS courses - the Glasgow one was particularly enjoyable!
Prof. Jim Beynon, Dr Miriam Gifford, Dr Daniel Hebenstreit and Dr
Si-mon Spencer, for constituting my advisory panel, offering helpful suggestions, and
keeping me on track with the project.
The Warwick Systems Biology Doctoral Training Centre, for the funding
which allowed me this opportunity — in spite of me taking a month to reply due to
faulty email forwarding between accounts!
Prof. Murray Grant and Dr Laura Lewis, for letting me get involved in the
Pseudomonas syringae analysis and opening my eyes to the process of biological
interpretation by finding sense in my initial run results.
Dr Christopher Penfold, for his endless patience in explaining the workings of
VBSSM, GP2S and CSI. Dr Dafyd Jenkins, for all-around aid, including Cytoscape
expression visualisation and the gradient tool. All the members of the PRESTA
project, for giving me multiple chances to work on my presenting skills and providing
insightful comments on my research.
calm support in the face of adversity. Claire Stoker, for being the perfect down
to earth conversation partner, offhand knowledge of haustoria, and showing me
leaf seven in the face of adversity. Lennie Foster, for educating me how not to
accidentally burn the greenhouse down and monkey cookies. The rest of the C030
people, past and present, for a healthy dose of camaraderie both on and off campus.
All of you folks are awesome and make me wish I had come out of my shell quicker.
Jos´e Ricardo Cam˜oes de Oliveira, for being the greatest friend imaginable,
and turning out to exist in the flesh once we were both located in the UK. Also for
making me look up how to make all those weird characters in LATEX. Soon enough
you’ll be looking how to make a ´n, mark my words!
Last, and certainly not least, my mom, dad and sister. I wouldn’t be here
if not for your never-ending support and warmth only a family can give, be it in
the form of picking me up from the airport at ungodly hours, casual EM discussion
during walks, or simple long-distance conversations about daily minutiae. I dedicate
Declarations
This thesis is presented in accordance with the regulations for the degree of Doctor
of Philosophy. It has been composed by myself and has not been submitted in any
previous application for any degree except where otherwise stated. The work in this
Abstract
In spite of constant technological advancements, world hunger remains a major challenge due to exponential population growth, and the loss of effectiveness of crop treatments such as pesticides. As such, comprehending the plant response to stress is of great importance in breeding more resilient crops. Whilst different stresses elicit distinct responses from the plant, a core set of regulatory interactions are conserved across multiple responses and operate as networks.
In this thesis, computational approaches were used to elucidate such reg-ulatory interactions from time course expression datasets, predominantly through identification of genes co-expressed across multiple stimuli responses as a footprint of shared network co-regulation. The identification of such network footprints was tackled through Wigwams, a data mining algorithm capable of detecting groups of genes co-regulated across multiple datasets. In contrast to other algorithms, Wig-wams assesses whether the co-expression it detects is likely to reflect co-regulation. The modules it found were significantly enriched in functionality and cis-regulatory elements, indicating actual co-regulation.
Wigwams and other computational approaches were applied to time course expression data capturing Arabidopsis thaliana response to Pseudomonas syringae
pv. tomato DC3000. The presence of a virulent and avirulent strain in the experi-ment allowed for the temporal deconstruction of the regulatory events underlying the virulent strain’s attempts to overcome plant defence through effector action. This analysis led to the detection of a number of effector-specific transcription changes stifling the defence response and manipulating the host’s gene and protein expres-sion. A transcription factor-only regulatory network model was proposed to explain the detected network footprints.
Abbreviations
ABA abscisic acid
ABRE ABA-responsive element
BATS Bayesian Analysis of Time Series
bHLH basic helix loop helix
bp base pair
bZIP basic leucine zipper
cfu colony forming unit
ChIP chromatin immunoprecipitation
CSI Causal Structure Inference
CUC cup-shaped cotyledon
das days after sowing
DBD DNA binding domain
DC3000 Pseudomonas syringae pv. tomato DC3000
DE differentially expressed
DEG differentially expressed gene
EAR ethylene responsive element binding factor associated amphiphilic repression
EBS EIN3 binding site
ECTDISA Enrichment Constrained Time-Dependent Iterative Signature Algorithm
EDISA Extended Dimension Iterative Signature Algorithm
EM Expectation Maximisation
ER endoplasmatic reticulum
ERF ethylene response factor
ETI effector triggered immunity
ETS effector triggered susceptibility
FDR false discovery rate
GGM graphical Gaussian model
GO Gene Ontology
GP Gaussian process
GP2S Gaussian process two-sample test
GTF general transcription factor
GUI graphical user interface
HKDM histone lysine demethylase
HKMT histone lysine methyltransferase
hpi hours post inoculation
HR hypersensitive response
ISA Iterative Signature Algorithm
JA jasmonic acid
JA-Ile jasmonoyl-L-isoleucine
JAZ jasmonate ZIM-domain-containing
LIMMA Linear Models for Microarray Data
LRR leucine-rich repeat
LRR-RK leucine-rich repeat receptor kinase
LTAE long-term agroecosystem experiment
M-VBSSM Metropolis VBSSM
MAANOVA Microarray Analysis of Variance
MAMP microbe-associated molecular pattern
MAPK mitogen-activated protein kinase
MEME Multiple EM for Motif Elongation
mRNA messenger RNA
MSR mean square residue
MTI MAMP triggered immunity
NAC NAM, ATAF, CUC
NAM no apical meristem
NB nucleotide-binding
ODE ordinary differential equation
PBM protein-binding microarray
PCC Pearson correlation coefficient
PDI protein disulfide isomerase
PP2C protein serine/threonine phosphatase 2C
PR pathogenesis-related
PRR pattern recognition receptor
PSSM position specific scoring matrix
PTI PAMP triggered immunity
pv. pathovar
R gene resistance gene
RING Really Interesting New Gene
RLK receptor like kinase
RLP receptor like protein
RNA ribonucleic acid
ROC receiver operating characteristic
ROS reactive oxygen species
SA salicylic acid
SNRK2 SNF-1 related protein kinase 2
SSM state space modelling
T-DNA transfer DNA
TAF TBP associated factor
TAIR The Arabidopsis Information Resource
TBP TATA binding protein
TF transcription factor
TFIIA transcription factor II A
TFIIB transcription factor II B
TFIID transcription factor II D
TFIIE transcription factor II E
TFIIH transcription factor II H
TPL TOPLESS
TR transcriptional repressor
TRF TBP related factor
TTSS type III secretion system
UV ultraviolet
VBSSM Variational Bayesian State Space Modelling
Wigwams Wigwams identifies genes working across multiple situations
Y1H yeast one-hybrid
Gene Names
ABI5 AT2G36270
AFP3 AT3G29575
ANAC019 AT1G52890
ANAC055 AT3G15500
ANAC058 AT3G18400
ANAC072 AT4G27410
ANAC100 AT3G15170
ARF3 AT2G33860
ATAF1 AT1G01720
BAK1 AT4G33430
BOI AT4G19700
BOS1 AT3G06490
bZIP63 AT5G28770
CCA1 AT2G46830
COI1 AT2G39940
CTR1 AT5G03730
CUC1 AT5G61430
EBF1 AT2G25490
EBF2 AT5G25350
EDS1 AT3G48090
EFR AT5G20480
EIL1 AT2G27050
EIN2 AT5G03280
EIN3 AT3G20770
ERF1 AT3G23240
ERF7 AT3G20310
ERF8 AT1G53170
FBH3 AT1G51140
FLS2 AT5G46330
FRK1 AT2G19190
GRP7 AT2G21660
GRX480 AT1G28480
HDA6 AT5G63110
HDA19 AT4G38130
JAR1 AT2G46370
LHY AT1G01060
LOX2 AT3G45140
MAP kinase 4 AT4G01370
MAPKKK18 AT1G05100
MIN7 AT3G43300
MYC2 AT1G32640
NINJA AT4G28910
NPR1 AT1G64280
ORA59 AT1G06160
PAD4 AT3G52430
PBS1 AT5G13160
PDF1.2 AT5G44420
PDI1 AT3G54960
PDI2 AT5G60640
PDI5 AT1G21750
PDI6 AT1G77510
PEN2 AT2G44490
PEN3 AT1G59870
PIL5 AT2G20180
PKS5 AT2G30360
PR1 AT2G14610
PSB27 AT1G03600
PSB29 AT2G20890
PSBO1 AT5G66570
PSBQA AT4G21280
PUB22 AT3G52450
PUB23 AT2G35930
Rap2.6 AT1G43160
RAV1 AT1G13260
RAV2 AT1G68840
RBOHD AT5G47910
RIN4 AT3G25070
RPM1 AT3G07040
RPS2 AT4G26090
RPS4 AT5G45250
RPS5 AT1G12220
RRS1-R AT5G45260
SAP12 AT3G28210
SAP18 AT2G45640
SDG26 AT1G76710
SIGA AT1G64860
STZ AT1G27730
SWI3B AT2G33610
TBP3 AT5G67580
TCP1 AT1G67260
TCP3 AT1G53230
TCP20 AT3G27010
TGA3 AT1G22070
TOC1 AT5G61380
TOPLESS AT1G15750
VSP2 AT5G24770
WIN2 AT4G31750
WRKY9 AT1G68150
WRKY11 AT4G31550
WRKY17 AT2G24570
WRKY22 AT4G01250
WRKY29 AT4G23550
WRKY33 AT2G38470
WRKY38 AT5G22570
WRKY41 AT4G11070
WRKY53 AT4G23810
WRKY62 AT5G01900
WRKY70 AT3G56400
XND1 AT5G64530
ZAR1 AT3G50950
Chapter 1
Introduction
1.1
Motivation
1.1.1 Feeding an exponentially growing population
Food security remains one of the primary challenges in need of tackling by current society, predominantly as a result of the constant, exponential increase in the world population. According to the United States Census Bureau, the world population crossed 7 billion people on March 12, 2012. This figure has been conservatively estimated to reach 9.5 billion by 2050 (United Nations, 2012), marking an increase of 2.5 billion people over the span of 38 years. This creates the need to optimise food production yield, as 15 million km2 are already devoted to the growth of crops worldwide (Ramankutty et al., 2008) and any additional expansion of this land is likely to involve taking over space currently occupied by rain forests and other areas with significant ecological functionality (Gibbs et al., 2010).
not involve this sort of treatment. In addition to the complications from the most popular methods of handling biotic stimuli, a number of abiotic environmental con-ditions are also problematic to crop yield. The most prevalent of these is drought — worldwide, it is responsible for crop losses up to 60% (Bruce et al., 2002). Only 16% of all farmland gets the appropriate amount of water (Siebert et al., 2005) and climate change is likely to exacerbate the drought problem (Wheeler and von Braun, 2013).
A natural course of action is to investigate the nature of the plant’s response to such stimuli, leading to the ability to augment the stimulus response and increase resilience. It should be noted that attempts at plant modification to decrease sus-ceptibility to biotic or abiotic stimuli might adversely affect crop yield. As evidenced by the maize mutantopaque-2, increasing resilience towards stress can come at the cost of loss of biomass, as the plant is tuned towards damage prevention and survival (Herms and Mattson, 1992). Nevertheless, improvements in the existing farming in-frastructure to decrease crop exposure to stress combined with careful enhancement of the plant’s natural ability to handle adverse conditions should result in increased resilience and steady yield, whilst lessening the reliance on chemical agents.
1.1.2 Arabidopsis thaliana as a model organism in studying plant
stress response
Thale cress (Arabidopsis thaliana) has been the model organism of choice in plant research. A. thaliana possesses one of the smallest plant genomes, spanning 115.4 Mbp across five chromosomes. It was the fourth published genome sequence (Ara-bidopsis Genome Initiative, 2000), preceded only by baker’s yeast (Saccharomyces cerevisiae, the model eukaryote) (Goffeau et al., 1996), the nematode ( Caenohabdi-tis elegans) (C. elegans Sequencing Consortium, 1998) and the fruit fly (Drosophila melanogaster) (Adams et al., 2000). The subsequent creation of The Arabidopsis Information Resource (TAIR) (Rhee et al., 2003) allowed for the easy integration of a variety of information sources, including extensive gene annotations and the positioning of T-DNA insertions in mutant lines, centralising the access to a high amount of information critical for research.
the development of floral dip, wherein developingA. thaliana floral tissue is dipped in anA. tumefaciens, sucrose and surfactant solution (Clough and Bent, 1998). A large-scale knockout experiment was performed by SALK, in which a conservative set of 88,122 long T-DNA integration sites were identified to span almost 75% of the
A. thalianagenes (Alonso et al., 2003). The great degree of success of this approach stems from the high gene density of A. thaliana, with its genome containing low amounts of intragenic DNA and being of overall small size for its gene count (Feuil-let and Keller, 1999). Other T-DNA insertion collections, such as SAIL (Sessions et al., 2002) and GABI-KAT (Kleinboelting et al., 2011) have also been developed. The resulting lines are stored in stock centres, such as ABRC and NASC, all over the world for ease of access. It is also possible to obtain constitutive overexpressors by introducing a fusion of the gene of interest under the control of the cauliflower mosaic virus 35S promoter to the genome (Onouchi et al., 2000). A more refined control over the expression of a gene of interest can be achieved through the use of promoters stimulated through an exposure to a particular compound, such as dexamethasone (Ullah et al., 2001).
Other advantages of A. thaliana involve its practicality from an experiment design perspective. The life cycle of A. thaliana is very rapid, going from seed to seed in 5 to 7 weeks, allowing for the quick establishment of mutations and elucidation of lines with multiple genes knocked out (Boyes et al., 2001). It is possible to growA. thaliana in many different environments, such as greenhouses, fluorescent lights in laboratory incubators or petri dishes, allowing for flexible and versatile experimental application (Meinke et al., 1998). The plants are small, with full-grown Col-0 rosettes reaching an average size of 8 cm by 7 cm. Plants can be conveniently grown next to each other. In addition to that,A. thaliana has a high seed yield, averaging about 5000 seeds per plant (Boyes et al., 2001). This allows for a single genotype to be easily maintained throughout the course of an experiment. Additionally, the seed stock can be easily and compactly stored in a cold room.
Due to the diversity in the plant kingdom, research findings made on A. thaliana may not be immediately transferable to species with more real-world ap-plication, but the general sense of the findings should be preserved. In spite of the fact thatA. thaliana is a dicot and a number of the more popular crop plants, such as rice, wheat and maize, are monocots, a degree of conservation of genetics and physiology is present between all plant species. This is manifested by numerous ex-amples of expression alteration of a gene giving similar phenotypic results between
2000), further backing the claim of a conserved inter-species nature and asserting the validity ofA. thaliana as a model organism for studying stress response.
1.2
Stress response in
A. thaliana
Plants regularly encounter a variety of both biotic and abiotic environmental con-ditions adversely affecting their development and survival, henceforth referred to as stresses. Abiotic stresses, such as drought, high light, cold, high salinity and UV light exposure, are far more prevalent than pathogen infections and account for a steady loss of yield in crops worldwide (Kreps et al., 2002). Whilst less prevalent than abiotic stresses, pathogen infections are also of agricultural significance. This form of stress will be the main focus of the following sections due to the scope of the work carried out in Chapters 2, 3 and 4.
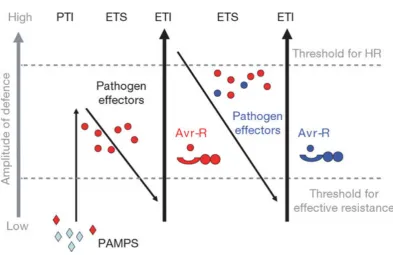
In spite of the lack of adaptive immunity and a vast array of pathogenic organisms present in the environment, plants are able to resist the attacks of the majority and are usually only susceptible to a select few. This stems from the depth of the plant defence response, which starts at preformed physical and chem-ical layers designed to keep the pathogens out, and is optionally followed by a breadth of inducible responses (including defence-related gene expression, produc-tion of antimicrobial compounds, oxidative bursts and programmed cell death) in case a pathogen manages to breach the preformed layers (Van Loon et al., 2006). The plant defence system, which is outlined in Figure 1.1 (Jones and Dangl, 2006), starts at host encoded pattern recognition receptors (PRRs), which are capable of identifying a range of pathogen-associated molecular patterns (PAMPs), which are conserved elements of compounds that the pathogens need for basic functionality, such as flagellin (Zipfel and Felix, 2005). This triggers a response known as PAMP triggered immunity (PTI), which is sufficient to prevent infection by many pathogens and likely forms the core of non-host resistance. A number of successful pathogens are capable of secreting specific proteins, called effectors, into the plant, with the aim of suppressing PTI and facilitating disease through active manipulation of the plant’s cellular processes. This is known as effector triggered susceptibility (ETS). In response to that, the plant is capable of direct or indirect identification of effec-tors and activating another layer of defence to counteract them, resulting in disease resistance. This is known as effector triggered immunity (ETI) (Jones and Dangl, 2006).
acid (ABA) and ethylene. Signalling induced by these hormones, as well as the resulting crosstalk between them, is a key element of the response to a variety of biotic and abiotic stresses (Bari and Jones, 2009). Effects of this signalling, as well as from other signalling pathways triggered by the stress, result in a massive transcriptional overhaul — both biotic (Windram et al., 2012) and abiotic (Kilian et al., 2007) stimuli result in the altering of expression of thousands of genes with the aim of responding to the stimulus. In the case of abiotic stress, there appears to be an early conserved condition-independent general transcriptional response that subsequently diverges into more stress-specific processes. This was first identified for cold, salt and osmotic stress, with a core of 65 genes showcasing joint differential expression across all three conditions at 3 hours of exposure, with the overlap falling significantly by 27 hours of exposure (Kreps et al., 2002). A similar early non-specific response was later observed across cold, drought and UV-B light, hinting at a core of plant environmental stress response genes (Kilian et al., 2007).
A common environmental scenario is the co-occurrence of multiple biotic and abiotic stimuli, often demanding antagonistic action from the plant that it is unable to perform (Mittler, 2006). The most prevalent example of this would be the joint application of drought and heat stress. In the case of heat, the plant’s primary response is to open its stomata to cool the leaves by transpiration. However, in the case of drought, opening stomata is repressed. As such, a combination of the two is disastrous, where the plant has to cope with the effects of drought whilst at the same time having its leaf temperature increased by the heat (Rizhsky et al., 2002). This results in massive crop losses — in August 2000 alone, a co-occurrence of drought and heat stress across the USA caused losses upwards of $4.2 billion (Mittler, 2006). This signals an important avenue for follow-up research once a sufficient depth of understanding of individual stress responses is reached, due to the lack of realism of a single isolated stress occurring naturally.
1.2.1 PAMP triggered immunity
(LRR-RK) FLS2 (Gømez-Gømez and Boller, 2000). FLS2 binds flg22 with its LRR ectodomain, changing spatial conformation. This allows BAK1, another LRR-RK that is co-located with FLS2 but unable to interact with it in the absence of a flagellin stimulus, to create a complex with FLS2. The newly formed heterodimer brings the intracellular kinase domains into contact, initiating defence signalling (Boller and Felix, 2009). It has been shown that knocking out FLS2 inA. thaliana leads to an increased susceptibility to the pathogenPseudomonas syringae pv. tomato DC3000 when it is sprayed onto the leaf surface (Zipfel et al., 2004) presumably through a re-duced ability to activate PTI. Plants are not restricted to identifying a single PAMP per pathogen, with the identification of bacteria not merely relying on flagellin, but also aided by the detection of other compounds, such as EF-Tu (Zipfel et al., 2006) A number of PAMPs, representative of a number of different pathogens, are bound by known PRRs, including a glucan receptor in soybean (Fliegmann et al., 2004), a chitin receptor in rice (Kaku et al., 2006) andA. thaliana (Miya et al., 2007), and a xylanase receptor in tomato (Ron and Avni, 2004). Additional PAMPs are well defined, but the current state of PRR knowledge is insufficient to assign particular LRR-RKs to them (Boller and Felix, 2009).
The predominant role of PTI is to halt further pathogen colonisation (Jones and Dangl, 2006). The earliest effects, observed within 5 minutes of the stimulus, include ion fluxes leading to membrane depolarisation (Mith¨ofer et al., 2005), and an activation of the mitogen-activated protein kinase (MAPK) cascade culminating in the activation of WRKY-type transcription factors (Asai et al., 2002), reactive oxygen species (ROS) production (Asai et al., 2008), and an increase in protein phosphorylation (Boller and Felix, 2009). The next wave of effects, observed up to 30 minutes after the stimulus, are the biosynthesis of ethylene (Spanu et al., 1994), retraction of PRRs (possibly related to the degradation of activated recep-tors) (Robatzek et al., 2006), and major transcriptional changes (Zipfel et al., 2004). Long-term effects are callose deposition (Gømez-Gømez et al., 1999), and the inhi-bition of growth as the plant shifts its physiology to a defence role (Boller and Felix, 2009).
1.2.2 Effector triggered susceptibility
plant to derail PTI or make the infection process easier (Jones and Dangl, 2006). Different pathogen species secrete effectors in alternate ways — in bacteria, effec-tors are introduced to the plant through the means of the type III secretion system (TTSS), taking on the form of a needle protruding from the surface of the pathogen (Kubori et al., 1998), whilst oomycetes and fungi utilise haustoria, finger-like struc-tures that protrude into the plant cell and secrete effectors that subsequently cross through the cell membrane with the aid of translocation domains (Bozkurt et al., 2012).
Once present in the plant cell, the nature of the tasks carried out by the effectors is quite varied, can involve both up- and down-regulation, and only a fraction of their targets have been identified. Two P. syringae DC3000 effectors, AvrPto and AvrPtoB, are capable of forming complexes with the kinase domain of BAK1 (Shan et al., 2008), making it impossible for the BAK1-FLS2 complex outlined in the previous section to be created in response to flagellin detection, effectively muting the PRR and derailing the PTI response. Additionally, AvrPtoB was found to contain a domain similar in structure to E3 ubiquitin ligase, resulting in the plant cell degrading the PRR components the effector binds to (Rosebrock et al., 2007). HopAI1, anotherP. syringae effector, interrupts the PRR signalling at a later stage by dephosphorylating kinases of the MAPK cascade (Zhang et al., 2007). Effectors can also target processes downstream of the initial PRR response, halting phenomena that make the infection process more difficult. HopU1 modifies a number of A. thaliana RNA-binding proteins, with GRP7 as an example, whilst HopM1 triggers the degradation of MIN7, a protein involved in vesicle trafficking. Knockout lines for the two aforementioned genes showed increased susceptibility to
1.2.3 Effector triggered immunity
Shifting back to the plant perspective, the pathogen injecting effectors and phy-totoxins that result in the hijacking of the defence response is detrimental. As such, plants evolved the ability to respond to the effector actions, triggering a sec-ond wave of defence response deemed effector triggered immunity (ETI) (Jones and Dangl, 2006). R (resistance) genes are protein receptors located within the plant cell responsible for detecting effectors and/or their activity. There is a degree of variation in the structure and domains of R genes, but the two components that are always present are a nucleotide-binding (NB) domain and leucine-rich repeat (LRR) domain. The mechanics of the identification of effector action involve a bait and switch model, wherein the R gene protein is inactive until the detection of the signal by the joint work of the LRR domain and variable N-terminus domains results in a spatial conformation shift that activates the NB domain, initiating the defence response (Collier and Moffett, 2009). In the case of the pathogen targeting RIN4, as outlined in the previous section,A. thaliana possesses two distinct R genes that detect the presence of the effectors indirectly. RPS2 identifies the pieces of RIN4 that were cleaved by AvrRpt2 (Mackey et al., 2003), whilst RPM1 detects RIN4 phosphorylated by AvrRpm1 or AvrB (Mackey et al., 2002). R genes are not lim-ited to indirect detection of effector activity — for example, RRS1-R directly binds the effector PopP2, leading to Ralstonia solanacearum resistance (Deslandes et al., 2003).
It should be of little surprise that the actual mechanics of ETI response are relatively similar to PTI — PTI is quite potent at handling pathogens, so ETI activates those processes again, getting around the pathogen’s attempts at not being detected. ROS production and MAPK cascade activation return, but at a much higher intensity and prolonged duration (Tsuda and Katagiri, 2010). A massive transcriptional reprogramming is also observed, with WRKY transcription factors once again being a key driving force behind the overhaul (Wu et al., 2014). A process not as common in PTI is the hypersensitive response (HR), leading to rapid programmed cell death restricting pathogen growth. Some of its triggers are the detection of AvrRps4 by R gene RPS4, or the detection of AvrRpm1 by RPM1 (Aarts et al., 1998). It has been shown that autophagy, a catabolic mechanism leading to the degradation of unnecessary cell components, plays an important role in carrying out the programmed cell death (Hofius et al., 2009).
ZED1, a non-functional kinase, which is acetylated by HopZ1a and subsequently triggers ETI via ZAR1 (Lewis et al., 2013). The arms race between the plant and the pathogen, wherein the plant attempts to get rid of the pathogen and the pathogen attempts to stifle the defence response and carry out infection, has been named the zigzag model. This is an on-going process, as pathogen selection can lead to changes in the secreted effectors, avoiding triggering ETI. This results in plant selection, with individuals capable of identifying the new effectors via novel R genes being favoured (Jones and Dangl, 2006).
1.2.4 Examples of plant pathogens
During its life, a plant is likely to encounter a number of biotic stimuli. Outlined be-low are two pathogens, Pseudomonas syringae and Botrytis cinerea, representative of hemibiotrophic bacteria and necrotrophic fungi respectively.
1.2.4.1 Pseudomonas syringae
Pseudomonas syringae is a Gram-negative rod bacterium with polar flagellation. The syringae stems from Syringa vulgaris (lilac), the plant species from which the originalP. syringaestrain was isolated from by van Hall in 1902 (Hirano and Upper, 1990). P. syringae is hemibiotrophic, initially living on the exterior of the plant as an epiphyte, and later moving into the apoplast (intracellular space) as a pathogenic endophyte (Jin et al., 2003). The ability to cause disease by a particularP. syringae
strain is dependent on the host, and as such P. syringae strains are grouped into pathovars (pv.) by host range (Block and Alfano, 2011). In the case of disease, the prime outcome is plant tissue necrosis, which leads to symptoms ranging from leaf spots to stem cankers (Jin et al., 2003). The early availability of the genomes of a number ofP. syringae strains, in combination with their ability to cause disease in model plant organisms, has ledP. syringaeto become the model system for studying plant-pathogen interactions (Mansfield, 2009).
TheHRP genes can be divided into three classes —HRC (HRP genes conserved), core TTSS structural components that share a great deal of sequence similarity with flagellum assembly genes, implying a common ancestry of both structures (Gophna et al., 2003); regulatory proteins that induce the expression of the remainingHRP
genes in apoplast-like environmental conditions (Bretz et al., 2002); and some of the secreted effectors and extracellular structural components of the TTSS (Jin et al., 2003). This includes HrpA, one of the aforementioned extracellular structural components, with a pivotal role in the creation of the effector-secreting needle — the deletion of this gene results in an avirulentP. syringaestrain, incapable of delivering effectors to the plant (Roine et al., 1997). In the case of successful introduction of effectors into the plant in an attempt to derail the defence response and adjust any desired cellular processes, it is possible for the plant to detect effector presence through R genes and initiate ETI. Examples of A. thaliana P. syringae-specific R genes include RPM1, RPS2, RPS4, RPS5 and PBS1 (Katagiri et al., 2002). It should be noted that P. syringae does not just utilise effectors during infection — a number of phytotoxins are also secreted, including coronatine, which mimics jasmonic acid and overcomes salicylic acid-based biotic pathogen defence responses (Brooks et al., 2005), with its main role being overcoming stomatal closure initiated as part of the defence response (Melotto et al., 2006), and syringolin, which inhibits the proteasome (Groll et al., 2008).
P. syringaeis also capable of ice nucleation, with the bacteria inducing frost damage on plants in temperatures higher than unassisted environmental conditions, potentially in order to access nutrients (Hirano and Upper, 1990). Subsequently, the entire life cycle of the bacteria was identified, with the ice nucleation ability playing a relevant role in precipitation — epiphyticP. syringae on plant surfaces get taken up to the clouds by air currents, from which they are deposited to lakes and rivers by rain and snow, from where they are transported to plants via either natural or human-created irrigation (Morris et al., 2008).
1.2.4.2 Botrytis cinerea
exhibiting symptoms in transport or when placed on sale (Williamson et al., 2007). The established way to combatB. cinerea is with the aid of a variety of fungicides, but the pathogen has begun exhibiting resistance to some of the compounds in use (de Waard et al., 2006).
Once B. cinerea senses that the host tissue is sufficiently rich in nutrients, the conidia germinate and form appressoria, a specialised infection structure that breaches the host cuticle with the aid of a penetration peg (van Kan, 2006). The penetration pegs don’t rely on pressure alone to make their way into the plant, but are aided by cutinases and lipases when breaching the cuticle and by pectinases and cellulases when reaching the plant cell wall underneath (Williamson et al., 2007). Once the plant senses the infection through chitin detection, it initiates the PTI response (Mengiste, 2012). As part of the PTI response, the plant secretes ROS in an attempt to get rid of the pathogen, which the fungus responds to by secreting catalases and peroxidases that decompose the ROS (Schouten et al., 2002). B. cinerea proceeds to kill the plant cells, utilising phytotoxic proteins inducing cell death (Staats et al., 2007), botrydial and other phytotoxic metabolites (Colmenares et al., 2002) and oxalate, which has been shown to cause plant wilting (Dutton and Evans, 1996).
The A. thaliana response to B. cinerea infection is considerably different to that following P. syringae infection, as the main goal of the fungal pathogen is inducing necrosis and the plant has to attempt to counteract the phytotoxic effects of the introduced compounds. The hypersensitive response, which is a component in the response toP. syringae infection, is actually of huge benefit toB. cinerea(Govrin and Levine, 2000). Another divergence from the response to the aforementioned bacterial pathogen is the lack of R gene action — instead of a full ETI activation if any of the gene-for-gene relationships are satisfied,B. cinerearesistance is conferred incrementally through the action of multiple genes. Examples of genes involved in this incremental resistance include the transcription factor BOS1, potentially activated through ROS emitted by the pathogen, with its downstream signalling aiming to inhibit necrosis (Mengiste et al., 2003), and the RING E3 ubiquitin ligase BOI restricting toxin-induced cell death triggered by α-picolinic acid (Mengiste,
2012).
Stuebler, 2000).
1.2.5 Phytohormones in the plant stress response
1.2.5.1 Jasmonic acid
Jasmonic acid (JA) is a lipid-derived molecule, originating from the fatty acid α
-linoleic acid from chloroplast membranes (Delker et al., 2006). The role of JA is very broad, with the phytohormone being involved in the regulation or signalling of developmental functionality, senescence, herbivore attack, wounding, light response and abiotic stress, but its primary role is in the response to necrotrophic pathogens (Bari and Jones, 2009; Robert-Seilaniantz et al., 2011). JA-induced signalling leads to the production of assorted stress-related metabolites, including glucosinolates, phenylpropanoids and anthocyanins (Pauwels and Goossens, 2008).
The JA signalling pathway involves the hormone molecule initiating the degradation of jasmonate ZIM-domain-containing (JAZ) transcriptional repressors. In the absence of JA, JAZ proteins bind target transcription factors, forming a com-plex with TOPLESS (TPL) mediated by NINJA (Pauwels and Goossens, 2008) that represses the activity of the bound transcription factor through histone deacetylation (Causier et al., 2012). The 12 JAZ proteins are capable of homo- and heterodimeris-ingin vitro through a conserved TIFY domain, suggesting a role in the fine-tuning of the signal response (Chini et al., 2009). In the presence of JA, JAR1 conju-gates it with isoleucine forming JA-Ile (Staswick and Tiryaki, 2004), leading JAZ proteins to form a complex with COI1, which subsequently gets degraded (Sheard et al., 2010). This results in the decomposition of the structure repressing the tran-scription factor targets, allowing them to induce trantran-scription of relevant genes. The transcription factors bound by JAZ proteins can induce two distinct response pathways, with MYC2 predominantly leading to the wounding response (Pieterse et al., 2009), whilst EIN3 and EIL1 drive the defence response, with key downstream targets including the transcription factors ERF1, PDF1.2 and ORA59 (Zhu et al., 2011).
1.2.5.2 Salicylic acid
cell death, and the development of systemic acquired resistance (SAR) (Vlot et al., 2009). SAR is a phenomenon wherein plant tissue located away from the primary pathogen infection site develops long-term infection resistance, primarily through the induction of pathogenesis-related (PR) genes (Durrant and Dong, 2004). An ex-ample PR gene is PR1, which confers resistance toP. syringae by limiting pathogen growth (Glazebrook, 2005). SA is also an active metabolite of aspirin.
SA synthesis is triggered by EDS1 and PAD4 upon sensing pathogen presence (Durrant and Dong, 2004). The produced SA spreads to distal plant cells, wherein it activates NPR1. In the absence of SA, NPR1 forms oligomers in the cytoplasm, but upon SA introduction, the resulting redox change splits the NPR1 complex into monomers and the proteins get transported into the nucleus (Mou et al., 2003). Once there, NPR1 binds transcription factors from the TGA and WRKY families and leads to the induction of PR gene transcription (Pieterse et al., 2009).
1.2.5.3 Abscisic acid
Abscisic acid (ABA) is an isoprenoid, obtained in plants by cleaving 40-carbon carotenoids (Nambara and Marion-Poll, 2005). The hormone’s name derives from the past belief that it plays a key role in the abscission (shedding) of leaves, but it has since been shown to not be the case (Jackson and Osborne, 1970). ABA is only involved in regulating abscission in a small number of plant species (Gomez-Cadenas et al., 2002). The hormone plays a role in a variety of developmental processes, such as seed germination, dormancy, lateral root formation, flowering in-hibition and senescence, as well as a number of abiotic stresses (Asselbergh et al., 2008). ABA’s role in the abiotic stress response is predominantly centred on plant water balance, including inducing stomatal closure in drought (Tuteja, 2007). As-sessing the transcriptional response of rice to cold, drought, salt and ABA treat-ment revealed a strong association between the induced genes, in particular between drought, salt and ABA exposure, further cementing ABA’s role as a crucial agent in the abiotic stress response (Rabbani et al., 2003). Interestingly, ABA’s involvement in response to pathogen infection is a forceful regulation of a negative defence pheno-type, going as far as inducing disease symptoms from Cladosporium cucumerinum, a potato nonpathogen, on ABA-treated potato slices (Henfling et al., 1980). The role of ABA in pathogen defence response appears to be pathogen-specific, though, as A. thaliana strains with mutations in the ABA biosynthesis genes were found to be more susceptible to a number of necrotrophic pathogens, including Pythium irregulare (Adie et al., 2007).
otherwise repressed protein. In the absence of ABA, SNF-1 related protein kinase 2s (SnRK2s) are bound and inactivated by protein serine/threonine phosphatase 2Cs (PP2Cs). Upon ABA introduction, the hormone is bound by cytosolic recep-tors from the PYL family. Forming a complex with ABA alters the conformation of PYLs, allowing them to bind PP2Cs, inhibiting their active site, leading to the activation of SnRK2s through alleviation of negative regulation (Cutler et al., 2010). Consistently with the previously discussed hormones, ABA response involves mas-sive transcriptional reprogramming, mediated by transcription factors that bind ABRE (ABA-responsive elements) in the promoters of target genes (Uno et al., 2000). This is predominantly carried out by AREB/ABF transcription factors, members of the bZIP transcription factor superfamily, which are activated through phosphorylation by SnRK2s (Fujita et al., 2013).
1.2.5.4 Ethylene
Ethylene is the simplest alkene, taking on the form of gas. In plants, it con-trols a variety of growth and development processes. The most notable of these are senescence-related, with fruit ripening being the most agriculturally relevant (Bleecker and Kende, 2000). Ethylene was also found to be the primary leaf abscis-sion hormone (Jackson and Osborne, 1970). Additionally, ethylene has been found to play a role in the response to both biotic and abiotic stresses, with its pathogen response functionality involving the synthesis of cell wall strengthening compounds, induction of several PR genes (Broekaert et al., 2006), and involvement in the synthe-sis of plant defensins — small, cysteine-rich peptides with predominantly antifungal properties (Penninckx et al., 1996).
1.2.5.5 Crosstalk between the signalling of different phytohormones
The signalling events mediated by each individual phytohormone outlined above are not independent of each other, and the triggered pathways connect and interact with each other (Pieterse et al., 2009). The best documented of these interactions is the antagonism between JA and SA, with JA conferring resistance to necrotrophic pathogens but susceptibility to biotrophic pathogens, and SA signalling leading to the opposite effect. A key player in this interaction is the transcription factor WRKY70, with the expression level of this convergent downstream target determin-ing which of the two responses are godetermin-ing to be followed (Li et al., 2004). Overex-pression of WRKY70 led to the induction of SA-induced PR genes, whilst repressing the JA marker gene PDF1.2, with suppression producing the inverse effects. Expo-sure of the altered expression lines to the biotrophic Erysiphe cichoraceaurm and necrotrophic Alternaria brassiciola produces the expected results, with the consti-tutive overexpressor being resistant to the biotroph and the antisense-silenced line being resistant to the necrotroph (Li et al., 2006). A number of other regulators of the antagonism have been identified at different stages of the pathways, with similar mutant line validation. MAP kinase 4 was found to be a highly upstream regulator, as it inhibits the action of EDS1 and PAD4, which lead to SA synthesis and the stifling of the JA pathway (Brodersen et al., 2006). NPR1, the mediator of the SA signal from the cytosol to the nucleus, was found to repress JA signalling whilst still in its cytosolic state (Spoel et al., 2003). The arrival of SA-induced NPR1 monomers in the nucleus activates GRX480, leading to a complex with TGA transcription factors that induces SA-responsive gene expression whilst repressing JA-responsive genes (Bari and Jones, 2009). MYC2, one of the transcription factors activated by the presence of JA, represses SA-induced gene expression (Laurie-Berry et al., 2006). It is quite plausible that this is the point of coronatine-induced suscep-tibility, as currently it is the only known SA signalling suppression event downstream of coronatine introduction (Pieterse et al., 2009).
(Lorenzo et al., 2003). This fine-tuning of the signalling is carried out through EIL1 and EIN3, which are bound by members of the JAZ family, which subse-quently recruit HDA6 for repression through histone deacetylation. Upon exposure to both JA and ethylene, the JAZ proteins are degraded in a COI1 dependent man-ner and the two transcription factors become active, inducing downstream targets such as ORA59, PDF1.2 and ERF1 (Zhu et al., 2011). Somewhat more upstream in the pathway, ethylene has been proposed to modulate the NPR1-based antagonism point between SA and JA signalling (Leon-Reyes et al., 2009). Ethylene is also capable of enhancing the SA response, augmenting the expression of PR genes in an EIN2 dependent manner, suggesting a level of crosstalk between the cores of the two pathways (De Vos et al., 2006).
Given its natural tendency to induce heavy disease phenotypes even in cases of incompatible pathogen exposure, it should be of no surprise that the predominant functionality of ABA in the phytohormone crosstalk is the disabling of the defence response initiated by the other phytohormones. ABA has been shown to act antag-onistically to JA/ethylene signalling (Anderson et al., 2004), as well as SA-induced SAR (Yasuda et al., 2008). However, ABA plays a vital role in the response to a number of abiotic stimuli, including drought. Therefore, ABA’s ability to shut down the defence-related functionality of the other pathways likely serves as the determi-nant between the plant response to biotic or abiotic stimuli (Anderson et al., 2004). In some select cases, ABA can be involved in the fine-tuning of pathogen response by the core of the crosstalk. MYC2, which is the main transcription factor of the non-ethylene-stimulated branch of JA signalling, is known to be a positive regulator of ABA response (Abe et al., 2003), with the best known functionality of that branch of JA signalling being wound response (Anderson et al., 2004). When also factoring in ABA’s ability to confer resistance to certain necrotrophic pathogens (Adie et al., 2007), ABA’s highly specialised and not fully understood role in the biotic response crosstalk, likely to be primarily related to JA as shown by its involvement in the MYC2 branch in the wounding response, becomes apparent.
1.3
Transcription regulation and gene regulatory
net-works
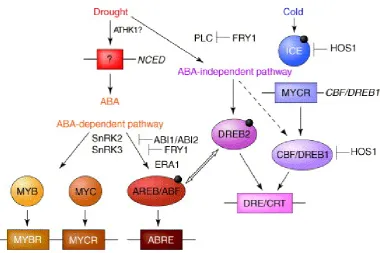
re-programming response can be very swift —A. thalianastimulated with flg22 showed differential expression of over 1000 genes in under an hour (Zipfel et al., 2004). The transcriptional overhaul is fine-tuned through a number of external stimuli, and the reprogramming itself is often carried out through a cascade of transcriptional reg-ulation. For example, the jasmonic acid induced transcriptional response depends on the presence of other phytohormones — if other signalling is absent, the MYC2-dependent wounding response will be initiated, inducing the expression of tran-scription factors ANAC019, ANAC055 and ANAC072, which in turn reprogram the transcription of a number of downstream genes (Kazan and Manners, 2013). In the presence of ethylene, the transcriptional reprogramming shifts towards a pathogen defence response, with ERF1, PDF1.2 and ORA59 being the key downstream genes induced by EIL1/EIN3 (Zhu et al., 2011). It should come as no surprise then that the transcriptional regulatory events in plant cells take on the form of complex networks (webs of interactions between transcription factors and the induction of downstream targets), with the potential of crosstalk between networks responsible for responses to different stimuli (Figure 1.2, Shinozaki et al. (2003)).
1.3.1 General overview of transcription
Transcription is the process in which RNA polymerase produces mRNA reflecting the sequence of a gene stored within the cell’s DNA. The mRNA is subsequently used as a template to synthesise the corresponding protein in a process known as translation. In conjunction, transcription and translation make up the cornerstone of what is known as the central dogma of molecular biology (Crick, 1970).
binding and stabilisation of the remaining components of the transcriptional ma-chinery, including the polymerase. The final GTFs to bind are transcription factor II E (TFIIE) and transcription factor II H (TFIIH), and once they are present tran-scription can commence upon ATP hydrolysis (Orphanides et al., 1996). TFIIH has been shown to be essential for the separation of DNA strands, creating what is known as the Open Complex, making it possible for the complex to synthesise mRNA complementary to the information stored within the DNA (Hahn, 2004).
In order to prioritise the transcription of relevant genes, the polymerase and its associated GTFs are guided to appropriate genes by transcription factors. Tran-scription factor proteins contain a number of easily discernible domains, with their functionality including the binding of specific DNA sites in the promoters of their regulated genes and being able to confer activation or repression to the transcription complex (Luscombe et al., 2000). The exact methods by which this is accomplished are quite varied, and include the summoning of chromatin modifying proteins to the transcription factor to make the DNA of the gene of interest accessible (Ikeda et al., 1999), binding of various components of the transcription machinery, most prominently TAFs, which are subunits of TFIID (Kornberg, 1999) and stimulating the rate of transcriptional initiation and elongation (Brown et al., 1998). Repres-sion strategies include the dissociation of TBPs from the TATA box (Auble et al., 1997), binding to the activation domain of positive regulators (Ma and Ptashne, 1987), competing for the same DNA site (Vincent and Struhl, 1992) or promoting histone deacetylation, making the gene’s coding region and promoter inaccessible (Grunstein, 1997). A number of these functionalities are carried out with assistance from modular protein complexes known as transcriptional co-activators (N¨a¨ar et al., 2001). An example would be the complex that leads to transcriptional repression carried out by plant transcription factors with the EAR motif – SAP18 binds to the EAR motif on a transcription factor and in turn binds HDA19, which carries out histone deacetylation (Kagale and Rozwadowski, 2011).
superfam-ily. The specificity of regulation mediated by a particular transcription factor stems from the characteristic interaction between the transcription factor’s DNA binding domain and a binding sequence, specifically recognised by that domain, present in the target gene’s promoter. An example of a characteristic binding sequence are ABRE (ABA-responsive elements) present in the promoters of genes regulated by the members of the bZIP superfamily involved in ABA signalling (Uno et al., 2000). Great advancements in the state of knowledge of transcription factor binding speci-ficity have been made recently with the aid of protein binding microarrays, with this approach allowing for the experimental identification of binding motifs specific to individual transcription factors (Franco-Zorrilla et al., 2014; Pruneda-Paz et al., 2014). The specificity of these transcription factor-binding site interactions are the foundation for regulation and make it possible for fine-tuneable regulatory networks capable of inducing large-scale downstream expression overhaul to exist.
1.3.2 Searching for a network footprint
Figure 1.3: Comparison of clustering and biclustering. In the case of clustering ap-proaches, the data is parti-tioned into groups, with all of the cluster members re-quired to exhibit uniform be-haviour across the entirety of the analysed data. This can be done on a per-gene(A)or per-condition (B) basis. Bi-clustering methods are capa-ble of identifying subsets of genes and conditions where the co-expression occurs, as shown in (C).
1.3.2.1 Clustering
the data points, then assign each data point to the cluster centre nearest to it, then re-compute the cluster centre coordinates as the mean of the coordinates of all the data points assigned to it. The assigning data points to clusters and re-computing of the centre coordinates is repeated until convergence (Jain and Dubes, 1988). The procedure is not deterministic, in contrast to hierarchical clustering, but produces more evenly sized clusters. One of the problems with K-means is the identification of the optimal number of clusters, but heuristic methods combatting this issue have been proposed (Tibshirani et al., 2001).
Clustering has a firm role in the analysis of expression data and identifying potentially co-regulated genes. Application of clustering algorithms to expression data, be it temporal or a collection of multiple static measurements, reveals genes sharing functionality clustering together. This suggests a common regulatory mech-anism driving the expression of genes with shared functionality, and implies the role of hitherto uncharacterised co-clustered genes in the same process (Eisen et al., 1998). An example of a clustering method capable of working with time series ex-pression datasets is SplineCluster (Heard et al., 2005). The algorithm starts by fitting nonlinear splines to the expression profiles of individual genes, and proceeds to cluster the resulting fits in a Bayesian hierarchical framework. SplineCluster can also analyse multiple time courses at once — an application of the algorithm to multiple time courses of expression data from Anopheles gambiae challenged with
Escherichia coli, Salmonella typhimurium, Micrococcus luteus, Listeria monocyto-genes and zymosan revealed a number of gene clusters tightly co-expressed across all the stimuli. The identified clusters were evidently functionally enriched, further indicating co-regulation (Heard et al., 2005).
1.3.2.2 Biclustering
Whilst the impact of clustering on the ability to decipher regulatory interactions in expression data is undeniable, the inherent limitations of clustering algorithm design make the methods limited in the scope of research questions they can answer. In spite of the ability to manually curate the data used as input for the clustering, it is possible that the forced partitioning of the data will result in some uninformative genes being captured in the clusters. In addition, due to the complex and specific regulatory response to varying stimuli, it is possible that a shared response will only occur across a subset of the available data. Due to these constraints, an alternate class of methods termed biclustering were developed.
and columns of this matrix, returning subsets of genes co-expressed across subsets of the available conditions as a result (Eren et al., 2013). Cheng and Church were the first to apply biclustering to expression data by proposing a deterministic greedy algorithm to mine the expression matrix (Cheng and Church, 2000). The method starts with the bicluster defined as the entirety of the matrix and progressively re-moves rows and columns from the bicluster to drop the mean square residue (MSR) below a given threshold. If multiple biclusters are to be found in the data, the dis-covered bicluster is masked with random values and the steps are repeated, making the method unfit for identifying overlapping biclusters (Cheng and Church, 2000). Another early biclustering approach is the Iterative Signature Algorithm (ISA), which creates an initial bicluster by taking a random sample of rows spanning all the columns, then proceeds to refine the row and column selection until obtaining sufficient value homogeneity (Bergmann et al., 2003). A known weakness of this method is its heavy predilection towards strong signals (Supper et al., 2007).
EDISA similarly starts by sampling a single gene from the dataset and creates an initial module around that gene by identifying the top co-expressed genes with it in one of the conditions. The module is then assumed to span across all of the condi-tions, and genes and conditions are iteratively removed until the module is either empty or classified as coherent (high Pearson Correlation Coefficient of expression profiles across all of the conditions jointly), independent (high Pearson Correlation Coefficient in each of the conditions separately, with no homogeneity of profiles re-quired between conditions) or single response (one condition evaluated for fulfilling module conditions). The analysis finishes upon sampling a user-specified number of genes (Supper et al., 2007).
1.3.3 Searching for gene regulatory network models
As mentioned when initially outlining clustering and biclustering algorithms, the re-sults of such analyses are typically the downstream footprint of a series of regulatory interactions. Given an appropriate experimental design, it is possible to reconstruct these relationships and produce what is known as a regulatory network, which can potentially explain the circumstances leading to the observed co-expression of gene groups detected through clustering or biclustering. The term ‘regulatory network’ encompasses a very broad spectrum of possible models. Regulatory networks can be directly experimentally derived or indirectly inferred from experimental quantifica-tion, and they can capture interactions between proteins or the effects of transcrip-tion factors on gene expression (Windram et al., 2014).
1.3.3.1 Undirected co-expression networks
Regulatory networks can be represented in the form of a graph, with the graph’s nodes being genes, and the edges capturing regulatory interactions between them. The graph can be undirected, with the edges capturing pairs of genes exhibiting similar expression profiles across the data used to infer the model, or directed, with the edges capturing precise hypotheses about one gene regulating another (Windram et al., 2014). Undirected regulatory networks, termed co-expression networks, are typically inferred from large collections of static expression data mined for pairs of genes that exhibit a high degree of correlation (typically evaluated with the aid of Pearson’s Correlation Coefficient or Spearman’s Correlation Coefficient) in expres-sion across all of the available data (Usadel et al., 2009).
pair by using partial correlations. As a practical example, if genes A and B are both regulated by gene C, they are likely to exhibit a high degree of similarity in their expression trends. By removing the influence of C on A and B, GGM reveals that there’s no direct correlation between the pair. This method was applied to an extensive collection of staticA. thaliana expression datasets, revealing a sparse un-derlying network structure predicting the crucial regulatory role of a few hub genes connected to a high number of other network nodes (Ma et al., 2007).
It is also possible to use the co-expression component in a broader approach, integrating data from other sources, such as protein-protein interactions, to cre-ate more complex model structures. An example is AraNet, which integrcre-ated a high number of genomic and proteomic datasets spanning multiple organisms into a massive functional network model with over a million connections of 24 distinct types, which led to the prediction of functionality for over 5000 A. thaliana genes with previously unknown roles, with subsequent experiments validating two of the three hypotheses tested (Lee et al., 2010). This modelling approach was subse-quently fine-tuned and repeated with the addition of new datasets published since the initial network release, resulting in a sparser network (approximately 100,000 fewer connections across over 3000 more gene nodes) with predictive power forA. thaliana expanded through ortholog pairs into over 25 non-model plant species (Lee et al., 2014).
1.3.3.2 Ordinary differential equation models
Whilst informative in their own way, co-expression networks do not offer much in-formation in the way of identifying explicit regulatory links between genes in the model. Alternate approaches have to be taken to produce a directed graph of a network, with the edges implying causality between the nodes. These are primarily inferred from time course data (Penfold and Wild, 2011). One of the methods that can be applied to produce such a result is modelling using a set of ordinary differen-tial equations (ODEs). ODE systems are capable of accounting for a multitude of regulatory phenomena, featuring nodes in its network representing different forms of a gene, such as its mRNA, protein form and any complexes it may form. It is possible to capture the varying regulatory interactions happening at different layers, and produce an extremely detailed model. An example of ODE application is the inference of theA. thaliana circadian clock model (Pokhilko et al., 2010). The high amount of information available on the interactions and regulation of A. thaliana
inferred from multiple time course datasets. The resulting network model accu-rately captured the regulatory interactions between its components, and allowed for functional inference in the case of perturbations. An analysis of the network identi-fied TOC1 as a repressor of LHY and CCA1, instead of an activator as previously believed, with the claim being subsequently experimentally validated with the aid of toc1 mutant plants (Pokhilko et al., 2012). However, due to the high degree of prior knowledge required to construct an accurate model, ODE systems are best left to well characterised systems such as the A. thaliana clock, with other algorithms being more suitable forde novo network inference from large scale transcriptional datasets (Penfold and Wild, 2011).
1.3.3.3 Mining large-scale transcriptomic datasets for gene regulatory networks
Whilst it is possible to perform de novo inference of a regulatory network from a time course dataset featuring many genes, this procedure is likely to require a degree of pre-processing to be effective and computationally tractable. Common practice includes the identification of differentially expressed genes, reducing the gene list to transcription factors only in order to elucidate the core of the regulatory network, or performing clustering to group together genes with similar expression profiles (Penfold and Wild, 2011). Another limitation of the modelling is the sole reliance on mRNA levels, which are easily experimentally captured via microarrays (Schulze and Downward, 2001) or RNA-Seq (Wang et al., 2009), with the ability to experimentally quantify protein levels being limited in comparison (Miranda et al., 2007).