warwick.ac.uk/lib-publications
Original citation:
Wilkins, Stephen M., Feng, Yu, Di-Matteo, Tiziana, Croft, Rupert, Stanway, Elizabeth R.,
Bunker, Andrew, Waters, Dacen and Lovell, Christopher. (2016) The photometric properties
of galaxies in the early Universe. Monthly Notices of the Royal Astronomical Society, 460 (3).
pp. 3170-3178.
Permanent WRAP URL:
http://wrap.warwick.ac.uk/80924
Copyright and reuse:
The Warwick Research Archive Portal (WRAP) makes this work by researchers of the
University of Warwick available open access under the following conditions. Copyright ©
and all moral rights to the version of the paper presented here belong to the individual
author(s) and/or other copyright owners. To the extent reasonable and practicable the
material made available in WRAP has been checked for eligibility before being made
available.
Copies of full items can be used for personal research or study, educational, or not-for profit
purposes without prior permission or charge. Provided that the authors, title and full
bibliographic details are credited, a hyperlink and/or URL is given for the original metadata
page and the content is not changed in any way.
Publisher’s statement:
This article has been accepted for publication in Monthly Notices of the Royal Astronomical
Society Journal ©: 2016 The Authors. Published by Oxford University Press on behalf of the
Royal Astronomical Society. All rights reserved.
Link to final published version :
A note on versions:
The version presented here may differ from the published version or, version of record, if
you wish to cite this item you are advised to consult the publisher’s version. Please see the
‘permanent WRAP URL’ above for details on accessing the published version and note that
access may require a subscription.
The photometric properties of galaxies in the early Universe
Stephen M. Wilkins,
1‹Yu Feng,
2,3‹Tiziana Di-Matteo,
2Rupert Croft,
2Elizabeth R. Stanway,
4Andrew Bunker,
5Dacen Waters
2and Christopher Lovell
11Astronomy Centre, Department of Physics and Astronomy, University of Sussex, Brighton, BN1 9QH, UK 2McWilliams Center for Cosmology, Carnegie Mellon University, Pittsburgh PA 15213, USA
3Berkeley Center for Cosmological Physics, University of California, Berkeley, Berkeley CA 94720, USA 4Department of Physics, University of Warwick, Gibbet Hill Road, Coventry CV4 7AL, UK
5University of Oxford, Department of Physics, Denys Wilkinson Building, Keble Road, OX1 3RH, UK
Accepted 2016 May 11. Received 2016 May 11; in original form 2016 April 13
A B S T R A C T
We use the large cosmological hydro-dynamic simulation BLUETIDESto predict the
photomet-ric properties of galaxies during the epoch of reionization (z=8–15). These properties include the rest-frame UV to near-IR broad-band spectral energy distributions, the Lyman continuum (LyC) photon production, the UV star formation rate calibration, and intrinsic UV continuum slope. In particular we focus on exploring the effect of various modelling assumptions, in-cluding the assumed choice of stellar population synthesis (SPS) model, initial mass function, and the escape fraction of LyC photons, upon these quantities. We find that these modelling assumptions can have a dramatic effect on photometric properties leading to consequences for the accurate determination of physical properties from observations. For example, at z=8 we predict that nebular emission can account for up to 50 per cent of the rest-frame
R-band luminosity, while the choice of SPS model can change the LyC production rate up to a factor of×2.
Key words: methods: numerical – galaxies: high-redshift – galaxies: photometry.
1 I N T R O D U C T I O N
Our ability to probe the very high redshift (z ∼ 7 and beyond)
Universe has been dramatically transformed in recent years. This transformation is thanks largely to the wealth of observations
ob-tained by theHubble Space Telescope. As of 2016 there are now
∼1000 candidate objects, encompassing a wide range of
luminosi-ties, identified (e.g. Bouwens et al.2010,2011,2014a,b,2015a,b;
Oesch et al. 2010, 2013, 2014, 2015, 2016; Bunker et al.2010;
Wilkins et al. 2010, 2011a; Finkelstein et al.2010, 2012,2015;
Lorenzoni et al.2011,2013; McLure et al.2011,2013; Ellis et al.
2013; Laporte et al.2014,2015,2016; Schmidt et al.2014; McLeod
et al.2015; McLeod, McLure & Dunlop2016; Atek et al.2015a,
Atek et al.2015b) with the first small samples now identified at
z∼10 and beyond.
With the upcoming launch of theJames Webb Space Telescope
(JWST, see Gardner et al.2006) the study of the distant Universe
will again be revolutionised.JWSTwill identify large numbers of
galaxies at z∼ 8–10 with the first detections of galaxies above
z >12 likely [see Wilkins et al. (in preparation)]. However, the
power ofJWSTis its ability to measure the rest-frame UV to optical
spectral energy distributions (SEDs) of high-redshift galaxies. This
E-mail:s.wilkins@sussex.ac.uk(SMW);yfeng1@berkeley.edu(YF)
wealth of information will facilitate the accurate determination of a range of physical properties, including: redshifts, star formation his-tories (and stellar masses), instantaneous star formation rates, dust attenuation, morphologies, gas phase metallicities, and kinematics (and dynamical masses).
The observed SEDs of galaxies are made up of intrinsic contri-butions from stars and active galactic nuclei (AGN) modified by dust and gas in the intervening interstellar medium. The intrinsic stellar SED of a galaxy depends on the joint distribution of stel-lar masses, ages, and metallicities combined with stelstel-lar evolution and atmosphere models which link these properties to photometric quantities. More commonly, the joint distribution of stellar masses, ages, and metallicities is expressed in terms of the joint star for-mation and metal enrichment history and an assumed initial mass function (IMF). These are linked to intrinsic SEDs through a stellar population synthesis (SPS) model which includes stellar evolution and atmosphere models and typically assumes an IMF.
Disentangling the various desired physical properties from pho-tometric observations often involves making a range simplifying assumptions that leaves any inferred property sensitive to these assumptions. Conversely, when attempting to predict photometric properties from galaxy formation simulations similar assumptions must be made, again leaving any predictions sensitive to various choices. For example, the choice of assumed IMF can affect obser-vationally inferred stellar masses and star formation rates by up to
2016 The Authors
at University of Warwick on August 10, 2016
http://mnras.oxfordjournals.org/
Photometric properties of galaxies
3171
≈0.2 dex (e.g. Wilkins, Trentham & Hopkins2008a; Wilkins et al.
2008b). At very high redshift (z∼7 and above) the inclusion of nebular emission in SED templates can affect stellar mass estimates by up to 0.4 dex where strong lines intersect the relevant broad-band
filters (e.g. Schaerer & de Barros2009; Stark et al.2013; Wilkins
et al.2013b). The choice of SPS model has also been demonstrated
to affect physical properties inferred from observations and photo-metric properties predicted by galaxy formation simulations (e.g.
Gonzalez-Perez et al.2014; Wilkins et al.2016b). For example,
Gonzalez-Perez et al. (2014) found that the bright end of the
near-IR luminosity function is particularly sensitive to the choice of model at high-redshift.
In this study we produce predictions for various photometric properties [including the UV to near-IR SEDs, luminosity func-tions, UV star formation rate calibrafunc-tions, intrinsic UV continuum slopes, and Lyman continuum (LyC) photon production
efficien-cies] of very high redshift (z >8) galaxies using the BLUETIDES
cos-mological hydro-dynamic simulation. In making these predictions we investigate the implications of a range of different modelling assumptions, including the choice of SPS model, IMF, and the LyC escape fraction.
This article is organized as follows: in Section 2 we describe the simulation and the construction of galaxy SEDs. Specifically, in Section 2.1 we describe the properties of galaxies within the sim-ulation before describing the modelling of the stellar popsim-ulations (Section 2.2) and the nebular reprocessing (Section 2.3). We then present predictions for various photometric properties, including the SEDs in Section 3, the UV star formation rate calibrations (Sec-tion 4), the intrinsic UV continuum slope (Sec(Sec-tion 5), and LyC pho-ton production (Section 6). In Section 7 we present our conclusions.
2 T H E B L U E T I D E S S I M U L AT I O N
The BLUETIDESsimulation was carried out using the Smoothed
Parti-cle Hydrodynamics codeMP-GADGETwith 2×70403particles using
the Blue Waters system at the National Centre for
Supercomput-ing Applications. The simulation evolved a (400/h)3cMpc3cube to
z=8 and is the largest (in terms of memory usage) cosmological
hydrodynamic simulations carried out. For a full description of the
simulation physics see Feng et al. (2015,2016).
2.1 Galaxies in BLUETIDES
Galaxies were selected using a friends-of-friends algorithm at a
range of redshifts. Byz=8 there are almost 160000 objects with
stellar masses greater than 108M
1in the simulation volume and
in this work we limit our analysis to those galaxies. The galaxy
stellar mass function predicted by the simulation is shown in Fig.1
and closely matches the observational constraints available atz≈
8 (Song et al.2015). BLUETIDEScan also reproduce the observed
UV luminosity function atz ≈ 8 and above [see Wilkins et al.
(in preparation)] when combined with a physically motivated dust model.
2.2 Stellar population modelling
To determine the photometric properties of galaxies we couple the BLUETIDES simulation with five SPS models; these models are
1The mass of each star particle is≈8.4×10⁵M
. Imposing a limit of
>108M
[image:3.595.312.546.55.252.2]means that each galaxy is resolved with at least 118 star particles.
Figure 1. The Galaxy stellar mass function predicted by the simulation for
z∈{8, 10, 12, 14}. The right-hand axis shows the number of galaxies in each BLUETIDESlog10M=0.2 mass bin. The points and grey line show observations from Song et al. (2015) atz≈8. The inset panel shows the number of objects with log10(M∗/M)>8 in the simulation volume as a function of redshiftz=15→8.
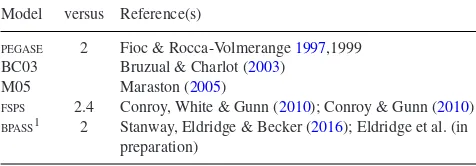
Table 1. The stellar population synthesis (SPS) models considered in this work.1For the
BPASSmodel we consider only the case including the effects of binary interaction and evolution.
Model versus Reference(s)
PEGASE 2 Fioc & Rocca-Volmerange1997,1999 BC03 Bruzual & Charlot (2003)
M05 Maraston (2005)
FSPS 2.4 Conroy, White & Gunn (2010); Conroy & Gunn (2010)
BPASS1 2 Stanway, Eldridge & Becker (2016); Eldridge et al. (in preparation)
listed in Table1. Throughout most of this work we assume a Salpeter
(1955) IMF at 0.1–100 M. However, in Section 3.1.3 we consider
a range of IMFs.
The integratedpure stellarSED of each galaxy,L1
ν,2is
deter-mined by assigning the SED of a simple stellar population (SSP) to every star particle taking into account their ages and metallicities.
2.3 Nebular continuum and line emission modelling
Gas in HIIregions surrounding stellar populations reprocesses
ion-izing LyC photons into nebular continuum and line emission. The resulting nebular emission depends on the characteristics (spectral shape and flux) of the LyC photons and the properties of the sur-rounding medium. These properties include the density, chemical composition and the covering fraction (or LyC photon escape
frac-tion,fesc, LyC).
Direct constraints on the LyC escape fraction can be obtained by combining measurements of both the number of escaping pho-tons (for example, from imaging of the rest-frame LyC) and repro-cessed photons (from the strength of the nebular emission lines).
2The superscript 1 refers to the fact that we assume the escape fraction of
LyC photonsfesc, LyCis effectively unity.
MNRAS460,3170–3178 (2016)
at University of Warwick on August 10, 2016
http://mnras.oxfordjournals.org/
[image:3.595.309.547.371.454.2]Due to absorption by the intervening inter-galactic medium mea-suring the number of escaping photons becomes incredibly difficult at high-redshift. However, the escape fraction can alternatively be constrained by assuming a LyC photon production rate. While the rest-frame optical emission lines are inaccesible to current spec-trographs it is possible to estimate the emission line fluxes from
Spitzer/IRAC colours (e.g. Stark et al.2013, atz∼4 and Smit et al.
2014,2015, atz∼7). These analyses suggest the presence of strong
nebular emission, with the inferred rest-frame equivalent widths in-creasing to higher redshift. While the expected production rate is
uncertain (see Section 6 and Wilkins et al.2016a,b) the presence
of such strong emission suggests the escape fraction must be rela-tively low. In addition, if star-forming galaxies were responsible for reionization the escape fraction must also be non-zero, with a value
fesc, LyC ≈ 0.1–0.2, depending on the ionizing photon production
rate, preferred by recent observations (e.g. Bouwens et al.2015c).
To model nebular reprocessing we use theCLOUDY
photoioniza-tion code (Ferland et al.2013), modelling each star particle
inde-pendently. The hydrogen density is chosen to be 100 cm−3and the
chemical composition of the gas is set to the metallicity of the star particle scaled by solar abundances.
In this work we assume a limiting case in which the covering fraction is unity resulting in a LyC photon escape fraction that
is effectively zero (fLyC = 0). To distinguish the combined (i.e.
including nebular reprocessing) SED from the pure-stellar SED we
utilize the notationL0
ν, where the subscript 0 is chosen to reflect the
fact the LyC escape fractionfesc, LyCis effectively zero.
3 G A L A X Y S P E C T R A L E N E R G Y D I S T R I B U T I O N S
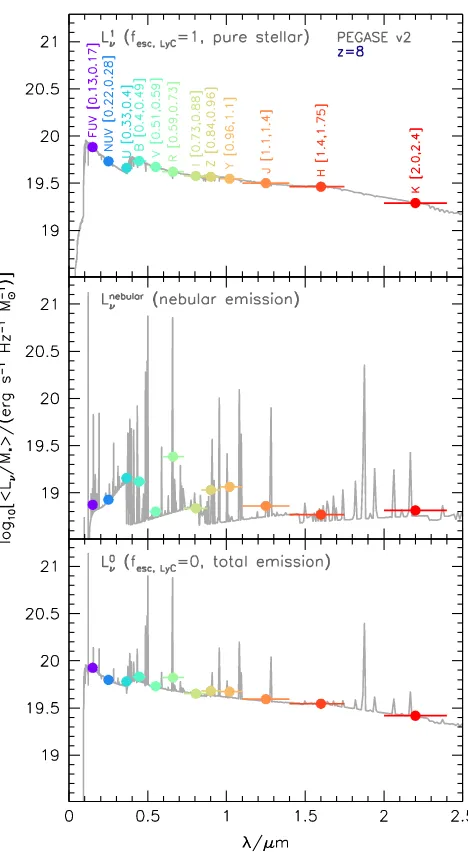
We begin by calculating the intrinsic SED of each galaxy in the
simulation fromz=15 toz=8. Fig.2shows the predicted average
(luminosity weighted mean) pure stellarL1
nu, nebular, and total (L0ν,
i.e. assumingfesc, LyC=0) SED of galaxies with 108Matz=8.
These SEDs are constructed using thePEGASESPS model assuming
a Salpeter IMF.
To clearly interpret the effect of modelling assumptions and the variation of physical properties on the SED we use 12 simple UV– near-IR rest-frame broad-band filters. These are defined as a simple
top-hat filter such that the filter-transmissionTλis unity in the
inter-val [λ1,λ2] and zero elsewhere. These 12 broad-band luminosities
are also shown in Fig.2along with the definition ofλ1,λ2. These 12
filters are employed in subsequent analysis throughout this work.
3.1 Effect of modelling assumptions
3.1.1 Contribution of nebular emission
The galaxies predicted by BLUETIDESall have ongoing star
forma-tion activity and thus host young, massive, and hot stars producing large number of LyC photons. If these photons are reprocessed by surrounding gas this can result in strong nebular continuum and
line emission. This is demonstrated in Fig.3where we show the
fractional contribution of nebular emission3to thetotal(assuming
fesc, LyC =0) SED atz=8 assuming thePEGASE.2 model. Where strong lines are present in the SED the fractional contribution of neb-ular emission approaches unity. This figure also shows the effect of nebular on the broad-band luminosities highlighting that nebular
3Atλ >0.0912µm the nebular SED is almost identical toL0
[image:4.595.308.542.51.477.2]ν−L1ν.
Figure 2. The average (luminosity-weighted mean) specific spectral en-ergy distribution of galaxies (atz=8 with>108M
) in BLUETIDES assum-ing thePEGASESPS model. The top panel shows the pure stellar emission (i.e.fesc, LyC = 1). The middle panel shows the nebular continuum and line emission (assumingfesc,LyC=0) while the bottom panel shows the total emission (including both nebular and stellar components) assuming
fesc,LyC=0. The coloured markers denote the broad-band luminosities ex-pected assuming a simple top-hat filter over the wavelength interval given next to each point and denoted by the horizontal error bar.
emission contributes>10 per cent of the combined flux in all the
bands considered. The fractional contribution of nebular emission
to the broad-band luminosities is maximized in the rest-frameR
-band, where approximately 40 per cent of the total luminosity arises
from nebular emission, predominantly due to the strong Hα(λ≈
656.3 nm) emission.
The impact of nebular emission increases to higher redshift (dis-cussed further in Section 3.2.1) and is sensitive to the choice of SPS
model (Section 3.1.2). Atz=13 the nebular emission accounts
for>50 per cent of the emission in rest-frameR-band assuming the
PEGASESPS model.
at University of Warwick on August 10, 2016
http://mnras.oxfordjournals.org/
Photometric properties of galaxies
3173
Figure 3. The fractional contribution of nebular emission (assuming
fesc =0) to the total emission atz=8 assuming thePEGASESPS model for a spectral resolution ofR≈6000 (at 0.5µm). The points show the frac-tional contribution to the same broad-band luminosities defined in Fig.2.
3.1.2 Sensitivity to choice of SPS model
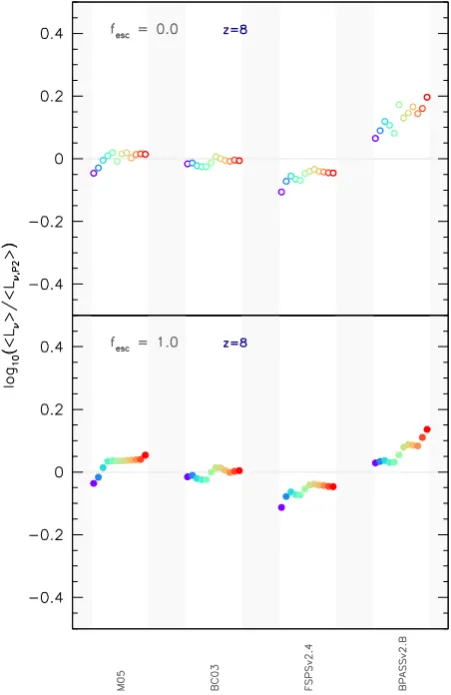
The SEDs calculated by each SPS model vary due to the different
choices of evolution and atmosphere models (see Conroy2013, for a
recent overview of SPS modelling). To investigate the implications of this variation we compare the average luminosities in the rest-frame broad-band filters predicted assuming each model to those
predicted using thePEGASEmodel. This is shown in Fig.4for both
the pure stellar case and including gas reprocessing.
The average luminosities found assuming thePEGASE, BC03 and
M05 models are very similar (withlog10Lν < 0.05) reflecting
similarities in the evolution and atmosphere models utilized by each code. While these models differ in their treatment of the TP-AGB
stage (see Maraston et al.2006; Kriek et al.2010) this is not
particu-larly important at very high redshift where the SED is dominated by
younger stars. In the optical and near-IR theFSPSmodel is also
sim-ilar toPEGASE, BC03 and M05 though it predicts around 25 per cent
less emission in the far-UV. TheBPASSmodel, which incorporates
the effects of interacting binaries, produces similar UV and optical fluxes as the other models but produces significantly more near-IR and LyC (see Section 6) emission. These differences between mod-els will result in systematic effects in the physical properties (e.g. star formation rates – Section 4, stellar masses, etc.) measured from observational data sets.
SPS models can also produce different amounts of LyC photons (this is expanded in see Section 6) resulting in a variation in the impact of nebular line and continuum emission. This can be seen
clearly in Fig.5where we show the ratio of the combined to the pure
stellar emission. The impact of nebular emission is largely similar
for most models with the exception of theBPASSbinary model. In this
model the impact of nebular emission is around twice as strong as the other models, reflecting the enhancement caused by the inclusion
of binary interactions. The rest-frameR-band luminosity predicted
using theBPASSmodel is around 25 per cent larger than assuming
[image:5.595.316.542.58.406.2]other SPS models.
Figure 4. The effect of the choice of SPS model on the rest-frame UV–near-IR broad-band pure-stellar (i.e.fesc=1, bottom-panel) and gas reprocessed (assumingfesc=0, top-panel) luminosities. Differences are expressed rel-ative to the predictions assuming thePEGASEmodel. Note: the points are no longer distributed according to their pivot wavelength but are uniformly spaced for clarity with wavelength increasing from left to right.
Figure 5. The impact of adding nebular continuum and line emission (as-sumingfesc=0) on the predicted broad-band luminosities atz=8 for each SPS model. The figure shows the ratio of thetotalemission to the pure stellar emission in each broad-band. TheR-band (coloured green, and always the highest point for each model) encompasses the strong Hαline.
MNRAS460,3170–3178 (2016)
at University of Warwick on August 10, 2016
http://mnras.oxfordjournals.org/
[image:5.595.315.543.480.673.2]Table 2. The various initial mass functions (IMFs) considered in this work.
[image:6.595.43.283.71.227.2] [image:6.595.308.547.452.655.2]IMF label definition
[2.7, 1.3] ddmn ∝m−α; α=
2.7; 1≤m/M ≤100 1.3; 0.1≤m/M<1
[2.35, 1.3] ddmn ∝m−α; α=
2.35; 1≤m/M ≤100 1.3; 0.1≤m/M<1
[2.0, 1.3] dn
dm∝m−α; α=
2.0; 1≤m/M ≤100 1.3; 0.1≤m/M<1
Kroupa (2001)
dn
dm∝m−α; α= ⎧ ⎨ ⎩
2.3; 0.5≤m/M ≤100 1.3; 0.08≤m/M<0.5 0.3; 0.01≤m/M<0.08
Chabrier (2003)
dn dm∝
m−2.3; 1≤m/M
≤100
exp−(logm−log 0.08)2 2×(0.69)2
; 0.1≤m/M<1.0
3.1.3 Initial mass function
The IMF describes the mass distribution of star at their formation and as such for a fixed mass of stars the photometric properties
depend on the assumed IMF (e.g. Stanway et al.2016). Conversely,
inferring physical properties from the observed SED requires the
assumption of an IMF (see for example Wilkins et al.2008a,b).
To explore the effect of the IMF we consider a number of literature
and model IMFs described in Table2using thePEGASESPS model.
The effect on the broad-band luminosities, relative to assuming a Salpeter IMF, of reprocessing the simulation assuming these IMFs
is shown in Fig.6.
Adopting an IMF with a different low-mass (<1 M) behaviour
but similar high-mass slope (e.g. the [2.35, 1.3], Kroupa2001, and
Chabrier2003IMFs when compared to the Salpeter IMF) results in
a systematic shift of the predicted luminosities. However, because low-mass stars make a relatively small contribution to the total SED (in the case of our predicted galaxies) the shift is fairly uniform with
wavelength.4However, changing the high-mass slope (e.g. the [2.7,
1.3] and [2.0, 1.3] IMFs) or increasing the maximum stellar mass
(not considered in this work, but see Stanway et al. 2016) can
also affect the luminosities as a function of wavelength. For
exam-ple, assuming an IMF with a flatter high-mass slope (i.e. <2.35)
increases the relative proportion of high-mass stars (compared to intermediate-mass stars), resulting in a preferential increase in the UV luminosity over the optical and near-IR. A flatter IMF will also increase the number of LyC photons which will enhance the impact of nebular emission. This is particularly notable in the rest-frame
R-band.
3.2 Sensitivity to physical properties
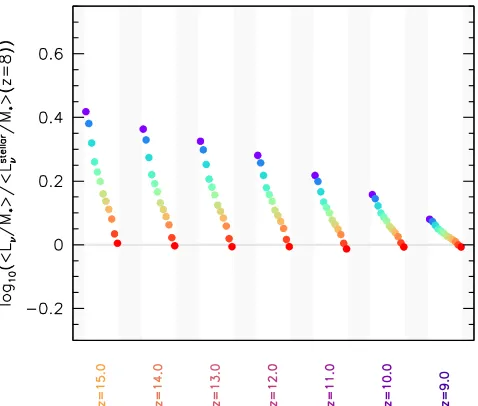
3.2.1 Redshift evolution
As galaxies evolve through time their average age (and to a lesser ex-tent metallicity) increases driving an evolution in the average SED.
This can be seen in Fig.7where we show the redshift evolution of
the specific (i.e. per unitinitialstellar mass) rest-frame broad-band
luminosities assuming thePEGASESPS model. While the rest-frame
UV luminosity per unitinitialstellar mass decreases by≈0.4 dex
4There is a slight wavelength dependence when comparing the Kroupa
(2001) and Chabrier (2003) IMFs with the Salpeter (1955) IMF because they have slightly flatter high-mass slopes than Salpeter.
Figure 6. The effect of changing the initial mass function (IMF) on the predicted pure-stellar (bottom-panel) and gas reprocessed (top-panel) broad-band luminosities atz=8 relative to assuming a Salpeter (1955) IMF.
Figure 7. The redshift evolution of the specific broad-band luminosities assuming thePEGASESPS model. The figure shows the averagespecific
luminosity divided by thespecificluminosity atz=8.
at University of Warwick on August 10, 2016
http://mnras.oxfordjournals.org/
Photometric properties of galaxies
3175
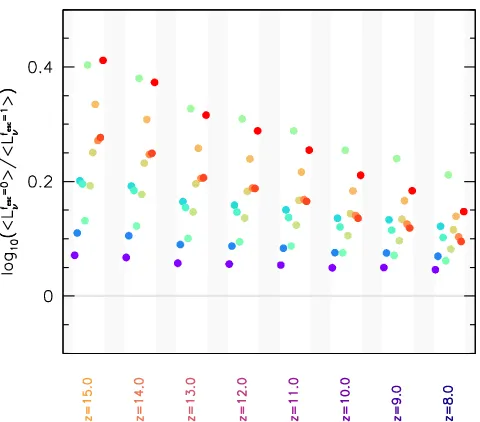
Figure 8. The impact of adding nebular continuum and line emission (as-sumingfesc=0) on the predicted broad-band luminosities as a function of redshift assuming thePEGASEmodel. The figure shows the ratio of the
totalemission to the pure stellar emission in each broad-band. TheR-band (coloured green) encompasses the strong Hαline.
(≈1 mag) fromz=15→8 the rest-frameK-band remains virtually
constant.
The evolving LyC photon production rate also drives an evolution
in the strength of nebular line and continuum emission. In Fig.8we
show the evolving impact of nebular line and continuum emission
on the broad-band luminosities. The impact on the rest-frameR
-band decreases from≈0.4 dex (≈1 mag) atz=15 to≈0.2 dex at
z=8.
3.2.2 Stellar mass
There is a strong variation of the average stellar metallicity with
stellar mass predicted by the simulation. As seen in Fig.9 this
drives a dependence of SED on the stellar mass, such that the most massive galaxies are intrinsically redder. Once nebular emission is included (which reddens the SED) the strength of this trend reduces. This is a result of the fact that nebular emission preferentially affects the youngest and lowest metallicity stellar populations which are also the bluest.
4 U V S TA R F O R M AT I O N R AT E C A L I B R AT I O N
The rest-frame UV continuum luminosity is a widely utilized di-agnostic of the instantaneous star formation activity in galaxies
(e.g. Kennicutt1998; Kennicutt & Evans2012). The rest-rame UV
is particularly valuable at high-redshift where other diagnostics (e.g. the hydrogen recombination lines, far-IR emission, and ra-dio emission) are currently inaccesible. The star formation rate
(SFR/Myr−1) and the intrinsic FUV luminosityνL
ν, fuv/(erg s−1)
are related through the calibrationCfuv(Kennicutt & Evans2012),
log10(SFR/Myr−1)=log
10(νLν,fuv/erg s−1)−log10Cfuv. (1)
The value of the calibrationCfuv is sensitive to the recent star
formation and metal enrichment history, the IMF, the choice of
SPS model, and the LyC escape fraction (see Wilkins et al.2008b,
[image:7.595.310.550.58.478.2]2012b, for a wider discussion). The predicted (average) calibration
Figure 9. Comparison of the average rest-frame specific broad-band lumi-nosities in different mass bins. In each case the lumilumi-nosities are normalized by the average specific luminosity of all galaxies withM>108M
to highlight the variation across mass bins. The numberNis the total number of galaxies contributing to the bin.
(for theFUV0.13−0.17µmband) atz∈{8, 9, 10, 11, 12, 13,
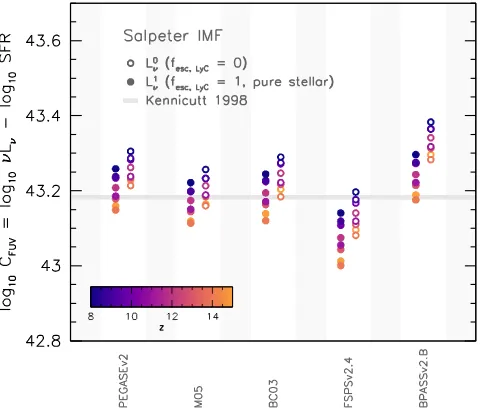
14}predicted by BLUETIDESare shown in Fig.10for the various
modelling assumptions previously described. Atz=8Cfuvcovers
a range 43.0−43.4 depending on the choice of SPS model and
fesc, LyC. At a given redshift the choice of SPS model can result in a systematic shift of approximately 0.15 dex (reflecting the difference in the predicted UV luminosities). A lower LyC escape fraction leads to slightly higher UV luminosities (see Section 3.1.1) resulting in
a larger value of the calibration (0.05−0.1 dex depending on the
choice of SPS model).
5 I N T R I N S I C U LT R AV I O L E T C O N T I N U U M S L O P E
Robust observations of individual galaxies atz≈8 and above are
typically limited to the rest-frame UV and optical. Although, star
MNRAS460,3170–3178 (2016)
at University of Warwick on August 10, 2016
http://mnras.oxfordjournals.org/
Figure 10. The predicted UV continuum – star formation rate calibration for galaxies atz∈{8, 9, 10, 11, 12, 13, 14}in BLUETIDES. The solid symbols assume a pure stellar continuum (i.e.fesc =1) while the open symbols include nebular reprocessing (withfesc=0). The horizontal line denotes the commonly utilized Kennicutt (1998) calibration.
formation rates can be estimated from the intrinsic UV the UV is susceptible to strong attenuation by dust. As such observed UV luminosities only provide lower limits on the total star formation activity.
While the rest-frame far-IR (which probes dust reprocessed UV and optical emission) at high-redshift is accessible, at least for moderately dusty bright galaxies, to the Atacama Large Millimetre Array, few sources have yet to be observed.
The observed rest-frame UV continuum slopeβ (defined such
thatfν∝λβ+2) provides a potential constraint on dust attenuation
and thus total star formation activity (e.g. Meurer, Heckman &
Calzetti1999; Casey et al.2014). The UV continuum slope is
cur-rently observationally accesible toz≈10 (Wilkins et al.2016a) and
potentially beyond withJWSTand has been the focus of significant
study in recent years (e.g. Bouwens et al. 2009, 2012,2014a,b;
Finkelstein et al.2010,2012; Wilkins et al.2011b,2012a,2013a;
Dunlop et al.2013).
The relationship between the attenuationAλ and the observed
slopeβobscan be written as follows:
Aλ= dAλ
dβ (βobs−βint), (2)
where dAλ/dβis sensitive to the choice of attenuation curve, and
βintis the intrinsic UV slope. The intrinsic slopeβintis sensitive to
the photometric properties of the stellar population as well as the presence of nebular continuum and line emission (see Wilkins et al. 2012a, Wilkins et al. 2013d).
We obtain the intrinsic UV continuum slopes of galaxies in
BLUETIDESusing a methodology similar to that used by
observa-tions at high-redshift by simply using the broad-bandFUV−NUV
colour,
β=1.8×(mfuv−mnuv)−2.0, (3)
the factor of 1.8 comes from the choice of filters. Filters spaced more closely together will typically have a larger factor, affecting the accuracy with which the slope can be measured (see Wilkins
[image:8.595.44.285.57.261.2]et al.2016a).
Figure 11. The predicted intrinsic UV continuum slope of galaxies atz∈
{8, 9, 10, 11, 12, 13, 14, 15}in BLUETIDES. The solid symbols assume a pure stellar continuum (i.e.fesc=1) while the open symbols include nebular reprocessing (withfesc=0).
The intrinsic slopes predicted by BLUETIDES atz=8–15 are
shown in Fig.11. Irrespective of the choice of SPS model or LyC
escape fraction the intrinsic slopes predicted by BLUETIDESare all
bluer than that proposed by Meurer et al. (1999). The application of
the Meurer et al. (1999) intrinsic slope would then result in the
un-derestimation of the dust attenuation at very high redshift (assuming the same attenuation curve). Including nebular reprocessing reddens
the slope by≈0.1 for all models except theBPASSbinary scenario
for which the increase is≈0.2. The intrinsic slope also varies by
σ≈0.05 depending on the choice of SPS model. The slope evolves
with redshift, becoming≈0.1 redder asz=12→8. Between
dif-ferent choices of the SPS model and LyC escape fraction the
intrin-sic slope atz=8 varies between approximately−2.7 and−2.45
translating to a systematic uncertainty on the dust attenuation of
≈0.5 mag assuming a Calzetti et al. (2000) attenuation curve.
6 LY M A N C O N T I N U U M P H OT O N P R O D U C T I O N
LyC photons produced by stars that ultimately escape galaxies are thought to be the predominant contributor to the cosmic
reioniza-tion of hydrogen (e.g. Wilkins et al.2011a; Robertson et al.2015;
Bouwens et al.2015c, though see Madau & Haardt2015; Feng et al.
2016, for a discussion of the contribution of AGN).
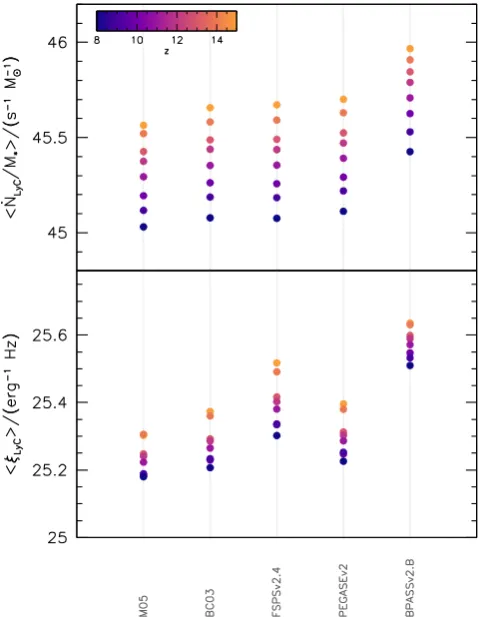
Fig.12shows the average specific (number of LyC photons per
unit initial stellar mass) LyC photon production rate at redshifts
z=15→8 for the range of SPS models. The specific rate drops
by≈0.5 dex fromz=15→8 reflecting the increasing ages and
metallicities of the stellar populations at lower redshift. The choice of SPS model can have a significant effect: for example, assuming theBPASSbinary evolution scenario results in approximately twice as many ionizing photons being produced compared to the M05,
BC03,FSPS, andPEGASEmodels. The high LyC production in the
BPASSmodel arises due to the factBPASSpredicts more massive stars at late ages due to the modelled effects of mass transfer between bi-nary stars causing rejuvenation, extending lifetimes and resulting in
at University of Warwick on August 10, 2016
http://mnras.oxfordjournals.org/
Photometric properties of galaxies
3177
Figure 12. The specific (i.e. per unit stellar mass) LyC photon production rate (top-panel) and production efficiencyξLyC(bottom-panel) for galaxies atz∈{8, 9, 10, 11, 12, 13, 14, 15}in BLUETIDES.
rotational mixing which other codes largely neglect (see discussion
in Stanway, Eldridge & Becker2016; Stanway et al.2014).
Because direct observations of the LyC photon production
effi-ciency are difficult to obtain (though see Stark et al.2015; Bouwens
et al.2015d, for recent constraints at high-redshift) the LyC photon
production rate ˙NLyCis often inferred from the intrinsic rest-frame
UV continuum luminosityLν, fuvassuming a production efficiency
ξLyC, ˙
NLyC=ξLyCLν,fuv. (4)
The production efficiency predicted from BLUETIDES is also
shown in Fig. 12. As discussed in more depth in Wilkins et al.
(2016b) the production efficiency is also sensitive to the choice of SPS model with models predicting higher values generally being
favoured by recent observations (e.g. Stark et al.2015; Bouwens
et al.2015d). The production efficiency will also be affected by
the contribution of nebular (mostly continuum) emission, however
this effect is relatively small, being at most≈10 per cent when the
escape fraction is zero.
7 C O N C L U S I O N S
In this study we have used the large (400/h)3cMpc3cosmological
hydrodynamical simulation BLUETIDESto investigate the predicted
photometric properties of galaxies atz=8–15. In predicting these
properties we have investigated the effect of the choice of SPS model, IMF, and LyC escape fraction. Our specific conclusions are as follows:
(i) Atz=8 nebular continuum and line emission can contribute
up to 50 per cent of the rest-frame R-band luminosity if the LyC
escape fraction is low. This increases to higher redshift. The impact of nebular emission is minimized in the UV where it accounts for
at most≈10 per cent of the broad-band emission (atz= 8). The
impact of nebular emission is not strongly sensitive to the choice
of SPS model, except where theBPASSbinary evolution scenario is
utilized.
(ii) Galaxies are generally bluer at higher redshift reflecting their younger ages and lower metallicities. Massive galaxies are generally redder, reflecting higher average stellar metallicities and (slightly) older ages.
(iii) The calibration relating the star formation activity to the UV
luminosity increases by≈24 per cent asz=8→15. It is also
sen-sitive to nebular emission, decreasing by≈15 per cent. The choice
of SPS model can also increase the calibration by≈35 per cent.
(iv) The intrinsic UV continuum slope evolves with redshift,
reddening by≈0.15 fromz=15→8. Nebular continuum emission
can also redden the slope by≈0.1–0.15 with the effect strongest at
the highest redshift. The choice of SPS model can also affect the
slope by up to≈0.2. The systematic variation in the intrinsic slope
can result in significant differences in the attenuation inferred from the observed UV continuum slope.
AC K N OW L E D G E M E N T S
We would like to thank the anonymous referee for thoroughly read-ing the manuscript and providread-ing useful feedback. We acknowledge funding from NSF ACI-1036211, NSF 1517593, NSF
AST-1009781, and the BlueWaters PAID program. The BLUETIDES
simu-lation was run on facilities on BlueWaters at the National Center for Supercomputing Applications. SMW acknowledges support from the UK Science and Technology Facilities Council (STFC) con-solidated grant ST/L000652/1. ERS acknowledges support from the UK Science and Technology Facilities Council (STFC) con-solidated grant ST/L000733/1. CL acknowledges support from a UK Science and Technology Facilities Council (STFC) PhD stu-dentship.
R E F E R E N C E S
Atek H. et al., 2015, ApJ, 814, 69 Bouwens R. J. et al., 2009, ApJ, 705, 936 Bouwens R. J. et al., 2010, ApJ, 709, L133 Bouwens R. J. et al., 2011, ApJ, 737, 90 Bouwens R. J. et al., 2012, ApJ, 754, 83 Bouwens R. J. et al., 2014a, ApJ, 795, 126 Bouwens R. J. et al., 2014b, ApJ, 793, 115 Bouwens R. J. et al., 2015a, ApJ, 803, 34
Bouwens R. J. et al., 2015b, preprint (arXiv:1506.01035)
Bouwens R. J., Illingworth G. D., Oesch P. A., Caruana J., Holwerda B., Smit R., Wilkins S., 2015c, ApJ, 811, 140
Bouwens R. J., Smit R., Labbe I., Franx M., Caruana J., Oesch P., Stefanon M., Rasappu N., 2015d, preprint (arXiv:1511.08504)
Bruzual G., Charlot S., 2003, MNRAS, 344, 1000 Bunker A. J. et al., 2010, MNRAS, 409, 855
Calzetti D., Armus L., Bohlin R. C., Kinney A. L., Koornneef J., Storchi-Bergmann T., 2000, ApJ, 533, 682
Casey C. M. et al., 2014, ApJ, 796, 95 Chabrier G., 2003, PASP, 115, 763 Conroy C., 2013, ARA&A, 51, 393 Conroy C., Gunn J. E., 2010, ApJ, 712, 833 Conroy C., White M., Gunn J. E., 2010, ApJ, 708, 58 Dunlop J. S. et al., 2013, MNRAS, 432, 3520
MNRAS460,3170–3178 (2016)
at University of Warwick on August 10, 2016
http://mnras.oxfordjournals.org/
Ellis R. S. et al., 2013, ApJ, 763, L7
Feng Y., Di Matteo T., Croft R., Tenneti A., Bird S., Battaglia N., Wilkins S., 2015, ApJ, 808, L17
Feng Y., Di-Matteo T., Croft R. A., Bird S., Battaglia N., Wilkins S., 2016, MNRAS, 455, 2778
Ferland G. J. et al., 2013, Rev. Mex. Astron. Astrofis., 49, 137
Finkelstein S. L., Papovich C., Giavalisco M., Reddy N. A., Ferguson H. C., Koekemoer A. A., Dickinson M., 2010, ApJ, 719, 1250
Finkelstein S. L. et al., 2012, ApJ, 756, 164 Finkelstein S. L. et al., 2015, ApJ, 810, 71
Fioc M., Rocca-Volmerange B., 1997, A&A, 326, 950 Gardner J. P. et al., 2006, Space Sci. Rev., 123, 485
Gonzalez-Perez V., Lacey C. G., Baugh C. M., Lagos C. D. P., Helly J., Campbell D. J. R., Mitchell P. D., 2014, MNRAS, 439, 264
Kennicutt R. C., Jr, 1998, ARA&A, 36, 189 Kennicutt R. C., Evans N. J., 2012, ARA&A, 50, 531 Kriek M. et al., 2010, ApJ, 722, L64
Kroupa P., 2001, MNRAS, 322, 231 Laporte N. et al., 2014, A&A, 562, L8 Laporte N. et al., 2015, A&A, 575, A92 Laporte N. et al., 2016, ApJ, 820, 98
Lorenzoni S., Bunker A. J., Wilkins S. M., Stanway E. R., Jarvis M. J., Caruana J., 2011, MNRAS, 414, 1455
Lorenzoni S., Bunker A. J., Wilkins S. M., Caruana J., Stanway E. R., Jarvis M. J., 2013, MNRAS, 429, 150
Madau P., Haardt F., 2015, ApJ, 813, L8 Maraston C., 2005, MNRAS, 362, 799
Maraston C., Daddi E., Renzini A., Cimatti A., Dickinson M., Papovich C., Pasquali A., Pirzkal N., 2006, ApJ, 652, 85
McLeod D. J., McLure R. J., Dunlop J. S., Robertson B. E., Ellis R. S., Targett T. T., 2015, MNRAS, 450, 3032
McLeod D. J., McLure R. J., Dunlop J. S., 2016, preprint (arXiv:1602.05199) McLure R. J. et al., 2011, MNRAS, 418, 2074
McLure R. J. et al., 2013, MNRAS, 432, 2696
Meurer G. R., Heckman T. M., Calzetti D., 1999, ApJ, 521, 64 Oesch P. A. et al., 2010, ApJ, 709, L16
Oesch P. A. et al., 2013, ApJ, 773, 75 Oesch P. A. et al., 2014, ApJ, 786, 108
Oesch P. A., Bouwens R. J., Illingworth G. D., Franx M., Ammons S. M., van Dokkum P. G., Trenti M., Labb´e I.´e., 2015, ApJ, 808, 104
Oesch P. A. et al., 2016, ApJ, 819, 129
Robertson B. E., Ellis R. S., Furlanetto S. R., Dunlop J. S., 2015, ApJ, 802, L19
Salpeter E. E., 1955, ApJ, 121, 161
Schaerer D., de Barros S., 2009, A&A, 502, 423 Schmidt et al., 2014, ApJ, 786, 57
Smit R. et al., 2014, ApJ, 784, 58 Smit R. et al., 2015, ApJ, 801, 122
Song M. et al., 2015, preprint (arXiv:1507.05636)
Stanway E. R., Eldridge J. J., Greis S. M. L., Davies L. J. M., Wilkins S. M., Bremer M. N., 2014, MNRAS, 444, 3466
Stanway E. R., Eldridge J. J., Becker G. D., 2016, MNRAS, 456, 485 Stark D. P., Schenker M. A., Ellis R., Robertson B., McLure R., Dunlop J.,
2013, ApJ, 763, 129
Stark D. P. et al., 2015, MNRAS, 454, 1393
Wilkins S. M., Trentham N., Hopkins A. M., 2008a, MNRAS, 385, 687 Wilkins S. M., Hopkins A. M., Trentham N., Tojeiro R., 2008b, MNRAS,
391, 363
Wilkins S. M., Bunker A. J., Ellis R. S., Stark D., Stanway E. R., Chiu K., Lorenzoni S., Jarvis M. J., 2010, MNRAS, 403, 938
Wilkins S. M., Bunker A. J., Lorenzoni S., Caruana J., 2011a, MNRAS, 411, 23
Wilkins S. M., Bunker A. J., Stanway E., Lorenzoni S., Caruana J., 2011b, MNRAS, 417, 717
Wilkins S. M., Gonzalez-Perez V., Lacey C. G., Baugh C. M., 2012a, MNRAS, 424, 1522
Wilkins S. M., Gonzalez-Perez V., Lacey C. G., Baugh C. M., 2012b, MNRAS, 427, 1490
Wilkins S. M., Bunker A., Coulton W., Croft R., Di Matteo T., Khandai N., Feng Y., 2013a, MNRAS, 430, 2885
Wilkins S. M. et al., 2013b, MNRAS, 435, 2885
Wilkins S. M., Bouwens R. J., Oesch P. A., Labb´e I., Sargent M., Caruana J., Wardlow J., Clay S., 2016a, MNRAS, 455, 659
Wilkins S. M., Feng Y., Di-Matteo T., Croft R., Stanway E. R., Bouwens R. J., Thomas P., 2016b, MNRAS, 458, L6
This paper has been typeset from a TEX/LATEX file prepared by the author.
at University of Warwick on August 10, 2016
http://mnras.oxfordjournals.org/
