http://wrap.warwick.ac.uk
Original citation:
Birrell, Stewart A., Fowkes, Mark and Jennings , Paul A.. (2014) Effect of using an
in-vehicle smart driving aid on real-world Driver performance. IEEE Transactions on
Intelligent Transportation Systems, Volume 15 (Number 4). pp. 1801-1810. ISSN
1524-9050
Permanent WRAP url:
http://wrap.warwick.ac.uk/62177
Copyright and reuse:
The Warwick Research Archive Portal (WRAP) makes this work of researchers of the
University of Warwick available open access under the following conditions.
This article is made available under the Creative Commons Attribution 3.0 (CC BY 3.0)
license and may be reused according to the conditions of the license. For more details
see:
http://creativecommons.org/licenses/by/3.0/
A note on versions:
The version presented in WRAP is the published version, or, version of record, and may
be cited as it appears here.
IEEE TRANSACTIONS ON INTELLIGENT TRANSPORTATION SYSTEMS, VOL. 15, NO. 4, AUGUST 2014 1801
Effect of Using an In-Vehicle Smart Driving Aid
on Real-World Driver Performance
Stewart A. Birrell, Mark Fowkes, and Paul A. Jennings
Abstract—A smart driving system (providing both safety and fuel-efficient driving advice in real time in the vehicle) was evalu-ated in real-world on-road driving trials to see if any measurable beneficial changes in driving performance would be observed. Forty participants drove an instrumented vehicle over a 50-min mixed-route driving scenario. Two conditions were adopted: one is a control with no smart driving feedback offered and the other is with advice being presented to the driver via a smartphone in the vehicle. Key findings from the study showed a 4.1% improvement in fuel efficiency when using the smart driving aid, importantly with no increase in journey time or reduction in average speed. Primarily, these efficiency savings were enabled by limiting the use of lower gears (facilitated by planning ahead to avoid unnecessary stops) and an increase in the use of the fifth gear (as advised by the in-vehicle system). Significant and important changes in driving safety behaviors were also observed, with an increase in mean headway to 2.3 s and an almost threefold reduction in time spent traveling closer than 1.5 s to the vehicle in front. This paper has shown that an in-vehicle smart driving system specifically devel-oped and designed with the drivers’ information requirements in mind can lead to significant improvements in driving behaviors in the real world on real roads with real users.
Index Terms—Automotive applications, human factors, vehicle driving, vehicle safety.
I. INTRODUCTION
T
HE rapid development of smartphone technology, mobile computing, and GSM mobile communications to support the connected vehicle has facilitated a step change in in-vehicle information systems (IVIS). Whereas in the initial stages of IVIS deployment in-car entertainment systems and satellite navigation systems were the only systems commonly available, as the market has developed the possibilities have increased. The increasing processing power of smartphones combined with their wireless communication features has resulted in the rapid development of new applications and services hosted as smartphone “apps” [1]. Initially, these driving-related apps fo-cused on green driving and fuel use logs, to Global PositioningManuscript received September 17, 2013; revised January 14, 2014 and April 28, 2014; accepted May 29, 2014. Date of publication June 20, 2014; date of current version August 1, 2014. The Associate Editor for this paper was F.-Y. Wang.
S. A. Birrell was with MIRA Ltd., Nuneaton CV10 0TU, U.K. He is now with the Warwick Manufacturing Group, University of Warwick, Coventry CV4 7AL, U.K. (e-mail: [email protected]).
M. Fowkes is with the Advanced Engineering Department, MIRA Ltd., Nuneaton CV10 0TU, U.K. (e-mail: [email protected]).
P. A. Jennings is with the Warwick Manufacturing Group, University of Warwick, Coventry CV4 7AL, U.K. (e-mail: [email protected]).
Color versions of one or more of the figures in this paper are available online at http://ieeexplore.ieee.org.
Digital Object Identifier 10.1109/TITS.2014.2328357
Satellite (GPS) related apps such as navigation and vehicle location features. However, recently, safety-related apps have emerged in the market, which offer feedback to the driver on as-pects such as lane departure, headway (also known as following distance), and speed violations. The interesting occurrence here is that while safety features or Advanced Driver Assistance Sys-tems (ADAS) have traditionally been the domain of the vehicle manufacturer, this may now be starting to change. Fazeenet al.
[2] suggested that as sensors add to the initial cost of a vehicle and cannot be affordably upgraded, smartphone technology can be used as an alternate device for ADAS assisting the driver and complementing any existing active safety features.
There are a wide range of technologies and applications that are being used in current IVIS functions that are intended to benefit the driver. However, what is as yet unknown is whether these IVIS will have any measurable effects on driving per-formance in the real world. The distraction issues surrounding IVIS has been well researched, with the 100-car naturalistic driving study conducted by the National Highway Traffic Safety Administration (NHTSA) in the United States suggesting that 78% of all crashes involved some degree of driver inattention, and, more specifically, drivers distracted by a secondary task contributed to over 22% of all crashes and near-crashes [3]. Although it might seem counterintuitive to use another potential distraction in an effort to improve safety, Birrell and Young [4] suggested that the statistics may favor this approach as data from the U.K. and United States accident databases show that driver distraction (a subset of inattention) accounted for between 2% [5], [6] and 8% [7] of accidents, respectively, whereas over 90% of accidents were a direct result of inap-propriate driving behavior [5]. With the issue of secondary task distraction researched widely within the literature and of continuing interest to policy makers, it is therefore of relevance to investigate the potential impact of using an IVIS intended to improve driving performance. This paper aims to investigate if real-world driving with an in-vehicle smart driving will have any measurable effect on driving performance.
A. Foot-LITE Smart Driving System
The smart driving system used was developed for a U.K. project called Foot-LITE. The Foot-LITE system aims to bring information on safety and fuel efficiency together on an in-tegrated, adaptive, and intelligent interface presented on a smartphone (HTC HD2) application. The smart driving advice offered is based on the analysis of real-time information related to vehicle operation and local road conditions, with data being collected via an adapted lane departure warning (LDW) camera,
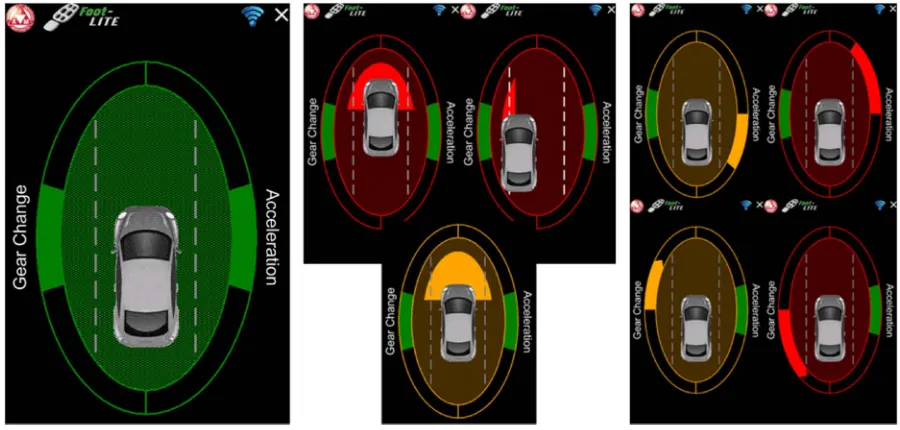
Fig. 1. Example screenshots from the Foot-LITE1smart driving advisor. Only one “oval” is ever presented on the IVIS at any one time, but all aspects depicted
can change in real time and in combination. (Left) Default green display. (Center) Top left to bottom—Headway warning, lane deviation warning, headway caution. (Right) Top left to bottom right—Braking caution, acceleration warning, change up caution, change down warning.
the vehicles On-Board Diagnostics (OBDII) port, as well as a three-axis accelerometer and a GPS module.
A holistic approach to the integration of safety applications (i.e., collision avoidance, lane keeping or assist, and infor-mation on driving speeds and approaching hazards) has been explored both theoretically and practically by researchers on the Integrated Safety Systems (INSAFES) project [8]. However, this paper reports a unique approach to integrate both safety and fuel efficiency driver support information.
The Foot-LITE human–machine interface (HMI) concept (Fig. 1) was developed according to Ecological Interface De-sign (EID [9]) principles. Specifically relevant to the driving task, EID offers to dynamically reflect the driving environment and integrate complex information onto a single direct percep-tion display [9]. Safety and eco informapercep-tion is grouped together with all parameters being displayed concurrently and changing in real time depending on the driver’s inputs. A rudimental workload manager was implemented to control potential con-flicts; examples of the rules applied are as follows: “Safety” feedback had a higher priority to “eco”; no other feedback would be offered if a red safety warning was being displayed; lane departure warnings were only given above 42 mi/h. Given the safety critical nature of evaluating in-vehicle systems in the real world and interacting with other road users, the HMI was rigorously tested and iterated until the version shown in Fig. 1 was released for on-road trials. The ergonomic development and evaluation of the HMI has been reported previously [4], [10].
In-vehicle smart driving information presented to the driver in real time was as follows.
1) Headway: A visual representation of time headway (see Fig. 1, center) was presented to the driver as a cautionary threshold (amber) when the driver was less than 2 s to the
1This design is protected by Brunel University as a U.K. Registered Design
(UK RD 4017134-41 inc.); the unauthorized use or copying of these designs constitutes a legal infringement.
car in front and a warning threshold (red) when below 1.5 s. When the driver was greater than 2 s to the car or when headway information was not presented to the driver (i.e., below 15 mi/h or headway confidence was not sufficient), the display shows the default green. 2) Lane Departure Warning: A red warning was given to the
driver when they deviated from their lane (see Fig. 1, center). For this experimental setup, the lane deviation threshold was set to be very sensitive, i.e., when the driver was close to the lane lines, a warning was displayed, as well as if having actually deviated.
3) Gear Change Advice: Fig. 1 (right, bottom half) shows the gear change advice. The amber arrow suggests either a single gear change up or down in a sequential manner, whereas red shows either a block change (e.g., second to fourth) is preferable or a single shift if high power demand is needed. When the driver adheres to the gear change advice, or when in the correct gear, the gear change section of the HMI will revert to the green default display. 4) Acceleration and Braking: As presented in Fig. 1 (right, top half), braking and acceleration advice is offered to the driver in order to limit excessive acceleration/throttle use and to try and encourage a smoother speed profile. Again, cautionary (amber) and excessive (red) warnings are offered to the driver.
BIRRELLet al.: EFFECT OF USING AN IN-VEHICLE SMART DRIVING AID ON DRIVER PERFORMANCE 1803
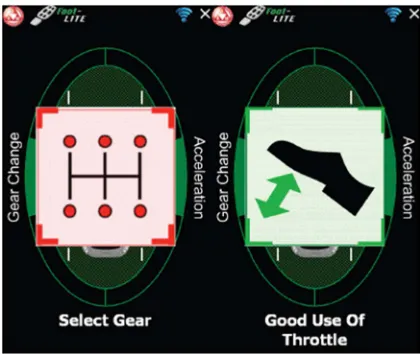
Fig. 2. Two example ”Pop-Ups“ as presented on the Foot-LITE system for coasting and good use of throttle.
In addition to the real-time “operational” feedback that re-lates to physical vehicle control, as detailed above, “tactical” decision-making advice was offered to the driver in the vehicle. This covers higher level feedback for smart driving and is evaluated on driving performance over the preceding 30 s or so. Such tactical advice may include a longer term assessment of speed consistency, throttle use, lane instability, driving time and break recommendations, engine idling, and consistent headway violations. This information is given in the form of “Pop-Ups,” which appear on the screen overlaying the default feedback (see Fig. 2) and disappeared either after 10 s or when a red warning was displayed by the system.
B. Aims and Objectives
This paper was undertaken as part of the TeleFOT project, with the aim to evaluate the effects of driving with a smart driving IVIS on aspects of fuel efficiency and safe driving over a real-world mixed-route driving scenario. The Foot-LITE system was primarily designed to promote a more consistent speed profile and appropriate use of gears (to facilitate an efficient driving style), and to maintain a safe headway and lane position (with respect to safety). Therefore, it is hypothesized that positive changes in driving performance will be observed in respect to these aspects. Parameters such as driving speed and yaw rate were also recorded to provide further contextual information; however, specific prescriptive advice was not of-fered to the driver in real time by the Foot-LITE system for these parameters.
II. METHODOLOGY A. Driving Scenario
The driving scenario adopted for this study was a fixed driving route in and around the Leicestershire (central England) area; it was 28.3 mi (or 45.5 km) in length and took approx-imately 50 min to complete (see Fig. 3; “Start” to “End”). Within the mixed-route driving scenario, there were three clearly defined road categories—“Motorway,” “Urban,” and
Fig. 3. Driving scenario adopted.
“Inter-Urban”—with two interlinking sections. The motorway (also known as freeway or autobahn) section consisted of three or four lanes with a section where two motorways merged; the speed limit was 70 mi/h (≈113 km/h) and took approximately 11–12 min to complete. The urban section of roadway was com-pleted on unregistered, residential single carriageway and one-way roads, with numerous pedestrian crossings, roundabouts, and T-junctions present. The speed limit throughout was 30 mi/h (≈48 km/h) and took approximately 8 min to complete. Within the inter-urban section, the main carriageway was all one lane in width with multiple lanes at traffic light controlled intersections and roundabouts; speed limits varied between 40, 50, and 60 mi/h (≈64, 80, and 97 km/h). This was the longest section of roadway taking approximately 18 min to complete. These three sections combined to form the mixed-route driving scenario.
As shown in Fig. 3, the trial started and finished at “Home,” with the period of driving until the “Start” of the motorway section reserved for the participant to further familiarize them-selves with the test vehicle, and in the experimental condition, the smart driving advisor. The final section from the “End” of inter-urban to “Home” was again excluded as speed limits dropped to 30 mi/h with traffic densities increasing.
In all driving conditions, participants were given route guid-ance instructions verbally by the examiner, who was present in the vehicle at all times. This was offered according to a fixed script to ensure all drivers received the same instructions. The route description also included some tactical information such as upcoming changes to 30 mi/h speed limits, approaching traffic lights, as well as standard instructions such as “At the roundabout turn RIGHT, 2nd exit, right hand lane.” All participants drove the same instrumented vehicle throughout the study; this was a U.K. right-hand drive 2006 Ford Focus Zetec, 1.6 L diesel with manual transmission.
B. Participants
[image:4.594.301.551.71.237.2]TABLE I
STUDYPARTICIPANTDEMOGRAPHICS(SD=STANDARDDEVIATION)
volunteers replying to a company-wide circular email. The principal inclusion criterion was that participants were covered to drive a company vehicle on the company insurance policy. In order to satisfy this, numerous criteria had to be met, including the following: being over 21 years of age; having held their license for greater than one year; and not having over six points on their license or having been disqualified from driving for certain offenses. Only participants who had no working knowledge of and were not directly involved in either the Foot-LITE or TeleFOT projects were selected for the study. In addition, participants were not expressly informed that the current authors were involved previously in the Foot-LITE project, as this may have influenced their driving behavior.
C. Data Collection and Dependent Variables
Driving performance data were collected for this study using two principal logging methods (1 and 2), as well as end of journey fuel consumption (method 3):
1) Foot-LITE: The system itself collects numerous param-eters from different sources (OBDII port, adapted LDW camera, GPS on smartphone, and three-axis accelerome-ter in the processing unit) and fuses these data to form the feedback presented via the smartphone application. All these parameters are recorded and converted to .csv files for analysis. Data presented in this paper collected from the Foot-LITE system include the following:
Time headway: continuous (s), % journey spent under 1.5 s;
Engine parameters: continuous revolutions per minute (RPM) and engine load (%);
Throttle position: continuous (%);
Lane deviations: number(n)and mean position in lane
(m);
Gear: current and ideal gear position (% time in each gear). 2) GPS logger: Supplied by Race Technology (DL1 Mk3), which records GPS at 20 Hz and a three-axis accelerom-eter and gyroscope at 100 Hz. Data are stored for anal-ysis in their bespoke software package. Data collected included the following:
Vehicle speed: continuous (mi/h);
Lateral and longitudinal acceleration: continuous (m/s/s);
Yaw rate: continuous (deg/s);
Time: journey time (s).
3) Internal trip computer: In addition to the continuous data collected above, fuel economy in miles per gallon (MPG) according to the internal trip computer was recorded at the end of the journey.
Driving data collected by the data loggers (methods 1 and 2) were trimmed to only include data collected between the “Start”
of the motorway section and “End” of the inter-urban section (see Fig. 3). Once data had been trimmed (this was done in MS Excel for the Foot-LITE logged data and “Analysis v8” (Race Technology’s bespoke software package) for the GPS logger), it was imported into Excel for processing. The mean, maximum (or minimum for headway and braking forces), and standard deviation of each parameter were then processed for each participant, with the mean for all participants then calculated.
Data from seven participants were excluded from the analy-sis. This was as a result of the following: the GPS logger not being active in either the control or experimental conditions (in two cases); data not collected from the Foot-LITE system in either conditions (two cases); or the Foot-LITE system not providing effective feedback in the experimental condition (three cases). This left 33 participants (24 male and 9 female) with complete data sets available for analysis. Statistical testing was conducted using SPSS 16.0 for Windows, and significance was accepted atp <0.05. Two multivariate analysis of variance tests evaluated potential differences between the data collected from the Foot-LITE system and data logger (methods 1 and 2), with a pairedT-test used to assess the fuel efficiency (method 3) data from the trip computer.
D. Variable Classification and Data Processing
The technical implementation of the Foot-LITE system for these on-road trials was the responsibility of other partners on the project; hence, details of this proprietary information are limited. In general, the responsibilities for implementation were as follows: data collection (TRW Conekt Ltd.), data processing and algorithms (Ricardo Ltd.), and visual presentation (HW Comms Ltd.). Fig. 4 shows the architecture for road trial implementation adopted for this study [11].
Safety data (i.e., headway and lane position) are primarily collected from the adapted LDW camera, with the on-board processing unit (“TRW ECU” in Fig. 3) fusing these data with vehicle speed (from the OBDII port) to calculate the thresholds that are interpreted by the smartphone and presented to the driver. Gear change was calculated via a self-learning algorithm that utilized vehicle speed and RPM collected from the ODBII to infer current gear position and compare this with a calculated “ideal.” Acceleration feedback was similarly computed with accelerometers in the ECU fusing with vehicle speed to present excessive acceleration and braking thresholds, again compared with an ideal and presented to the driver.
E. Procedure
BIRRELLet al.: EFFECT OF USING AN IN-VEHICLE SMART DRIVING AID ON DRIVER PERFORMANCE 1805
Fig. 4. Overview of Foot-LITE components for the road trial implementation [11].
counterbalanced; this was to ensure an equal gender split (i.e., half the male and female participants completed the smart driving experimental condition first) as well as to overcome some scheduling issues.
When participants arrived to take part in the study for their first randomized condition, they were given a verbal and written explanation of the TeleFOT project, as well as the specific aims of the study. After this, they were shown the Risk Assessment, and finally, signed informed consent was gained. Following this, participants were shown to the test vehicle, where they were instructed to adjust the seats, steering wheel, and mirrors so that they were comfortable and accessible. All drivers had the opportunity to take the test vehicle on a brief drive to familiarize themselves with the vehicle before the actual trial begins. In addition to this, the first 10 min of the journey was excluded (see Section II-A) to ensure that the drivers were comfortable with the vehicle controls.
In the control condition, participants were simply instructed to drive as they would do normally. However, before the start of the experimental condition, participants were given a detailed explanation of the Foot-LITE system, including being shown what feedback the system would offer; they also had chance to ask any questions. Before each condition, the data two loggers were started (GPS and Foot-LITE); however, in the control condition, the smartphone was set to silent and placed out of sight of the driver, but data were still collected. In the experimental condition, the smartphone was placed in a phone holder, fixed by a suction cup to the windshield. This was located in the lower left peripheries of the driver’s vision, but not in the direct line of sight.
Immediately prior to the commencement of the driving trial, the internal trip computer was reset to zero. In the experimental Foot-LITE condition, participants were also shown the interface and each event highlighted as it appeared on the screen. As with the control condition, participants were instructed to drive as they would do normally, but taking on board the smart driving information if they deemed it reliable and applicable information. They were not instructed to follow the advice explicitly and only to look at the interface when they deemed it safe to do so.
TABLE II
RESULTS FOR THEGENERICDRIVINGPARAMETERS FOR THEENTIRE
JOURNEY IN THECONTROL ANDEXPERIMENTALCONDITIONS
III. RESULTS A. Generic Driving Parameters
Aspects such as driving speed, journey time, braking and acceleration forces, and yaw rates are parameters that are universally important for both safety and efficiency. Results from the current study showed no differences (p >0.05) in any of the aforementioned parameters between the conditions (see Table II).
B. Safety Parameters
Safety parameters that the Foot-LITE smart driving system specifically advised on were headway and lane position. Results showed that lane position did not differ significantly(p >0.05)
with in-vehicle feedback advising when the driver was near to or out of lane. The mean number of lane deviation warnings offered by the system for all participants over the journey in the control condition was 17.7, and this was reduced to 15.1 in the experimental condition; this difference was not significant. Mean lane position [represented by meters from the calculated center of the roadway (a positive number indicates to the right of center, whereas a negative number indicates to the left)] was not significantly different between the conditions at either 0.229 or 0.210 m for the control or experimental condition, respectively.
Fig. 5. Mean and minimum time headways (in seconds) for all participants over the entire mixed-route driving scenario. The asterisk(∗) indicates a significant difference(p <0.05)to the control condition, and plus (+) indicates a trend(p <0.1). Error bars represent the standard deviation of the mean data.
when a car was detected within a 5 s headway filter) increased from 2.05(Standard Deviation(SD) =0.32)to 2.33 (0.33) s from the control to the experimental condition (see Fig. 5); this difference was significant (F(1,65)=17.41, p <0.001).
Minimum time headway (i.e., the closest that each individual participant got to the car in front over the entire journey; see Fig. 5) was also greater when using the smart driving aid at 0.737 s (0.21) versus 0.657 (0.17) s in the control condition; this difference was, however, not significant but showed a strong trend(F(1,65)=2.92, p <0.1). The final headway parameter
was defined as the percentage of the journey that the partici-pants spent traveling closer than 1.5 s to the car in front (or when receiving a “Red” headway warning as in Fig. 1, center). This was seen to significantly decrease(F(1,65)=16.86, p <
0.001) from 6.61% (5.77) in the control condition to 2.32% (1.78) in the experimental condition.
C. Efficiency Parameters
The principal parameter of driving efficiency is the actual fuel economy or the number of miles driven per gallon of fuel used (MPG); this was recorded post trip according to the vehicles’ internal trip computer. Results show that the average fuel economy significantly increased by 4.1% between the control and experimental conditions (F(1,65)=15.96,
p <0.001); this was an increase from 54.8 (3.10) to 57.0 (2.90) MPG (see Fig. 6). Please note that fuel economy is pre-sented above as U.K. MPG, and converting to l/100 km shows a reduction between the control (4.29 l/100 km) and experimental (4.13 l/100 km) conditions.
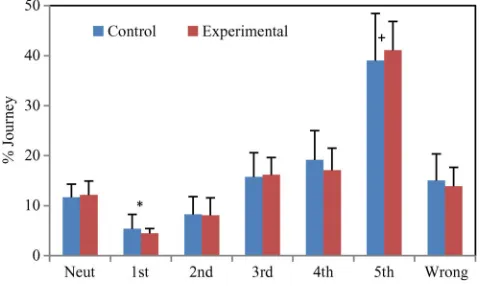
Specifically related to fuel efficiency, certain changes in driving behavior were also observed, which may account for the difference noted above. Drivers in the experimental condition (i.e., when receiving smart driving feedback) spent 13.8%
(SD=3.82)of the drive in the wrong gear; this was 15.0% (5.32) in the control condition (see Fig. 7). While this difference was not significant, it was when we consider the use of the first gear, which reduced from 5.4% (2.88) to 4.5% (0.93) between control and experimental conditions, respectively (F(1,65)=
4.56, p <0.05), and the use of the fifth gear, which showed a strong trend(F(1,65)=2.82, p <0.1)for an increase from
[image:7.594.311.551.280.423.2]39.0% (9.43) to 41.1% (5.79).
Fig. 6. Fuel economy (MPG) for each condition. Blue bars represent mean MPG for all participants, red squares represent the minimum MPG achieved, green triangles represent the maximum MPG, and error bars represent the standard deviation of the data. The asterisk(∗)indicates a significant difference
(p <0.001)to the control condition.
Fig. 7. Percentage of the entire journey spent in each individual gear. The asterisk(∗)indicates a significant difference(p <0.05)to the control condi-tion, and Plus (+) indicates a trend(p <0.1). Error bars represent the standard deviation of the mean data.
Engine load and speed (RPM) also differed when using the smart driving system, with maximum engine RPM reducing significantly (F(1,65)=3.69, p <0.05) from 2921.6 (409.5)
to 2791.5 (272.2) and mean engine load increasing(F(1,65)=
5.78, p <0.05)from 42.6% (2.38) to 43.9% (2.09).
The final efficiency related parameter is throttle use. No difference (p >0.05) in mean throttle position was observed when data were averaged for all participants over the entire journey, at 18.1% (1.56) and 17.9% (1.37) in the control and experimental conditions, respectively. However, a trend was observed for a difference when considering maximum throt-tle position (F(1,65)=1.73, p <0.1), which decreased from
53.3% (15.9) in the control to 48.1% (16.6) in the experimental. IV. DISCUSSION
A. Generic Driving Parameters
BIRRELLet al.: EFFECT OF USING AN IN-VEHICLE SMART DRIVING AID ON DRIVER PERFORMANCE 1807
longer to reach the destination. While it is true for mass market internal combustion engine (ICE)-equipped powertrains that fuel efficiency is at its maximum between 60 and 80 km/h—as this optimizes the tradeoff between overcoming rolling road resistance and increasing wind resistance [12]–[14]—simply reducing speed is not the only, nor is it the optimal, strategy for eco-driving, particularly considering the implications for jour-ney time [15]. Minimizing unnecessary stops, and subsequently the use of the first and second gears, is a driving behavior that has been strongly linked to improvements in fuel efficiency [16], [17], as is increasing the use of engine braking. In modern ICE vehicles, when the foot is released from the throttle, the engine management system cuts off fuel to the engine, which effectively means that the vehicle is consuming no fuel in this “runoff” period. Thus, planning ahead to avoid unnecessary braking by releasing the throttle earlier will save fuel and fa-cilitates a smoother speed profile. Both these techniques (stops and speed profile) can be theoretically achieved without having an impact on average speed and subsequent journey time.
Accelerometer-derived parameters (acceleration, decelera-tion, lateral acceleradecelera-tion, and yaw rates) showed no differ-ences between the control and experimental conditions. This was not anticipated as the smart driving system gave specific feedback on excessive acceleration and braking rates to par-ticipants, aimed at encouraging the driver to plan ahead and avoid unnecessary stops; therefore, it was not unreasonable to expect moderated throttle and brake use. While the presentation of acceleration and braking feedback via the HMI was less frequent than other messages (gear, lane, and headway), they were activated at some stage during the driving scenario by all participants. However, anecdotal evidence from this current study suggests some participants, in an effort to increase engine braking and minimizing foot brake use, actually ended up braking later and slightly harder when required to stop by sudden changes in the traffic situation (i.e., a previously unseen vehicle appearing at a junction), thus negating any overall effect on acceleration forces observed.
B. Efficiency Parameters
[image:8.594.305.548.69.211.2]Using the in-vehicle smart driving system adopted in this paper elicited a positive effect on driver performance, with an average improvement of 4.1% in fuel economy over the control condition. Fig. 8 shows that the differences ranged from a 7.8% decrement to a 17.0% improvement in MPG. It is plausible that this effect may simply be a result of participants changing their driving behaviors as they felt they were being “assessed” when using the smart driving aid. However, this is unlikely to be the case as the exact same procedure was used for the control condition (in-vehicle cameras and data loggers active, a study examiner in the passenger seat with a clipboard taking notes) compared with the experimental condition. The data also suggest that no order effect was present, with average fuel efficiency for the first randomized condition being 55.9 MPG (2.94) and the second being practically identical at 55.9 (3.45). Therefore, the authors suggested that the use of the smart driving system resulted in positive changes to fuel economy of 4.1% with no change in average speed or journey time.
Fig. 8. Percentage change in fuel economy between the control and exper-imental conditions for each participant. Red bar indicates the group mean of 4.1%.
If changes to average speed, braking, and acceleration param-eters are not responsible for the observed increase in driving efficiency, then other factors must be at hand. The Foot-LITE system also offered feedback on appropriate gear selection. Research conducted by Johanssonet al.[17] found certain char-acteristics of driving behavior that were significantly correlated with good fuel economy; these included avoiding unnecessary stops (as aforementioned) and minimizing the use of the first and second gears, increased use of the fifth gear, and block changing gears where possible. This is supported by research into the effectiveness of using gear shift indicators (GSI) with research suggesting that adhering to gear shift advice (where presented on particular makes and models of car) resulted in a 3%–5% reduction in CO2output (and corresponding increase
in fuel efficiency) for the standard emissions’ legislative driving cycle. This effect increased to between 7% and 11% when considering urban and rural driving, respectively [18].
Results from this current study confirmed that using the smart driving aid (with integrated GSI) resulted in significant changes in gear use, with Fig. 7 showing a significant reduction in the use of the first gear and a trend for an increase in the use of the fifth gear over the control condition. Further anecdotal evidence from the study participants indicated that they were surprised how early the system was suggesting a change from the fourth to the fifth gear. This was particularly noticeable in the inter-urban section where the posted speed limit was frequently 40 mi/h, with Foot-LITE suggesting a change from fourth to fifth at around this speed when participants may not normally have shifted. In addition, interesting is the comparison between these results and those from Vermeulen [18], who found that when running computed driver modeling simula-tions, the use of GSI led to increases in efficiency of between 3% and 5%. This current study showed a difference of 4.1% over mixed-route real-world driving, which is comparable with the simulated results.
of the eco-driving “Golden Rules,”2 and while the Foot-LITE
systems gear shift rules are not as simplistic as this (engine load is also considered in the algorithms, meaning at times where increased engine power is needed (i.e., going up a hill or during heavy acceleration), gear shift advice would be delayed and subsequently offered early if the engine is under low loads), over revving is clearly an unwanted behavior that was corrected when using the smart driving system, as shown by the decrease in maximum RPM.
Another possible explanation for the increase in fuel effi-ciency observed in this current study when using the Foot-LITE system was the trend for a reduction in maximum throttle position (mean for all participants) of 10% between the control and experimental conditions. While no direct real-time advice was given to the driver regarding the use of the throttle pedal, it was implicit in the description of what constitutes smart driving and the explanation of the Foot-LITE system at the beginning of the trial, i.e., the limiting of heavy acceleration. In addition, as shown in Fig. 2, some tactical throttle advice was given to the driver in the form of a “Pop-Up” message; this was displayed when the driver was accelerating using appropriate throttle (in this case, appropriate is defined as less than 50% of the pedals travel). If or when this pop-up message was displayed, the examiner would describe the behavior that the system was encouraging (or discouraging if the message was red). Specifically, this was promoting “positive” throttle use that did not exceed 50%, as this has been shown to facilitate an eco-driving style and increase in fuel efficiency [19], [20].
C. Safety Parameters
The U.K. Highway Code states that drivers should allow at least a 2-s gap between you and the vehicle in front on roads carrying faster moving traffic and in tunnels where visibility is reduced. The gap should be at least doubled on wet roads and increased still further on icy roads.3 This is termed “The
2-Second Rule” and is suggested to be a safe following distance for all types of road categories, allowing the driver sufficient time to react and then decelerate safely to any change in situation ahead of them. The 2-s rule was adopted within the Foot-LITE system, with the HMI showing an amber warning when the driver was closer than 2 s to the car in front; this escalated to a red warning when within 1.5 s. Driving too close to the car in front is a significant safety issue with statistics for the U.K. showing that “Following too close” was a contributory factor to 8397 (or 7%) of road accidents in 2010; this increased to 17% of all accidents occurring on the higher speeds mo-torways. Similarly, motorways also had the highest percentage of accidents that involved either sudden braking or swerving as contributory factors when compared with other road types [21]. Research has shown that during traffic simulations, using an adaptive headway strategy (where the simulated vehicle increases headway distances during periods of high traffic densities) led to a 40-fold decrease in the number of accidents
2http://www.ecodrive.org/en/what_is_ecodriving-/
the_golden_rules_of_ecodriving/.
3https://www.gov.uk/general-rules-all-drivers-riders-103-to-158/
control-of-the-vehicle-117-to-126.
at moderate traffic densities; even at high densities, the decrease in accidents predicted by the model was 50% less [22].
Results from this current study showed that mean headway for the entire journey increased by 13.7% to 2.33 s in the exper-imental smart driving feedback condition compared with 2.05 s in the control condition (Fig. 5). In addition to a significant difference in mean headway, a considerable difference was seen in the percentage of the journey spent traveling closer than 1.5 s time headway. In the control condition, participants spent an average of 6.61% of the entire journey under 1.5 s; this was almost three times more than in the experimental condition, which was only 2.32%.
Results from other research that have evaluated the use of a headway warning systems are interesting, with Ben-Yaacovet al.[23] showing that drivers spent 42.2% of their driving time at headways of less than 1 s, and when headway warning were activated, this significantly reduced to only 3.5%. A longitudinal study conducted by Shinar and Schechtman [24] evaluated 43 participants using instrumented vehicles over six weeks (three weeks with the system off, three weeks with the system on) with in-vehicle headway feedback. Results showed a 25% decrease in time spent under 0.8 s headway from exper-imental to control and 14% more time maintaining headways of above 1.2 s. A feedback–reward field trial also showed that drivers can amend headway behavior over a 12-week period if both informed instantaneously in the vehicle and also post journey via a specifically developed website where monetary rewards were offered for good performance. Results showed that headway compliance (i.e., greater than 1.2 s) was 81% in the baseline condition and 91.2% in the intervention condition [25]. Haptic feedback for headway warnings is also a viable option to limit visual load on the driver with improvement in braking response time and headway reduction when using haptic stimuli provided through the accelerator pedal over a visual display [26].
As we can see, mean headway times presented in the research above are shorter than experienced in the current trial. This may be a function of the fact that participants were given initial headway feedback (amber warning, no audio) at 2 s rather than the lower values selected in the previous studies, which were 1.2 s [24], [25] and 1.0 s [23]. This indicates that giving headway warnings at 2 s, rather than 1 s, leads to a greater following distances being employed by drivers and, hence, the positive effect on driving safety. However, care would need to be taken regarding user acceptance as people may be less likely to accept a system that may allow them to be “cut up” more frequently in high-density traffic. A likely tradeoff between acceptance and safety is needed, particularly given that a time headway of 1.43 s has been suggested to be the preferred control target during steady car following [27].
BIRRELLet al.: EFFECT OF USING AN IN-VEHICLE SMART DRIVING AID ON DRIVER PERFORMANCE 1809
over a 50-min driving scenario, whereas previous research has investigated the effects of distracted driving, using secondary tasks over a far shorter period of time (i.e., 30–60 s). In addition with the current study, there was no specific secondary task being completed, as reviewing the smart driving aid could be considered a monitoring task. Lane deviation can be considered a distraction- or a fatigue-related event, whereas headway viola-tions are predominately a driver-decision-based event (i.e., the driver knows they are driving close to the car in front; whether they know they are “too” close is a different matter [23], [30]). Therefore, the vast majority of lane deviations will be un-intended events; thus, providing appropriate feedback during nondistracted driving will not lead to a reduction in actual lane deviations. In the context of this study, no difference in lane keeping parameters between the control and experimental conditions could suggest that the driver was not distracted when using the system, but will however be notified of such unin-tended deviation and able to take corrective action. Research by Taieb-Maimon and Shinar [30] suggested that a car fitted with a lane departure warning system could result in a reduction of 60% in side collision accidents and a 10% reduction in accident severity, as well as a 25% accident avoidance and 15% accident severity reduction for accidents where the car has left the roadway.
While no significant difference in lane deviations were ob-served when using the smart driving system in this current study, deviations and near deviations did reduce from 17.7 in the control to 15.1 in the experimental condition. This is not only a small decrease, but not the increase that was observed by [28] when studying the effects of a secondary task. This, in combination with results from a previous study utilizing the Foot-LITE system, which suggested that using a Satnav for route guidance was more visually demanding [32], indicates that using the smart driving system (with integrated safety and efficiency feedback) does not distract the driver. This is corrob-orated by further research conducted by NHTSA [33], which identifies that the visual–manual aspects of cell phone use (i.e., dialing and messaging) significantly increase the crash risk ratios rather than the purely visual (i.e., glancing at the screen) or cognitive (engaging in a hands-free conversation) activities associated with cell phone use and that simple secondary tasks do not appear to have a crash risk that is greater than normal driving [3].
V. CONCLUSION
Previous research has shown that IVIS can be distracting to the driver, cause an increase in workload, and also be detrimen-tal to certain driving performance characteristics—specifically when they require the driver to engage in a nondriving-related secondary task. However, many IVIS have recently been de-veloped, which aim to actually increase either safety or driving efficiency or even comfort and convenience.
Key findings from the study showed that significant and important changes in driving safety behaviors were observed, with an increase in mean headway to 2.3 s and an almost threefold reduction in time spent traveling closer than 1.5 s to the vehicle in front. All these positive changes were at no
cost to distraction-related parameters such as lane deviations. Also observed was a 4.1% improvement in fuel efficiency when using the smart driving aid, importantly with no increase in journey time or reduction in average speed. Understanding what driving behaviors contributed to the increase in fuel economy observed when using the Foot-LITE smart driving system is important to aid our understanding of where real-world fuel savings can be made. Primarily, these efficiency savings were made by limiting the use of lower gears (facilitated by planning ahead to avoid unnecessary stops) and an increase in the use of the fifth gear (as advised by the in-vehicle system).
This paper has shown that an intelligent in-vehicle smart driving system specifically developed and designed with the drivers’ information requirements in mind can lead to signifi-cant improvements in driving performance in the real world on real roads with real users.
ACKNOWLEDGMENT
The user trials conducted under the TeleFOT project were partly funded by the European Commission DG Information Society and Media in the Seventh Framework Programme (FP7-ICT-2007-2). The Foot-LITE Smart Driving System eval-uated in the trials was sponsored by the Technology Strategy Board, Engineering and Physical Sciences Research Council, and the U.K. Department for Transport (Project 01.10.03.08/ 52C). The authors would like to thank N. Shehata for assisting with the data collection.
REFERENCES
[1] R. Araujo, A. Igreja, R. de Castro, and R. Araujo, “Driving Coach: A smartphone application to evaluate driving efficient patterns,” inProc. IEEE Intell. Veh. Symp., Jun. 2012, pp. 1005–1010.
[2] M. Fazeen, B. Gozick, R. Dantu, M. Bhukhiya, and M. Gonzalez, “Safe driving using mobile phones,”IEEE Trans. Intell. Transp. Syst., vol. 13, no. 3, pp. 1462–1468, Sep. 2012.
[3] S. Klauer, D. Dingus, T. Neale, J. Sudweeks, and D. Ramset, “The im-pact of driver inattention on near-crash/crash risk: An analysis using the 100-car naturalistic study data,” National Highway Traffic Safety Admin-istration (NHTSA), Washington, DC, USA, Tech. Rep. DOT HS 810 594, Apr. 2006.
[4] S. Birrell and M. Young, “The impact of smart driving aids on driving performance and driver distraction,”Transp. Res. Part F, vol. 14, no. 6, pp. 484–493, Nov. 2011.
[5] J. Mosedale, A. Purdy, and E. Clarkson, “Contributory factors to road accidents,” Department for Transport, London, U.K., Transp. Statist., Apr. 2011.
[6] A. Stevens and R. Minton, “In-vehicle distraction and fatal accidents in England and Wales,”Accid. Anal. Prev., vol. 33, no. 4, pp. 539–545, Jul. 2001.
[7] J. Stutts, D. Reinfurt, L. Staplin, and E. Rodgman, “The role of driver distraction in traffic crashes,” Univ. of North Carolina Highway Safety Research Center, Chapel Hill, NC, USA, Tech Rep. 202/638 5944, May 2001.
[8] A. Amditiset al., “A holistic approach to the integration of safety ap-plications: The INSAFES subproject within the European Framework Programme 6 Integrating Project PReVENT,”IEEE Trans. Intell. Transp. Syst., vol. 11, no. 3, pp. 554–566, Sep. 2010.
[9] C. Burns and J. Hajdukiewicz,Ecological Interface Design. Boca Raton, FL, USA: CRC Press, 2004.
[10] M. Young and S. Birrell, “Ecological IVIS design: Using EID to develop a novel in-vehicle information system,” Theor. Issues Ergonom. Sci., vol. 13, no. 2, pp. 225–239, Mar./Apr. 2012.
[11] “System options and development issues,” Foot-LITE project, Warwickshire, U.K., Tech. Rep. D4.3, Jul. 2011.
[13] N. Haworth and M. Symmons, “The relationship between fuel economy and safety outcomes,” Monash University Accident Research Centre, Clayton, VIC, Australia, Tech. Rep. 188, pp. 1–67, 2001.
[14] I. El-Shawarby, K. Ahn, and H. Rakha, “Comparative field evaluation of vehicle cruise speed and acceleration level impacts on hot stabilized emissions,”Transp. Res. Part D, vol. 10, no. 1, pp. 13–30, Jan. 2005. [15] M. Young, S. Birrell, and N. Stanton, “Safe driving in a green world:
A review of driver performance benchmarks and technologies to support “smart” driving,”Appl. Ergonom., vol. 42, no. 4, pp. 533–539, May 2011. [16] L. Evans, “Driver behaviour effects on fuel consumption in urban
driv-ing,”Hum. Factors, vol. 21, no. 4, pp. 389–398, Aug. 1979.
[17] H. Johansson, P. Gustafsson, M. Henke, and M. Rosengren, “Impact of EcoDriving on emissions,” inProc. Int. Sci. Symp. Transp. Air Pollut., Avignon, France, Jun. 2003, pp. 97–105.
[18] R. Vermeulen, “The effects of a range of measures to reduce the tail pipe emissions and/or the fuel consumption of modern passenger cars on petrol and diesel,” TNO Science and Industry, Delft, The Netherlands, Tech. Rep. IS-RPT-033-DTS-2006-01695, pp. 1–86, Feb. 2006.
[19] H. Johansson, J. Farnlund, and C. Ergstrom, “Impact of EcoDriving on emissions and fuel consumption: A pre-study,” Swedish National Road Administration, Borlange, Sweden, Tech. Rep 165E, pp. 1–41, 1999. [20] H. van de Burgwal and N. Gense, “Application of “New Style Driving”
and effects on passenger car fuel and emissions,” TNO Science and Industry, Delft, The Netherlands, Tech. Rep. 02.OR.VM.004.1/HVDB, pp. 1–59, 2002.
[21] “Contributory factors to reported road accidents,” Department for Trans-port, London, U.K., Tech. Rep. Rep. Road Casualties Great Britain, 2011. [22] T. Wanschura, S. Migowsky, and P. Rujan, “Effect of adaptive strategies on a simple model of freeway traffic,” inProc. Workshop Traffic Gran-ular Flow HLRZ Forschungszentrum Julich (KFA) World Sci., M. Wolf, A. Schreckenberg, and A. Bachem, Eds., Oct. 1995, pp. 211–215. [23] A. Ben-Yaakov, M. Maltz, and D. Shinar, “Effects of an in-vehicle
col-lision avoidance warning system on short- and long-term driving perfor-mance,”Hum. Factors, vol. 44, no. 2, pp. 335–342, 2002.
[24] D. Shinar and E. Schechtman, “Headway feedback improves intervehic-ular distance: A field study,”Hum. Factors, vol. 44, no. 3, pp. 474–481, 2002.
[25] M. Merrikhpour, B. Donmez, and V. Battista, “Effects of a Feedback– Reward System on Headway Time,” inProc. 22nd Can. Multidisciplinary Road Safety Conf., Banff, AB, Canada, Jun. 2012, pp. 10–13.
[26] H. De Rosarioet al., “Efficacy and feeling of a vibrotactile frontal colli-sion warning implemented in a haptic pedal,”Transp. Res. Part F, vol. 13, no. 2, pp. 80–91, Mar. 2010.
[27] J. Wang, L. Zhang, D. Zhang, and K. Li, “An adaptive longitudinal driving assistance system based on driver characteristics,”IEEE Trans. Intell. Transp. Syst., vol. 14, no. 1, pp. 1–12, Mar. 2013.
[28] C. Blaschke, F. Breyer, B. Färber, J. Freyer, and R. Limbacher, “Driver distraction based lane-keeping assistance,”Transp. Res. Part F, vol. 12, no. 4, pp. 288–299, Jul. 2009.
[29] T. Alkim, G. Bootsma, and S. Hoogendoorn, “Field operational test ‘The Assisted Driver’,” inProc. IEEE Intell. Veh. Symp., Istanbul, Turkey, Jun. 13–15, 2007, pp. 1198–1203.
[30] M. Taieb-Maimon and D. Shinar, “Minimum and comfortable driving headways: Reality versus perception,” Hum. Factors, vol. 43, no. 1, pp. 159–172, Feb. 2001.
[31] J. Abeleet al., “Exploratory study on the potential socio-economic impact of the introduction of intelligent safety systems in road vehicles,” SEiSS, Teltow, Germany, Final Rep., pp. 1–169, 2005.
[32] S. Birrell and M. Fowkes, “Glance behaviours when using an in-vehicle smart driving aid: A real-world, on-road driving study,” Transp. Res. Part F, vol. 22, pp. 113–125, Jan. 2014.
[33] G. Fitchet al., “The impact of hand-held and hands-free cell phone use on driving performance and safety-critical event risk,” National Highway Traffic Safety Administration, Washington, DC, WA, USA, Tech. Rep. DOT HS 811 757, pp. 1–273, Apr. 2013.
Stewart A. Birrell received the B.Sc. degree in sports science from University of Hertfordshire, Hatfield, U.K., in 2002 and the Ph.D. in ergonomics from Loughborough University, Loughborough, U.K., in 2007.
He is a Senior Research Fellow with the War-wick Manufacturing Group (WMG), University of Warwick, Coventry, U.K., where he provides human factors support for WMG’s contribution to the High Value Manufacturing Catapult. His research interests have remained strongly embedded in how humans interact with their surroundings, equipment and technology, and subsequent effects on task outcome.
Dr. Birrell is a Registered Member of the Institute of Ergonomics and Human Factors in the U.K.
Mark Fowkes received the B.Sc. degree in ergonomics from Loughborough University, Loughborough, U.K., in 1976.
From 1976 to 1977 he was an Ergonomics En-gineer as part of the Advanced EnEn-gineering Group, Leyland Truck and Bus, Leyland, U.K. In 1977 he joined the Motor Industry Research Association (currently MIRA Ltd.), Nuneaton, U.K., as a Hu-man Factors Engineer, where he is currently Senior Consultant within the Future Transport Technology Group. He has led MIRA Ltd.’s participation in many national and international collaborative research projects related to vehicle and systems design and their impacts on driver behavior. His research interests include human factors, user-centered design, driver psychology, human visual behavior, and intelligent transportation systems evaluation.
Paul A. Jennings received the B.A. degree in physics from University of Oxford, Oxford, U.K., in 1985 and the Eng.D. degree from University of Warwick, Coventry, U.K., in 1996.
![Fig. 4.Overview of Foot-LITE components for the road trial implementation [11].](https://thumb-us.123doks.com/thumbv2/123dok_us/9535566.458494/6.594.319.526.314.437/fig-overview-foot-lite-components-road-trial-implementation.webp)