The study of biological symmetry and lateralization continues to be an important and active area of research (e.g. Møller and Swaddle, 1997; Ryan et al., 1999). This is because bilateral symmetry is a fundamental developmental and organizing principle for many organisms, and departures from symmetry can be used as indicators of specialized trait functions and/or to assess the buffering capacity of an organism against environmental perturbations (Van Valen, 1962; Palmer, 1996; Møller and Swaddle, 1997; Van Dongen, 1998; Whitlock, 1998). For example, the asymmetry in the placement and opening of the external auditory meatus in some nocturnal owls reveals a distinct adaptation for detecting the elevational location of prey-generated sounds (Payne, 1971; Norberg, 1977; Knudsen et al., 1994), the directional nasal asymmetry (right-side hypertrophy, left-side atrophy) in the skull of sperm whales and other odontocetes may be associated with sound production and enhanced echolocation abilities (Cranford, 1992, 1999) and the asymmetry in the lens and optic lobes of the squid visual system (family Histioteuthidae) may be related to their orientation and hunting behavior (Denton
and Warren, 1968; Wentworth and Muntz, 1989). For a fascinating account of many other types of animal asymmetries, the interested reader is referred to the short booklet by Neville (1976).
In general, three types of biological asymmetry exist, two of which are adaptive (Van Valen, 1962; Palmer and Strobeck, 1986; Palmer, 1996; Møller and Swaddle, 1997). Fluctuating asymmetry results from the inability of an organism to undergo identical development on the right and left sides, resulting in small random (non-directional) deviations from perfect bilateral symmetry. Fluctuating asymmetry, which is characterized by right-minus-left (R–L) trait differences normally distributed about a mean difference of zero, has received considerable attention as a measure of developmental stability, individual quality (vigor, fecundity, strength and survival) and the direction of selection (Swaddle et al., 1994; Palmer, 1996; Møller and Swaddle, 1997). Directional asymmetry occurs when a character develops to a greater extent on one side of the plane of bilateral symmetry, resulting in a consistent side bias characterized by R–L trait differences JEB2879
The study of biological symmetry continues to be an important and active area of research, yet in the hearing sciences there are no established quantitative methods for measuring auditory asymmetries and dissimilarities in threshold tuning curves (i.e. audiograms). Using a paired design and adopting methods from the analysis of fluctuating asymmetry, we describe methods for auditory researchers interested in delineating auditory asymmetries and comparing tuning curves, behavioral or neural. We illustrate the methods using audiograms of the prothoracic T-cell interneuron in a nocturnal katydid (Neoconocephalus ensiger). The results show that 87–92 % of T-cells had right-minus-left threshold asymmetries no larger than expected from measurement error alone. Thus, apart from small random fluctuating asymmetries, T-cell pairs in N. ensiger showed no sensory bias and were bilaterally symmetrical from 5 to 100 kHz. The sensitivity of the methods for detecting tuning curve dissimilarities was confirmed in a sound lateralization paradigm by
comparing the ‘symmetry’ (i.e. similarity) of T-cell tuning curves measured at 0 ° stimulation with tuning curves measured at 90 ° stimulation for the same T-cell. The results show that T-cell thresholds measured frontally (0 °) were significantly higher than those measured laterally (90 °), particularly for ultrasonic frequencies. Statistically, the directional shift (increase) in auditory thresholds was detected as a directional asymmetry in T-cell tuning, whose origin and functional significance to an insect behaving normally are discussed. The paper discusses practical considerations for detecting auditory asymmetries and tuning curve dissimilarities in general, and closes by questioning the relevance of auditory symmetry for sound localization in both vertebrates and insects.
Key words: audition, katydid, hearing, insect, Neoconocephalus ensiger, neurophysiology, Orthoptera, Tettigoniidae, sound localization, tuning curve, ultrasound.
Summary
Introduction
AUDITORY SYMMETRY ANALYSIS
PAUL A. FAURE*,‡ ANDRONALD R. HOY
Section of Neurobiology and Behavior, Cornell University, Seeley G. Mudd Hall, Ithaca, NY 14853-2702, USA *Present address: Department of Psychology, University of Washington, Guthrie Hall, Box 351525, Seattle, WA 98195-1525, USA
‡Author for correspondence (e-mail: [email protected])
that are normally distributed about a mean difference significantly greater or less than zero. Antisymmetry is similar to directional asymmetry in that a developmental bias exists, but the direction of the bias is variable between individuals. Antisymmetry is characterized by broad-peaked (platykurtic) or bimodal departures from normality in the distribution of R–L differences about a mean trait difference of zero.
Morphological and functional asymmetries and lateralizations, particularly in the nervous system, are found throughout the animal kingdom (see Harnad et al., 1977; Bianki, 1988), but are obvious and common in three major groups: the teleost fishes (e.g. flatfish metamorphosis), the gastropod molluscs (e.g. visceral torsion) and the decapod crustaceans (e.g. heterochely) (Neville, 1976; Chapple, 1977). Nevertheless, insects possess functional asymmetries. Examples include the mandibles of snapping soldier termites (Pericapritermes sp.) in which only the enlarged left mandible is used to deliver a stunning blow while striking at other insects (Wilson, 1971), the asymmetric genitalia of certain Drosophila (Morgan, 1977) and Chrysotoxum (hover fly) species (Neville, 1976) and the asymmetric anatomy and movements of the forewings (tegmina) in singing Orthoptera (Dumortier, 1963; Bennet-Clark, 1989; Ewing, 1989; Simmons and Ritchie, 1996). In the Portuguese cicada Tympanistalna gastrica, an asymmetry exists in sound output between the right and left tymbals which is related to their morphology and sequence of activation (Fonseca and Bennet-Clark, 1998). In the water bug Corixa punctata, the left tympanic organ is consistently more sensitive to higher frequencies than the right, a finding confirmed by electrophysiology and laser vibrometry (Prager, 1976; Prager and Larsen, 1981). Here, the asymmetry appears to be an adaptation accommodating resonance frequency changes that occur in the physical gill and air bubble during cycles of respiratory diving (Prager and Streng, 1981, 1982).
Insect auditory systems seem especially well-suited for symmetry analysis because directional information in the location of sounds is presumed to be encoded in spike differences between left/right pairs of auditory neurons (Boyan, 1979; Mörchen, 1980; Rheinlaender and Römer, 1980). Boyan (1979) found that 83 % of Teleogryllus commodus had inherent left/right asymmetric spiking responses in the S and L auditory neurons. Working on a prominent auditory interneuron in the central nervous system of the European bushcricket Tettigonia viridissima, Rheinlaender and Römer (1980) found that 53 % of T-cell pairs were bilaterally asymmetric in that thresholds did not show a total congruence between 5 and 40 kHz, particularly above 20 kHz and below 12 kHz. The authors attributed such T-cell threshold asymmetries to the loss of function in single primary afferents, rather than to asymmetric synaptic processes, and concluded that auditory symmetry was guaranteed only within a limited spectral band coinciding with the peak frequencies of conspecific song.
If one assumes that the accuracy of sound localization and phonotactic discrimination is correlated with the degree of auditory symmetry, as previous researchers of the acoustic
Orthoptera have (e.g. Murphey and Zaretsky, 1972; Bailey and Thomson, 1977; Rheinlaender and Römer, 1980; Wendler et al., 1980; Römer and Krusch, 2000), then natural selection should favor high levels of peripheral and central auditory symmetry. If true, then the large proportion of auditory asymmetries reported by Boyan (1979) and Rheinlaender and Römer (1980) is striking, particularly for the T-cell interneuron, whose responses are considered important for sound localization (Rheinlaender et al., 1986) and predator avoidance behavior (Römer et al., 1988; Libersat and Hoy, 1991; Mason et al., 1998; Faure, 1999; Faure and Hoy, 2000a–c).
To the best of our knowledge, there are no established quantitative methods in the hearing sciences for measuring and detecting auditory asymmetries and tuning curve dissimilarities. Hence, one goal of the present paper is to show that quantitative methods exist for comparing the similarity of two tuning curves (audiograms), behavioral or neural. We adopt statistical methods developed for the analysis of fluctuating asymmetry (Van Valen, 1962; Palmer and Strobeck, 1986; Swaddle et al., 1994; Merilä and Björklund, 1995) to re-examine auditory asymmetry in the katydid T-cell (Rheinlaender and Römer, 1980). We make no claim to the definitive nature of these methods, merely that they are more objective than the criteria employed previously. Using these methods, we show that left/right T-cell threshold asymmetries in a North American tettigoniid (Neoconocephalus ensiger) are no larger than expected from measurement error alone; hence, except for small random fluctuating asymmetries, T-cell tuning curves show no sensory bias and are, therefore, bilaterally symmetrical. The sensitivity of the methods for detecting departures from symmetry was confirmed by comparing the similarity of T-cell tuning curves in a sound lateralization paradigm: T-cell thresholds measured with a loudspeaker positioned at 0 ° were significantly higher than thresholds measured at 90 ° for the same T-cell. Statistically, this was detected as a directional shift (i.e. a directional asymmetry) in the threshold tuning curve of the T-cell, primarily at ultrasonic frequencies. The paper closes by discussing practical considerations of auditory symmetry analysis and concludes by questioning the relevance of auditory symmetry for sound localization in both vertebrates and insects.
Materials and methods
Acoustic stimulation and calibration
Electrophysiological recordings were made inside a 1.1 m×0.6 5 m×0.65 m (length×width×height) chamber lined with sound-attenuating foam (Sonex). Average chamber temperature was 24.1±0.8 °C. Pure-tone pulses (2–100 kHz) with 1 ms linear or raised cosine rise/fall times were produced either by a custom-made sine-wave generator and pulse-shaper circuitry (analog) controlled by an AMPI Master-8 pulse generator or by a computer with an array processor and A-to-D/D-to-A interface purchased from Tucker Davis Technologies (TDT: Apos II).
All sounds were broadcast through an ESS or Panasonic EAS-10TH400B leaf tweeter located approximately 33 cm from the insect preparation. Sound levels, measured with a Brüel & Kjær (B&K) type 2209 impulse precision sound level meter and type 4135 1/4 inch condenser microphone (flat ±3 dB from 20 Hz to 125 kHz without protecting grid; diaphragm 0 ° incidence) and calibrated with a B&K type 4220 pistonphone, are expressed in decibels sound pressure level (dB SPL rms re: 20µPa) equivalent to the peak amplitude of continuous tones of the same carrier frequency (Stapells et al., 1982). Amplitudes were adjusted using a programmable attenuator (TDT: PA4) and stereo amplifier (Nikko NA-790). The magnetic base of our custom-made insect holder allowed for visual positioning of katydids at one of two loudspeaker positions relative to the mid-sagittal body axis (anterior 0 °; lateral 90 °). Ipsilateral refers to the ear and prothoracic auditory spiracle closest to the loudspeaker at 90 ° (at 0 °, both ears are approximately the same distance from the loudspeaker, so there is no ipsilateral side, only a recording side). Calibration curves at 90 ° were constructed for the left and right sides of the insect holder by placing the type 4135 microphone (no grid; 0 ° incidence) at the approximate location of the ipsilateral auditory spiracle; for calibration curves at 0 °, the microphone was placed beside the opening of the left and right prothoracic auditory spiracles of a dead katydid. An example calibration curve is shown in Fig. 1.
Tuning curve analysis
T-cell spikes are large and conspicuous in extracellular recordings and are amenable to quantitative analyses, so all physiological data were collected using this technique. Threshold determination was on-line (resolution 0.5 dB) and was defined as the minimum dB SPL required to elicit one T-cell spike in four out of five consecutive stimulus presentations using 10 ms tones presented once per second. (Note that, when stimulating at 90 °, the contralateral T-cell is below the threshold of the ipsilateral T-cell; see also Rheinlaender and Römer, 1980.) Most experiments used a paired design, and threshold determination was semi-blind, i.e. T-cell thresholds measured at one loudspeaker position were hidden from view before determining thresholds for the other T-cell or loudspeaker position. The variables extracted from tuning curves were: (i) best frequency (BF, kHz), the frequency of maximum sensitivity (lowest threshold) for the entire tuning curve, also known as the best excitatory frequency; (ii) best threshold (BT, dB SPL), the threshold of a neuron at its best frequency; and (iii) the Q value (no units), which is the tuning quality factor of a neuron, an indicator of frequency selectivity or tuning sharpness: Q10dB=(best frequency)/(tuning curve
bandwidth at +10 dB re: best threshold). Q values of ⭐1 indicate broad tuning, and Q values >1 indicate narrow tuning.
[image:3.612.123.559.68.266.2]Auditory symmetry and tuning curve similarity analysis To compare threshold tuning curves for the left and right T-cells, we employed methods established for the measurement and analysis of fluctuating asymmetry (Palmer and Strobeck, 1986; Swaddle et al., 1994, 1995; Merilä and Björklund, 1995). As a check on the sensitivity of these methods, we also compared the ‘symmetry’ (i.e. similarity) of T-cell thresholds measured in a sound lateralization paradigm. That is, we compared T-cell thresholds measured at 90 ° with thresholds measured at 0 ° for the same T-cell. Preliminary experiments revealed that, when the position of the loudspeaker changed Fig. 1. Example calibration curves for
the left (L) and right (R) sides of the insect holder for loudspeaker positions of 90 °L and 90 °R (A) and 0 °L and 0 °R (B). In each panel, the shaded area represents the calibration difference function (∆dB=L−R). At 90 °, the calibration curves were constructed by placing a B&K type 4135 microphone (no grid; 0 ° incidence) at the approximate location of the prothoracic auditory spiracles of the katydid, whereas at 0 ° the microphone was placed beside the opening of the
auditory spiracles in a dead animal. Values are plotted relative to the maximum sound pressure level (SPL) in each panel: 115 dB SPL at 10 kHz (A; 90 °R) and 117 dB SPL at 12 kHz (B; 0 °R).
-5 0 5
∆
dB
2 5 10 2 5 100
Frequency (kHz) -30
-24 -18 -12 -6 0
Relati
v
e amplitude
(dB)
90°L 90°R
A
-5 0 5
2 5 10 2 5 100
Frequency (kHz) -30
-24 -18 -12 -6
0 0°L
0°R
from 90 to 0 °, there was a consistent increase in T-cell threshold. Statistically, this directional increase will be detected as a directional asymmetry. Checks for antisymmetry were performed using both graphical and statistical methods, but none was found. We also checked for scaling effects to ensure that threshold differences (∆dB) did not vary as a function of absolute threshold; because size scaling was not a problem, data normalization was deemed unnecessary, e.g. ∆dB=(R−L)/[(R+L)/2], where L is the threshold of the left T-cell and R is the threshold of the right T-T-cell.
Measurement error
We first tested to ensure that any observed variation was greater than that attributable to measurement error (ME) alone (Merilä and Björklund, 1995; Swaddle et al., 1995; Palmer, 1996). Variation in measuring threshold differences (∆dB) is most properly estimated using a mixed-model analysis of variance (ANOVA) with repeated measures from each side and/or loudspeaker position (Palmer and Strobeck, 1986; Swaddle et al., 1994). However, the logistics of electrophysiology did not permit threshold re-testing at each frequency in all individuals. Measurement error was therefore estimated from the repeatability of 33 thresholds measured twice from the same side at varying frequencies (N=9 katydids). The mean ± standard deviation (S.D.) of ∆dB ME was 0.2±1.9 dB, the variance of ∆dB ME (σ2∆
dB) was 3.5 dB2
and the mean ± S.D. |∆dB| between the first and second threshold estimate was 1.4±1.2 dB. To determine whether T-cell threshold asymmetries were significantly larger than asymmetries attributable to measurement error alone (see below) for the ∆dB data, we compared the distribution or ranks of threshold difference ∆dBs against the distribution or ranks of measurement error ∆dBs using an unpaired t-test or Mann–Whitney U-test. For |∆dB| data, the extent of measurement error was conservatively removed by subtracting the mean |∆dB| ME value +2 S.D. (thus |∆dB| ME=3.8 dB) before scoring asymmetric individuals (see below).
A number of tests were used to compare the symmetry (similarity) of tuning curves within and among individuals, across frequencies and for the two loudspeaker positions. Individual symmetry
Comparing the distribution of signed threshold differences (∆dB=right-minus-left T-cell threshold) between two tuning curves across all frequencies against an expected normal distribution with a mean of zero is a test of whether the observed distribution represents independent random samples with a mean ∆dB of zero. A significant difference indicates a directional asymmetry. However, because tuning curves are measured within an individual, and because of the tonotopic arrangement of the katydid tympanal hearing organ (for a review, see Oldfield, 1988), T-cell thresholds measured at frequency i (fi) are undoubtedly related to thresholds at
neighboring fivalues (which is a violation of the assumption
of independence; Zar, 1984). Hence, detecting a significant difference does not allow one to conclude whether the
asymmetry arose independently and similarly at each fivalue
(which is an unlikely occurrence) or is due to the influence of neighboring fivalues (which is likely). A significant difference
does, however, indicate that a directional asymmetry exists, regardless of its origin, and is valid within an individual. Within-individual ∆dBs were first tested to ensure that the observed variation was greater than measurement error variation (see Measurement error). When determining the number of katydids with T-cell threshold asymmetries, all P-values were corrected for multiple simultaneous contrasts (see Statistical analyses). A similar analysis was conducted when comparing the similarity (symmetry) of T-cell tuning curves measured at 0 ° and 90 ° in the sound lateralization paradigm. Frequency symmetry
Testing the distribution of signed ∆dBs at frequency i for all individuals against an expected normal distribution with a mean of zero is a test of whether the observed distribution represents random independent samples of ∆dBs at fiwith a
mean ∆dB of zero. A significant difference indicates that a directional tuning asymmetry exists at fi for the entire
population. Repeating the analysis for each fi value and
adjusting for multiple contrasts allows one to examine directional asymmetry as a function of stimulus frequency. Because the data within each test are independent, this comparison is not subject to the restricted conclusions of the individual symmetry test (above). Data were first tested to ensure that variation in ∆dB at each fivalue was greater than
measurement error variation. A similar analysis was conducted when comparing the similarity (symmetry) of T-cell tuning curves measured at 0 ° and 90 ° in the sound lateralization paradigm.
Absolute value of auditory symmetry
To determine the amount of absolute auditory asymmetry for each individual, we calculated an average unsigned threshold difference (|∆dB|=|R−L|) across all fi values within
an individual before applying the following criterion: any individual with a mean |∆dB| >3 dB was scored as being asymmetric. In theory, the expected distribution of |∆dB| is half-normal (assuming no measurement error); however, given that measurement error in symmetry studies is often surprisingly high (Merilä and Björklund, 1995), the distribution of |∆dB| will be positively skewed. The effects of measurement error were conservatively removed by subtracting |∆dB| ME (see Measurement error) from the mean |∆dB| for each individual before applying the above asymmetry criterion. A similar analysis was conducted when comparing the similarity (symmetry) of T-cell tuning curves measured at 0 ° and 90 ° in the sound lateralization paradigm.
Population-wide symmetry
In this analysis, data from both sexes and loudspeaker positions were combined. Signed ∆dBs across all fivalues were
individuals represents a random sample of independent ∆dBs with a mean ∆dB of zero. A significant difference indicates a population-wide directional tuning asymmetry. Again, data were tested to ensure that variation in ∆dB was greater than variation in measurement error. A similar analysis was conducted when comparing the similarity (symmetry) of T-cell tuning curves measured at 0 ° and 90 ° in the sound lateralization paradigm.
Statistical analyses
Data are reported as the mean ±S.D. and were first tested for normality and equality of variances (Shapiro and Wilk, 1965; Zar, 1984); non-normal or heteroscedastic data were subsequently analyzed with an equivalent non-parametric test (Statview). Because some sex-specific differences in the tuning and physiology of the T-cell exist (see Faure and Hoy, 2000b,c), results from males and females are presented separately. All statistical tests employ a comparison-wise error rate of α⭐0.05. In cases with multiple simultaneous comparisons, sequential Bonferroni adjustments were applied to P-values from related tests to maintain an experiment-wise error rate of α⭐0.05 (Rice, 1989).
Results
Auditory symmetry and tuning curve similarity analysis Individual symmetry
Of 32 male T-cells tested with the loudspeaker positioned at 90 ° (N=24) or at 0 ° (N=8), only three exhibited variation in R–L threshold differences (∆dBs) that was significantly greater than variation due to measurement error alone: all three were directionally asymmetric at 90 °. That is, their ∆dB functions differed significantly from a normal distribution with an average ∆dB of zero. Of 16 female T-cells tested at 90 ° (N=9) or at 0 ° (N=7), again only three showed ∆dB asymmetry above measurement error asymmetry: two were directionally asymmetric at 90 ° and one at 0 °. When the results from males and females were combined and re-analyzed, six of the 48 T-cell pairs (12.5 %) displayed R–L asymmetries greater than measurement error asymmetry, with all six being directionally asymmetric. So, although small random fluctuating threshold asymmetries were present in every katydid (average male ∆dB at 90 °, 1.0±3.4 dB, N=24; male ∆dB at 0 °, −0.1±1.7 dB, N=8; female ∆dB at 90 °, −0.9±2.1 dB, N=9; female ∆dB at 0 °, −0.7±1.9 dB, N=7), 87.5 % of left/right T-cell pairs did not exhibit asymmetry significantly different from measurement error asymmetry.
A very different result was obtained when the same analysis was performed on T-cell thresholds measured at 90 ° and then again at 0 ° for the same T-cell in the sound lateralization paradigm. Of 33 male and 16 female T-cells measured at both 90 ° and 0 ° on the same side of the body, 46 of the 49 comparisons (30 male, 16 female) had 0–90 °∆dB functions that differed significantly from a function with an average ∆dB of zero (note that this variation was also significantly greater than measurement error variation). Thus, 93.9 % of T-cells showed significant directional threshold shifts, which statistically were
detected as a directional asymmetry, when the loudspeaker moved from 90 to 0 ° in the sound lateralization paradigm. Frequency symmetry
Fig. 2 shows the average left and right T-cell tuning curves for adult males stimulated at 90 ° (Fig. 2A, top) and 0 ° (Fig. 2B, top), with the corresponding average threshold difference function (Fig. 2A,B bottom). As is evident, R–L threshold differences were small, with no obvious tuning enhancements or deficits at any particular frequency. For example, at 90 °, only three of 25 carrier frequencies tested (10, 80 and 85 kHz) had directional threshold asymmetries that differed from the distribution of measurement error asymmetries (see asterisks in Fig. 2A,B bottom); however, variation in ∆dB for the remaining 22 stimulus frequencies (87.5 %) was no greater than measurement error variation. At 0 °, none of the threshold differences was statistically significant at any of the carrier frequencies tested. Together, the results demonstrate that T-cell bilateral thresholds are symmetrical and that threshold differences do not vary as a function of stimulus frequency.
Although symmetrical tuning was the norm when examining left/right T-cell bilateral pairs, this was not so when T-cell thresholds measured frontally (0 °) were compared with thresholds measured laterally (90 °) for the same T-cell in the sound lateralization paradigm. Thresholds measured at 0 ° were significantly higher than those measured at 90 ° and, not surprisingly, this was true for both the left (Fig. 2C) and right (Fig. 2D) T-cells. That is, the directional threshold shift from 90 to 0 ° was bilaterally symmetrical. Examination of the 0–90 ° ∆dB functions reveals significant directional threshold asymmetries over a broad spectrum, with the largest and most consistent differences occurring at ultrasonic frequencies (Fig. 2C,D). Quantitatively, this was verified by comparing ∆dBs across all individuals within isofrequency bands; maximum lateralization effects occurred primarily at frequencies ⭓20 kHz. When the results from the right and left sides were combined, the most consistent differences occurred for frequencies between 40 and 80 kHz, and to a lesser extent between 17 and 30 kHz (compare asterisks in Fig. 2C,D).
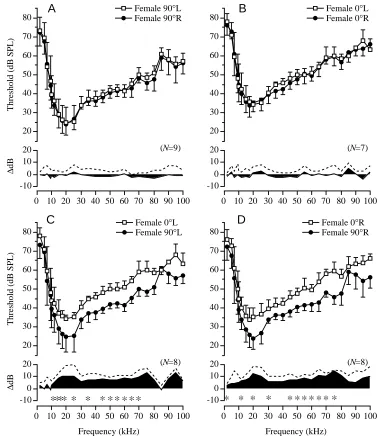
As in males, T-cell thresholds in female N. ensiger showed nearly perfect bilateral symmetry for stimulation at either 90 ° or 0 °. The absence of asterisks below the female ∆dB functions (Fig. 3A,B) indicates that bilateral threshold differences were not significantly greater than measurement error variation. When 90 ° thresholds were compared with 0 ° thresholds for the same T-cell (Fig. 3C,D; sound lateralization paradigm), significant directional threshold asymmetries similar to those found in males were again observed, with the most consistent band of threshold differences occurring between 45 and 75 kHz, but also near 20 kHz.
Absolute value of auditory symmetry
assessing departures from symmetry. The distribution of the average |∆dB| for all katydids in the bilateral symmetry experiment is shown in Table 1. Before accounting for measurement error, 41 of 48 (85.4 %) left/right T-cell pairs averaged ⭐6 dB and 11 of 48 (22.9 %) averaged ⭐3 dB of absolute auditory asymmetry. When the data were corrected for asymmetry due to measurement error, this resulted in only four (8.3 %) katydids having |∆dB| values greater than 3 dB, our asymmetry criterion (see Materials and methods). Thus, for most katydids (approximately 92 %), T-cell thresholds on one side of the body were within 3 dB of the bilateral counterpart.
In the sound lateralization paradigm, only 14 of 49 (28.6 %) T-cells had |0–90 °| threshold differences that were ⭐6 dB and none of 49 (0 %) had |0–90 °| threshold differences that were
⭐3 dB before accounting for tuning dissimilarities due to measurement error. Correcting for measurement error resulted in 25 of 49 T-cells (51.0 %) having |0–90 °| lateralization
threshold asymmetries greater than 3 dB. Table 2 shows the distribution of |∆dB| for all animals in the sound lateralization paradigm. Because of the large directional threshold asymmetries occurring primarily at ultrasonic frequencies (Figs 1, 2), the distribution of |∆dB| values is more positively skewed than in Table 1.
We also examined the average and maximum values of |∆dB| as a function of carrier frequency in the T-cell bilateral symmetry and sound lateralization experiments. In the case of the former experiment, no obvious or systematic relationship was found for either variable; in the case of the latter experiment, the average |∆dB| appeared to be larger at ultrasonic frequencies. This was validated by comparing the average |∆dB| for the audiosound (2–17 kHz) and ultrasound (20–100 kHz) portions of the T-cell threshold difference function (Fig. 4; males and females pooled). In the bilateral symmetry experiment, there was no significant difference in the average |∆dB| for the audiosound and ultrasound portions
(N=17) 20 10 0 -10 ∆ dB 100 90 80 70 60 50 40 30 20 10 0 Frequency (kHz) 80 70 60 50 40 30 20
Threshold (dB SPL)
Male 0°L Male 90°L
C
(N=16) 20 10 0 -10 100 90 80 70 60 50 40 30 20 10 0 Frequency (kHz) 80 70 60 50 40 30 20Male 0°R Male 90°R
D
(N=8) 20 10 0 -10 100 90 80 70 60 50 40 30 20 10 0 80 70 60 50 40 30 20Male 0°L Male 0°R
B
(N=24) 20 10 0 -10 ∆ dB 100 90 80 70 60 50 40 30 20 10 0 80 70 60 50 40 30 20Threshold (dB SPL)
Male 90°L Male 90°R
A
*
**
* *
*
*
*
*
*
*
*
*
*
*
*
*
*
*
*
*
*
*
*
*
*
*
*
*
*
*
*
*
*
*
*
*
*
Table 1. Bilateral symmetry: the average absolute value of T-cell threshold differences (|right−left|) across 25 stimulus
frequencies
Bilateral symmetry Average |∆dB|* Sex N comparison 0<2 2<4 4<6 >6
Male 24 90 °L versus 90 °R 19 3 0 2
8 0 °L versus 0 °R 5 2 1 0
Female 9 90 °L versus 90 °R 8 1 0 0
7 0 °L versus 0 °R 7 0 0 0
Total 48 Left versus right 81.3 % 12.5 % 2.1 % 4.2 %
*Values corrected for measurement error (ME), |∆dB| ME=3.8 dB. N, number of adult katydids tested.
L, left; R, right.
Table 2. Sound lateralization: the average absolute value of T-cell threshold differences (|0−90 °|) across 25 stimulus
frequencies
Speaker position Average |∆dB|* Sex N comparison 0<2 2<4 4<6 >6
Male 16 0 °R versus 90 °R 4 11 1 0
17 0 °L versus 90 °L 3 11 2 1
Female 8 0 °R versus 90 °R 1 1 3 3
8 0 °L versus 90 °L 2 2 4 0
Total 49 0 ° versus 90 ° 20.4 % 51.0 % 20.4 % 8.2 %
*Values corrected for measurement error (ME), |∆dB| ME=3.8 dB. N, number of adult katydids tested.
L, left; R, right. (N=8) 20
10 0 -10
∆
dB
100 90 80 70 60 50 40 30 20 10 0
Frequency (kHz) 80
70
60
50
40
30
20
Threshold (dB SPL)
Female 0°L Female 90°L
C
(N=7) 20
10 0 -10
100 90 80 70 60 50 40 30 20 10 0 80
70
60
50
40
30
20
Female 0°L Female 0°R
B
(N=9) 20
10 0 -10
∆
dB
100 90 80 70 60 50 40 30 20 10 0 80
70
60
50
40
30
20
Threshold (dB SPL)
Female 90°L Female 90°R
A
20 10 0 -10
100 90 80 70 60 50 40 30 20 10 0
Frequency (kHz) 80
70
60
50
40
30
20
Female 0°R Female 90°R
(N=8)
D
[image:7.612.189.567.70.506.2]**** * * * ** * **
* * * *
* ** * ** *
of the T-cell tuning curve (Fig. 4A,B); in the sound lateralization experiment, ultrasound |∆dBs| were significantly larger than audiosound |∆dBs| (Fig. 4C,D). This confirms the results reported above.
Population-wide symmetry
The distribution of individual average ∆dBs across all frequencies in the bilateral symmetry experiment initially differed from a normal distribution (W=0.826, N=48, P<0.01; Shapiro and Wilk, 1965), suggesting that antisymmetry was present in the katydid population. However, closer inspection revealed that this non-normality was due to the influence of two outliers (i.e. two katydids with highly asymmetric left/right T-cells, Table 1), to which the Shapiro–Wilk statistic is known to be sensitive (Shapiro and Wilk, 1965); subsequent re-analysis excluding these two katydids confirmed that average ∆dBs in the remaining population were normally distributed (W=0.967, N=46, 0.10<P<0.5), thus refuting the previous notion of antisymmetry. In addition, the mean average ∆dB did not differ from a population with a mean ∆dB of zero (t=0.470, d.f.=47, P=0.6406), so no directional asymmetry was present. In fact, population-wide ∆dBs did not differ significantly from the distribution of measurement error ∆dBs (z=−0.490, N1=33, N2=48, P=0.6240), indicating that average
threshold asymmetries for all katydids were well within the values expected from measurement error alone. Table 3 summarizes the results of paired comparisons performed on standard tuning curve variables (i.e. best frequency, best threshold or Q10dB; see Materials and methods for definitions).
12
8
4
0
Threshold dif
ference (|
∆
dB|)
Audio Ultra 90°R−90°L N=33 P=0.4423
A
12
8
4
0
Audio Ultra N=25 P=0.0002
C
12
8
4
0
Audio Ultra N=15 P=0.2114
B
12
8
4
0
Audio Ultra N=24 P=0.0004
D
0°R−0°L
[image:8.612.56.284.73.308.2]0°R−90°R 0°L−90°L
Table 3. Summary data for the T-cell bilateral symmetry experiment in male and female Neoconocephalus ensiger (paired design) Bilateral symmetry
Tuning variable comparison Left T-cell Right T-cell P*
Male (N=24)
BF (kHz) 90 ° versus 90 ° 30.6±11.6 29.7±14.6 0.6578
BT (dB) 90 ° versus 90 ° 32.2±5.3 33.5±4.2 0.1975
Q10dB 90 ° versus 90 ° 0.997±0.497 0.994±0.609 0.9664
Male (N=8)
BF (kHz) 0 ° versus 0 ° 24.7±5.7 27.5±10.7 0.2932
BT (dB) 0 ° versus 0 ° 39.8±1.9 39.7±1.6 0.9561
Q10dB 0 ° versus 0 ° 0.776±0.413 0.766±0.418 0.9211
Female (N=9)
BF (kHz) 90 ° versus 90 ° 22.2±3.6 20.8±2.6 0.2961
BT (dB) 90 ° versus 90 ° 22.9±6.9 23.3±5.9 0.5975
Q10dB 90 ° versus 90 ° 1.104±0.389 1.030±0.467 0.4505
Female (N=7)
BF (kHz) 0 ° versus 0 ° 18.9±4.5 20.6±3.3 0.3693
BT (dB) 0 ° versus 0 ° 32.4±1.9 31.6±5.6 0.8658
Q10dB 0 ° versus 0 ° 0.945±0.351 1.315±1.003 0.6002
*Paired t-test or Wilcoxon signed-rank test.
Values are the mean ±S.D. best frequency (BF), best threshold (BT) and tuning quality factor (Q10dB) for the left and the right T-cell when the loudspeaker was positioned at 90 ° or at 0 °.
[image:8.612.43.561.454.678.2]N is the number of individual katydids measured. L, left; R, right.
As is evident, no significant population-wide asymmetries, other than fluctuating asymmetries no larger than measurement error, were present.
Population-wide ∆dBs in the sound lateralization experiment were, however, larger than the distribution of measurement error ∆dBs (t=−14.2, d.f.=80, P<0.0001), indicating that the increase in T-cell thresholds (i.e. the directional threshold asymmetry) when the loudspeaker moved from 90 to 0 ° was larger than expected from variation due to measurement error alone. The distribution of ∆dBs in the sound lateralization experiment did not differ significantly from a normal distribution (W=0.985, N=49, P=0.90), so no antisymmetry was present. However, the mean population ∆dB was significantly greater than a mean ∆dB of zero (t=23.7, d.f.=48, P<0.0001), which was expected because of the threshold shift observed in 94 % of katydids in the sound lateralization experiment. Table 4 summarizes the results of paired comparisons performed on the best frequency, best threshold and Q10dB data for the sound lateralization
experiment. Note the consistent increase in the best threshold of the T-cell, from 5 to 10 dB in both sexes, whenever the loudspeaker moved from 90 to 0 °.
Discussion T-cell bilateral symmetry
Unlike the study on the European bushcricket Tettigonia viridissima (Rheinlaender and Römer, 1980), we found no evidence supporting high levels of population-wide T-cell
threshold asymmetries in the North American katydid Neoconocephalus ensiger. Except for fluctuating asymmetries with magnitudes no larger than measurement error, 87–92 % of individual T-cell pairs were bilaterally symmetrical and showed no sensory bias. Furthermore, auditory symmetry was conferred across the entire T-cell tuning curve and was not restricted to the frequency spectrum coincident with the song of N. ensiger.
[image:9.612.52.566.88.310.2]A number of differences between the two studies could account for the discrepancy in T-cell bilateral asymmetry estimates. First, because Rheinlaender and Römer (1980) did not account for measurement error, asymmetry was undoubtedly overestimated. Measurement error accounts for 10–76 % of non-directional asymmetry (Palmer and Strobeck, 1986) and can introduce significant asymmetry even when none exists and/or when the accuracy of the original measurements is high (Merilä and Björklund, 1995). Even less than ideal estimates of measurement error, such as that employed in this study, are better than none at all. Not accounting for measurement error in no way implies that Rheinlaender and Römer (1980) did not measure T-cell thresholds accurately (indeed, the authors state that any katydid whose T-cell differed by more than 2 dB from its original threshold estimate was excluded from their analysis; N=1), it just means that asymmetry due to intrathreshold measurement variability cannot be partitioned from true auditory asymmetry. The fact that even one animal was omitted for failing to meet the 2 dB criterion indicates that measurement error can exceed 2 dB even under highly controlled acoustic conditions. Table 4. Summary data for the T-cell sound lateralization experiment in male and female Neoconocephalus ensiger (paired design)
Speaker position
Tuning variable comparison T-cell at 90 ° T-cell at 0 ° P*
Male (N=17)
BF (kHz) 90 °L versus 0 °L 27.7±8.5 24.6±4.9 0.0560
BT (dB) 90 °L versus 0 °L 30.4±4.0 38.0±2.5 <0.0001
Q10dB 90 °L versus 0 °L 1.070±0.529 0.788±0.320 0.0993
Male (N=16)
BF (kHz) 90 °R versus 0 °R 30.0±15.2 24.0±8.7 0.0892
BT (dB) 90 °R versus 0 °R 34.1±4.1 39.3±4.2 <0.0001
Q10dB 90 °R versus 0 °R 0.973±0.728 0.838±0.437 0.4950
Female (N=8)
BF (kHz) 90 °L versus 0 °L 21.3±3.5 19.1±4.2 0.1334
BT (dB) 90 °L versus 0 °L 22.4±7.2 32.8±2.1 0.0117
Q10dB 90 °L versus 0 °L 1.141±0.401 0.921±0.332 0.3358
Female (N=8)
BF (kHz) 90 °R versus 0 °R 20.3±2.2 20.5±3.1 0.7560
BT (dB) 90 °R versus 0 °R 22.7±6.0 31.8±5.3 0.0030
Q10dB 90 °R versus 0 °R 1.083±0.470 1.231±0.958 0.7010
*Paired t-test or Wilcoxon signed-rank test.
Values are the mean ±S.D. best frequency (BF), best threshold (BT) and tuning quality factor (Q10dB) for T-cells stimulated at 90 ° and 0 ° for the left or the right sides of the body.
Moreover, it reinforces the point that more-variable individuals should never be excluded from symmetry analyses because this results in reduced estimates of measurement error and correspondingly inflated estimates of asymmetry (Swaddle et al., 1994).
Second, the two studies used different criteria for classifying asymmetric individuals. Although not explicitly stated, the criterion used by Rheinlaender and Römer (1980), that neither threshold curve should deviate by more than 3 dB from the other, yielding a ‘total’ congruence between 5 and 40 kHz, seems overly conservative and hence predisposed towards finding asymmetry. Applying this criterion to our study results in 100 % of N. ensiger being asymmetric and, as we have shown, measurement error alone can exceed 2 or 3 dB. Third, the two studies used different species of katydid. Fourth, in the present study, T-cell thresholds were measured with the central nervous system left intact, whereas Rheinlaender and Römer (1980) cut the connectives posterior to the subesophageal ganglion. Cutting the ventral nerve cord reduces noise from descending neural activity, but doing so severs both T-cell axons and leaves open the (unlikely) possibility that asymmetries arose because of injury artifacts.
T-cell sound lateralization
As expected from previous studies of directional hearing in katydids (Suga and Katsuki, 1961a,b; Suga, 1963; Rheinlaender et al., 1986; Michelsen et al., 1994), T-cell thresholds at 0 ° were consistently higher than those measured at 90 °. In addition, lateralization effects were most pronounced at ultrasonic frequencies above the peak frequency of the calling song of N. ensiger (Figs 2–4). This result agrees with that of Rheinlaender and Römer (1980), who found that directional coding in the T-cell of T. viridissima was optimal at ultrasonic frequencies, whereas stimulation at the calling song peak frequency was less effective.
When stimulating the ipsilateral T-cell at threshold at 90 °, the contralateral tympanic organ and T-cell are normally subthreshold, particularly for ultrasonic frequencies. This occurs because sound waves are diffracted by the body of the katydid, creating a sound shadow with reduced sound pressure levels at the contralateral ear and auditory spiracle. Diffraction effects are maximized at frequencies with wavelengths less than or equal to (approximately) the size of the diffracting object, so for very small animals such as insects, diffraction phenomena occur principally at ultrasonic frequencies (Michelsen, 1992). Ultrasonic stimulation of the ipsilateral ear and T-cell at threshold at 90 ° therefore results in little excitatory binaural input into the central nervous system from the contralateral side.
In contrast, when stimulating at threshold at 0 °, both tympanic organs receive more-or-less equal sound pressure levels, so both the left and right T-cells will be near threshold. It is known that auditory input originating from the ipsilateral tympanic organ has a strong inhibitory influence on contralateral T-cell spiking (Suga and Katsuki, 1961a,b). Thus, when recording T-cell responses at 0 °, neuronal inhibition
originating from the opposite ear will cause thresholds in the recorded T-cell to rise. This mechanism, combined with the more efficient transmission of acoustic energy into the auditory spiracle at 90 ° than at 0 ° (Michelsen et al., 1994), accounts for the observed directional threshold shift (directional asymmetry) when thresholds at 0 ° were compared with thresholds at 90 ° for the same T-cell (Figs 2C,D, 3C,D). That such threshold shifts are due to transmission, diffraction and binaural inhibition effects and not to inhomogeneities in the sound field is supported by three lines of evidence. (i) Independent calibration curves measured at 90 ° and at 0 ° (Fig. 1) revealed only small inhomogeneities between the left and right sides. (ii) The average difference in sound pressure level at 0 ° and 90 ° for the same side was also small (compare Fig. 1A,B) and was within our estimate of measurement error. For example, in Fig. 1 the average difference in sound pressure level across the 25 carrier frequencies for stimulation at 0 ° versus 90 ° was 0 °R−90 °R, 1.8±2.1 dB; 0 °L−90 °L, 1.4±1.7 dB; left and right sides pooled, 1.6±1.9 dB. (iii) Only fluctuating asymmetries no larger than measurement error were measured during bilateral threshold testing, which serves as an independent control on the homogeneity of the sound field: any inhomogeneities that existed would not be expected to occur symmetrically.
Detecting auditory symmetry
Criticisms on the overuse and interpretative value of tuning curves in understanding central auditory function have recently and correctly been expressed (Capranica, 1992; Schwartz and Gerhardt, 1998). Nevertheless, tuning curves still provide valuable and pertinent information. Standard tuning measures such as best frequency, best threshold, QxdBand the slope of the tuning skirt stem principally from electrical engineering descriptions of resonant filter circuits (Capranica, 1992). In the present study, both standard and non-standard measures were used to compare tuning curves between left and right T-cell pairs and between frontal (0 °) versus lateral (90 °) stimulation for the same T-cell. Future auditory symmetry and/or tuning curve similarity studies may wish to consider another non-standard tuning variable: the threshold difference variance (σ2∆
dB) (see Palmer and Strobeck, 1986). Combined with
superthreshold physiology experiments (see Faure and Hoy, 2000b,c), tuning curves still provide a meaningful way to understand behaviorally and ecologically relevant auditory processing. It therefore seems premature to disregard their use as a tool in auditory research.
values of ∆dB, σ2∆
dBand |∆dB| are all correspondingly small.
The distribution of ∆dB is neither platykurtic (broad-peaked) nor bimodal, and it does not differ from a normal distribution with a mean ∆dB of zero (i.e. no antisymmetry or directional asymmetry). This leads to the conclusion that tuning is symmetrical (similar). In most instances, this is the null expectation. Standard variables such as best frequency, best threshold and Q value have the disadvantage that they can only be used on population-wide tuning curve data, whereas some asymmetry techniques employed in the present study allow for tuning comparisons within an individual. Fig. 5B–I illustrates various tuning asymmetries. The obvious asymmetry in Fig. 5B is readily detected by examining σ2∆
dB or the
distribution and mean of |∆dB|. The zigzag curve in Fig. 5C illustrates a type of antisymmetry. In this case, the best frequencies (and possibly the Q value) indicate no difference, but σ2∆
dBand the average |∆dB| both reveal an asymmetry that
would be confirmed by testing the distribution of ∆dB for normality. Fig. 5D shows a threshold offset that would be detected as a directional asymmetry. Note how there is no difference in best frequency or Q value, but only in best threshold. By itself, however, a difference in best threshold is an ambiguous marker for the type of asymmetry, as demonstrated by Fig. 5B–D,H. And while |∆dB| and σ2∆
dBare
both large, testing the distribution of ∆dB against a distribution with a mean ∆dB of zero confirms the directional asymmetry, and testing the average ∆dB from all individuals for normality checks for population-wide antisymmetry. Fig. 5E illustrates a
best frequency asymmetry similar to that seen in the T-cell of male and female N. ensiger (Tables 3, 4; Faure and Hoy, 2000b), an asymmetry that proved useful when interpreting the results from acoustic playback experiments (Faure and Hoy, 2000c). Fig. 5F also shows a change in best frequency, but with the entire tuning curve shifted in the frequency domain (similar to the left/right asymmetry in the water bug Corixa punctata; Prager and Larsen, 1981). No difference in best threshold or Q value exists, but the values of |∆dB| and σ2∆
dB
are conspicuous markers that an asymmetry is present. Fig. 5G–I gives examples of low-, band- and high-frequency directional threshold asymmetries, all with the same best frequency, and reinforces why testing the mean and distribution of ∆dB is both an important and a useful procedure. Of course, statistical testing is no substitute for simply plotting one’s tuning curve data. Not only is this a necessary first step, but it obviates the choice of tuning variables that best reveal any asymmetry patterns that exist.
The relevance of auditory symmetry
Why study auditory symmetry? What can symmetry analysis tell us about auditory development and function and about organismal fitness? Such questions are difficult to answer, but they merit further speculation. Symmetry analysis is informative because departures from symmetry can reveal specialized trait functions (e.g. Norberg, 1977; Prager and Larsen, 1981; Cranford, 1999). The directional threshold asymmetry observed in the sound lateralization experiment suggests that one function of the katydid T-cell is to lateralize high-frequency sounds, which supports previous ideas regarding its involvement in early-warning and escape behavior (McKay, 1969; Römer et al., 1988; Libersat and Hoy, 1991). Because the calling song of N. ensiger contains both audio and ultrasonic frequencies, there exists the possibility of confusion over the biological meaning of ultrasound (Faure and Hoy, 2000a). How the T-cell of N. ensiger responds to sounds mimicking stridulating conspecifics and echolocating bats has been addressed using pure-tone and acoustic playback experiments, the results of which are reported separately (Faure and Hoy, 2000b,c).
A more pertinent question to the present study is: do asymmetric individuals localize sounds as well as bilaterally symmetrical hearing normal individuals? Sound localization requires the nervous system to experience and associate auditory cues (spectral, amplitude, phase and/or time of arrival) with a particular location in auditory space (Fuzessery, 1986; Knudsen, 1999). Researchers of the acoustic Orthoptera often assume that the plane of neurophysiological auditory symmetry must be in register with the plane of anatomical bilateral symmetry to confer accurate sound localization (e.g. Murphey and Zaretsky, 1972; Bailey and Thomson, 1977; Wendler et al., 1980; Huber, 1987; Römer and Krusch, 2000); however, data from birds and mammals with real or imposed auditory asymmetries have shown that this assumption may be unwarranted. For example, experiments with barn owls wearing monaural ear plugs that introduce interaural time
F
I
G
A
Threshold
D
C
Frequency
H
B
[image:11.612.53.300.68.323.2]E
and intensity asymmetries demonstrate that localization performance deteriorates immediately after insertion of the plug. Over time, however, young owls adapt to their asymmetry, and localization errors decrease until accurate performance is achieved, whereas fully grown (sexually mature) adult birds do not adapt and continue to mislocalize sounds. When the plug is removed, adult owls immediately return to their previous and accurate performance, whereas immature owls experience localization errors opposite to that induced by the plug (i.e. an after-effect). Over time, young owls again improve their performance until accurate localization is restored and, surprisingly, some owls continue to decrease localization errors even beyond the critical window where adult birds no longer show asymmetry compensation (Knudsen et al., 1982, 1984; Knudsen, 1985a). Subsequent neurophysiological studies revealed that misalignments in the receptive fields of auditory-visual neurons in the optic tectum of the owl correspond roughly to localization errors measured behaviorally as a result of the occlusion (Knudsen, 1985b). A similar result has been reported for the mammalian superior colliculus. A study using ferrets reared with one ear chronically occluded showed that auditory spatial tuning and the topographic representation of auditory space adjusted to distorted binaural cues during development (King et al., 1988). Human listener studies have shown that localization and lateralization performance cannot be predicted on the basis of symmetrical tuning (Simon et al., 1994). Moreover, there is evidence that people with asymmetric-normal hearing adapt to their asymmetry in interaural intensity difference (IID) and interaural time difference (ITD) lateralization tasks. In an image-centering task using subjects with simulated hearing losses, Florentine (1976) found that, although subjects first centered tones on the basis of perceived equal loudness at the two ears, after several days of wearing an ear plug, images were centered in the same manner as by subjects with long-term conductive and cochlear hearing losses: somewhere between equal loudness and equal sound pressure level. Simon and Aleksandrovsky (1997) found that the perceived horizontal (lateral) position of the intracranial image of narrow-band noise in a graphic pointer task varied depending on the method of compensation for interaural threshold asymmetries in normal-hearing and hearing-impaired (sensorineural hearing loss) subjects: when equalizing by sensation level (level above threshold), the perceived lateral position of the stimulus was linearly dependent on the degree and direction of the asymmetry, whereas equalizing by sound pressure level showed no such dependency and produced images lateralized close to the midline. A separate but related study provides evidence for continuing recalibration of elevational (i.e. spectral) cues in human sound localization. By modifying the pinnae with form-fitting molds, Hofman et al. (1998) altered spectral cues in both ears. Although the molds initially degraded elevational (but not azimuthal) localization, subjects reacquired accurate localization performance over time. Interestingly, in contrast to the barn owl studies, there was no after-effect when the molds were removed; apparently, the
learning of new spectral cues did not interfere with previous elevational localization performance because subjects could localize sounds with both normal and modified pinnae (Hofman et al., 1998).
Taken together, the above experiments indicate (i) that early auditory experience can modify sound localization performance and the topographic representation of auditory space, particularly (but not exclusively) during a sensitive period, (ii) that sound localization is immediately impaired after receiving an auditory asymmetry or when localization cues are altered, but (iii) that, over time, the central auditory system is capable of learning its asymmetry and compensating for it, either wholly or partially, presumably by adjusting neural connections and synaptic weights. Thus, plasticity in the central nervous system is capable of modifying associations between localization cues and real targets in auditory space. These findings lead to the conclusion that, in vertebrates, the internal (neural) plane of auditory symmetry need not be centered along the external (anatomical) plane of bilateral symmetry for accurate sound localization, even though in most instances this is the default.
Returning now to insects, the relevance of auditory symmetry to sound localization has never been properly addressed. That the two are related comes from observations on the zigzag walking behavior of crickets apparently attempting to balance input to the right and left sides (as a rule of thumb, they turn towards the more strongly stimulated side) and from experiments demonstrating impaired localization in orthopterans with monaural occlusions and tympanal ablations (e.g. Murphey and Zaretsky, 1972; Bailey and Thomson, 1977; Wendler et al., 1980; Thorson et al., 1982; Schmitz et al., 1983, 1988; Bailey and Stephen, 1984; Schmitz, 1985). Waxing the posterior tympanum causes ⭓20 dB of auditory asymmetry (Huber et al., 1984) and produces immediate and obvious effects on cricket phonotaxis: females localize and also circle towards the intact side (Thorson et al., 1982; Schmitz, 1985; Huber, 1987). Upon removal of the wax, normal and accurate localization is restored (Schmitz et al., 1983). Spiraling localization is also seen in katydids when one auditory spiracle is plugged or when both tympanal slits on a foreleg are covered with soft wax (Bailey and Stephen, 1984).
auditory organ; the anterior tympanum is missing, the posterior tympanum is reduced in size or is absent and the typical array of auditory afferents is absent (Huber et al., 1986; Huber, 1987). During positive phonotaxis, such one-eared female crickets also circle and localize towards the intact side, both before and after amputation of the regenerated limb (Schmitz et al., 1988).
One-eared female crickets can still localize male calling song (Huber et al., 1984; Huber, 1987; Schmitz, 1989), so bilateral auditory symmetry is not required for sound localization. However, strictly speaking, tympanal ablation and leg removal experiments do not address the question of whether asymmetric crickets localize less accurately than symmetrically hearing normal individuals. This is because unilateral deafening is an extreme case of auditory asymmetry, a reduction in input from two directional receivers to one, and consequently relates only to issues regarding binaural versus monaural localization. A few studies have examined localization performance in orthopterans with imposed binaural asymmetries, typically by monitoring female orientation to male song before, during and/or after occluding one or more sound entrances (tympana or spiracles) with wax (e.g. Bailey and Thomson, 1977; Wendler et al., 1980; Schmitz et al., 1983; Huber et al., 1984; Schmitz, 1985; Huber, 1987). Bailey and Stephen (1984) used a plug of compacted cottonwool in the left tracheal bulla to create unbalanced spiracular inputs, reducing tracheal sound transmission on one side by 8–12 dB, in the katydid Pachysagella australis and reported no serious impairment for females orienting towards singing males (acuity decreased, the mean turn angle increased and the proportion of turning errors increased, but not significantly for the three females tested). Unfortunately, none of the above studies was designed to look for long-term binaural asymmetry compensation effects.
What are needed are developmental and long-term occlusion studies, similar to those conducted in owls and humans, to determine what changes, if any, occur in localization performance and in the central nervous system when reversible asymmetries, which alter but do not deprive binaural auditory spatial cues, are imposed (Knudsen, 1985b, 1999). Indeed, evidence already exists that the orthopteran central nervous system is capable of compensating for extreme auditory asymmetries (e.g. unilateral deafening; Huber et al., 1984; Pallas and Hoy, 1986; Schildberger et al., 1986; Huber, 1987; Brodfuehrer and Hoy, 1988; Schmitz, 1989). Acoustic orthopterans may be good subjects for addressing such questions because (i) given their small size, the problem of sound localization is inherently interesting, (ii) there exists a substantial literature on the biophysics of hearing in crickets and katydids, (iii) we know a lot about the development and physiology of identified auditory neurons and their presumed behavioral functions, (iv) as in vertebrates, crickets and katydids possess tonotopic hearing organs and are capable of frequency discrimination, so localization cues are presumably processed across multiple channels, and (v) phonotaxis is an innate behavior for which a number of paradigms exist to measure localization performance.
Morphological and physiological plasticity in the peripheral and central auditory pathways of both juvenile and adult orthopterans has been described, particularly with regard to unilateral deafferentation studies, but it remains to be seen whether the acoustic Orthoptera have sufficient plasticity to overcome and compensate for binaural auditory asymmetries as in birds and mammals, a question that awaits further experimentation.
We thank numerous helpers who assisted with collecting katydids in the field, M. Chiuten and K. Snyder for katydid care, R. Wyttenbach for Igor wizardry, K. Reeve for statistical advice, A. Mason and H. Farris for many hours of asymmetric discussions and C. Clark, C. Gilbert, C. Hopkins and two anonymous referees for criticisms of earlier drafts of this manuscript. This study was supported by operating and equipment grants from NIMH (NIDCD R01 DC00103) to R.R.H. P.A.F. was supported by a Sir James Lougheed Award of Distinction (Alberta Heritage Scholarship Fund) and by teaching and research assistantships from Cornell University and R.R.H.
References
Bailey, W. J. and Stephen, R. O. (1984). Auditory acuity in the orientation behaviour of the bushcricket Pachysagella australis Walker (Orthoptera, Tettigoniidae, Saginae). Anim. Behav. 32, 816–829.
Bailey, W. J. and Thomson, P. (1977). Acoustic orientation in the cricket Teleogryllus oceanicus (Le Guillou). J. Exp. Biol. 67, 61–75.
Bennet-Clark, H. C. (1989). Songs and the physics of sound production. In Cricket Behavior and Neurobiology (ed. F. Huber, T. E. Moore and W. Loher), pp. 227–261. Ithaca, NY: Cornell University Press.
Bianki, V. L. (1988). The Right and Left Hemispheres of the Animal Brain: Cerebral Lateralization of Function. New York: Gordon & Breach Science Publishers.
Boyan, G. S. (1979). Directional responses to sound in the central nervous system of the cricket Teleogryllus commodus (Orthoptera: Gryllidae). I. Ascending interneurons. J. Comp. Physiol. 130, 137–150.
Brodfuehrer, P. D. and Hoy, R. R. (1988). Effect of auditory deafferentation on the synaptic connectivity of a pair of identified interneurons in adult field crickets. J. Neurobiol. 19, 17–38.
Capranica, R. R. (1992). The untuning of the tuning curve: is it time? Semin. Neurosci. 4, 401–408.
Chapple, W. D. (1977). Role of asymmetry in the functioning of invertebrate nervous systems. In Lateralization in the Nervous System (ed. S. Harnad, R. W. Doty, J. Jaynes, L. Goldstein and G. Krauthamer), pp. 3–22. New York: Academic Press.
Cranford, T. W. (1992). Directional asymmetry in the odontocete forehead. Am. Zool. 32, 140A.
Cranford, T. W. (1999). The sperm whale’s nose: sexual selection on a grand scale? Mar. Mammal. Sci. 15, 1133–1157.
Denton, E. J. and Warren, F. J. (1968). Eyes of the Histioteuthidae. Nature 219, 400–401.
Arthropoda. In Acoustic Behaviour of Animals (ed. R.-G. Busnel), pp. 277–345. Amsterdam: Elsevier Publishing Company. Ewing, A. W. (1989). Arthropod Bioacoustics: Neurobiology and
Behaviour. Ithaca, NY: Cornell University Press.
Faure, P. A. (1999). Neuroethology of acoustic startle in the eastern sword-bearing conehead, Neoconocephalus ensiger (Orthoptera: Tettigoniidae). PhD thesis, Cornell University, Ithaca, NY. Faure, P. A. and Hoy, R. R. (2000a). The sounds of silence:
cessation of singing and song pausing are ultrasound-induced acoustic startle behaviors in the katydid Neoconocephalus ensiger (Orthoptera; Tettigoniidae). J. Comp. Physiol. A 186, 129–142. Faure, P. A. and Hoy, R. R. (2000b). Neuroethology of the katydid
T-cell. I. Tuning and responses to pure tones. J. Exp. Biol. 203, 3225–3242.
Faure, P. A. and Hoy, R. R. (2000c). Neuroethology of the katydid T-cell. II. Responses to acoustic playback of conspecific and predatory signals. J. Exp. Biol. 203, 3243–3254.
Florentine, M. (1976). Relation between lateralization and loudness in asymmetrical hearing losses. J. Am. Aud. Soc. 1, 243–251. Fonseca, P. J. and Bennet-Clark, H. C. (1998). Asymmetry of
tymbal action and structure in a cicada: a possible role in the production of complex songs. J. Exp. Biol. 201, 717–730. Fuzessery, Z. M. (1986). Speculations on the role of frequency in
sound localization. Brain Behav. Evol. 28, 95–108.
Harnad, S., Doty, R. W., Jaynes, J., Goldstein, L. and Krauthamer, G. (1977). Lateralization in the Nervous System. New York: Academic Press.
Hofman, P. M., Van Riswick, J. G. A. and Van Opstal, A. J. (1998). Relearning sound localization with new ears. Nature Neurosci. 1, 417–421.
Huber, F. (1987). Plasticity in the auditory system of crickets: phonotaxis with one ear and neuronal reorganization within the auditory pathway. J. Comp. Physiol. A 161, 583–604.
Huber, F., Kleindienst, H.-U., Obermayer, K., Schildberger, K., Schmaderer, S., Schmitz, B. and Wohlers, D. W. (1986). The peripheral and central hearing system of adult crickets after unilateral foreleg amputation as larvae. Verh. Dt. Zool. Ges. 79, 215–216.
Huber, F., Kleindienst, H.-U., Weber, T. and Thorson, J. (1984). Auditory behavior of the cricket. III. Tracking of male calling song by surgically and developmentally one-eared females and the curious role of the anterior tympanum. J. Comp. Physiol. A 155, 725–738.
King, A. J., Hutchings, M. E., Moore, D. R. and Blakemore, C. (1988). Developmental plasticity in the visual and auditory representations in the mammalian superior colliculus. Nature 332, 73–76.
Knudsen, E. I. (1985a). Auditory experience influences the development of sound localization and space coding in the auditory system. In Comparative Neurobiology (ed. M. J. Cohen and F. Strumwasser), pp. 93–104. New York: John Wiley & Sons. Knudsen, E. I. (1985b). Experience alters the spatial tuning of
auditory units in the optic tectum during a sensitive period in the barn owl. J. Neurosci. 5, 3094–3109.
Knudsen, E. I. (1999). Mechanisms of experience-dependent plasticity in the auditory localization pathway of the barn owl. J. Comp. Physiol. A 185, 305–321.
Knudsen, E. I., Esterly, S. D. and Knudsen, P. F. (1984). Monaural occlusion alters sound localization during a sensitive period in the barn owl. J. Neurosci. 4, 1001–1011.
Knudsen, E. I., Esterly, S. D. and Olsen, J. F. (1994). Adaptive
plasticity of the auditory space map in the optic tectum of adult and baby barn owls in response to external ear modification. J. Neurophysiol. 71, 79–94.
Knudsen, E. I., Knudsen, P. F. and Esterly, S. D. (1982). Early auditory experience modifies sound localization in barn owls. Nature 295, 238–240.
Libersat, F. and Hoy, R. R. (1991). Ultrasonic startle behavior in bushcrickets (Orthoptera; Tettigoniidae). J. Comp. Physiol. A 169, 507–514.
Mason, A. C., Forrest, T. G. and Hoy, R. R. (1998). Hearing in mole crickets (Orthoptera: Gryllotalpidae) at sonic and ultrasonic frequencies. J. Exp. Biol. 201, 1967–1979.
McKay, J. M. (1969). The auditory system of Homorocoryphus (Tettigonioidea, Orthoptera). J. Exp. Biol. 51, 787–802.
Merilä, J. and Björklund, M. (1995). Fluctuating asymmetry and measurement error. Syst. Biol. 44, 97–101.
Michelsen, A. (1992). Hearing and sound communication in small animals: evolutionary adaptations to the laws of physics. In The Evolutionary Biology of Hearing (ed. D. B. Webster, R. R. Fay and A. N. Popper), pp. 61–77. New York: Springer-Verlag.
Michelsen, A., Heller, K.-G., Stumpner, A. and Rohrseitz, K. (1994). A new biophysical method to determine the gain of the acoustic trachea in bushcrickets. J. Comp. Physiol. A 175, 145–151. Møller, A. P. and Swaddle, J. P. (1997). Asymmetry, Developmental
Stability and Evolution. Oxford: Oxford University Press. Mörchen, A. (1980). Spike count and response latency. Two basic
parameters encoding sound direction in the CNS of insects. Naturwissenschaften 67, 469–470.
Morgan, M. (1977). Embryology and inheritance of asymmetry. In Lateralization in the Nervous System (ed. S. Harnad, R. W. Doty, J. Jaynes, L. Goldstein and G. Krauthamer), pp. 173–194. New York: Academic Press.
Murphey, R. K. and Zaretsky, M. D. (1972). Orientation to calling song by female crickets, Scapsipedus marginatus (Gryllidae). J. Exp. Biol. 56, 335–352.
Neville, A. C. (1976). Animal Asymmetry. London: Edward Arnold (Publishers) Limited.
Norberg, R. Å. (1977). Occurrence and independent evolution of bilateral ear asymmetry in owls and implications on owl taxonomy. Phil. Trans. R. Soc. Lond. B 280, 375–408.
Oldfield, B. P. (1988). Tonotopic organization of the insect auditory pathway. Trends Neurosci. 11, 267–270.
Pallas, S. L. and Hoy, R. R. (1986). Regeneration of normal afferent input does not eliminate aberrant synaptic connections of an identified auditory interneuron in the cricket, Teleogryllus oceanicus. J. Comp. Neurol. 248, 348–359.
Palmer, A. R. (1996). Waltzing with asymmetry. Bioscience 46, 518–532.
Palmer, R. and Strobeck, C. (1986). Fluctuating asymmetry: measurement, analysis, patterns. Annu. Rev. Ecol. Syst. 17, 391–421. Payne, R. S. (1971). Acoustic localization of prey by barn owls. J.
Exp. Biol. 54, 535–573.
Prager, J. (1976). Das mesothorakale Tympanalorgan von Corixa punctata. III. (Heteroptera, Corixidae). J. Comp. Physiol. 110, 33–50.
Prager, J. and Larsen, O. N. (1981). Asymmetrical hearing in the water bug Corixa punctata observed with laser vibrometry. Naturwissenschaften 68, 579–580.
Prager, J. and Streng, R. (1982). The resonance properties of the physical gill of Corixa punctata and their significance in sound reception. J. Comp. Physiol. 148, 323–335.
Rheinlaender, J., Hardt, M. and Robinson, D. (1986). The directional sensitivity of a bush cricket ear: a behavioural and neurophysiological study of Leptophyes punctatissima. Physiol. Ent. 11, 309–316.
Rheinlaender, J. and Römer, H. (1980). Bilateral coding of sound direction in the CNS of the bushcricket Tettigonia viridissima L. (Orthoptera, Tettigoniidae). J. Comp. Physiol. 140, 101–111. Rice, W. R. (1989). Analyzing tables of statistical tests. Evolution 43,
223–225.
Römer, H. and Krusch, M. (2000). A gain-control mechanism for processing of chorus sounds in the afferent auditory pathway of the bushcricket Tettigonia viridissima (Orthoptera; Tettigoniidae). J. Comp. Physiol. A 186, 181–191.
Römer, H., Marquart, V. and Hardt, M. (1988). Organization of a sensory neuropile in the auditory pathway of two groups of Orthoptera. J. Comp. Neurol. 275, 201–215.
Ryan, A. K., Blumberg, B., Rodriguez-Esteban, C., Yonei-Tamura, S., Yonei-Tamura, K., Tsukui, T., Peña, J. D. L., Sabbagh, W., Greenwald, J., Choe, S., Norris, D. P., Robertson, E. J., Evans, R. M., Rosenfeld, M. G. and Belmonte, J. C. I. (1999). Pitx2 determines left–right asymmetry of internal organs in vertebrates. Nature 394, 545–551.
Schildberger, K., Wohlers, D. W., Schmitz, B., Kleindienst, H.-U. and Huber, F. (1986). Morphological and physiological changes in central auditory neurons following unilateral foreleg amputation in larval crickets. J. Comp. Physiol. A 158, 291–300.
Schmitz, B. (1985). Phonotaxis in Gryllus campestris L. (Orthoptera, Gryllidae). III. Intensity dependence of the behavioural performance and relative importance of tympana and spiracles in directional hearing. J. Comp. Physiol. A 156, 165–180.
Schmitz, B. (1986). Compensation of unilateral hearing deficiencies in the acoustic orientation of crickets. Verh. Dt. Zool. Ges. 79, 237.
Schmitz, B. (1989). Neuroplasticity and phonotaxis in monaural adult female crickets (Gryllus bimaculatus de Geer). J. Comp. Physiol. A 164, 343–358.
Schmitz, B., Kleindienst, H.-U., Schildberger, K. and Huber, F. (1988). Acoustic orientation in adult, female crickets (Gryllus bimaculatus de Geer) after unilateral foreleg amputation in the larva. J. Comp. Physiol. A 162, 715–728.
Schmitz, B., Scharstein, H. and Wendler, G. (1983). Phonotaxis in Gryllus campestris L. (Orthoptera, Gryllidae). II. Acoustic orientation of female crickets after occlusion of single sound entrances. J. Comp. Physiol. 152, 257–264.
Schwartz, J. J. and Gerhardt, H. C. (1998). The neuroethology of frequency preferences in the spring peeper. Anim. Behav. 56, 55–69. Shapiro, S. S. and Wilk, M. B. (1965). An analysis of variance test
for normality (complete samples). Biometrika 52, 591–611. Simmons, L. W. and Ritchie, M. G. (1996). Symmetry in the songs
of crickets. Proc. R. Soc. Lond. B 263, 305–311.
Simon, H. J. and Aleksandrovsky, I. (1997). Perceived lateral position of narrow-band noise in hearing-impaired and normal-hearing listeners under conditions of equal sensation level and sound-pressure level. J. Acoust. Soc. Am. 102, 1821–1826. Simon, H. J., Collins, C. C., Jampolsky, A., Morledge, D. E. and
Yu, J. (1994). The measurement of the lateralization of narrow bands of noise using an acoustic pointing paradigm: the effect of sound-pressure level. J. Acoust. Soc. Am. 95, 1534–1547. Stapells, D. R., Picton, T. W. and Smith, A. D. (1982). Normal