Changes in Brain Size with Treatment in
Patients with Hyper- or Hypothyroidism
Angela Oatridge, Maria L. Barnard, Basant K. Puri, Simon D. Taylor-Robinson, Joseph V. Hajnal, Nadeem Saeed, and Graeme M. Bydder
BACKGROUND AND PURPOSE: Although neuropsychological symptoms and signs are common in thyroid disease, their organic substrate is unknown. We performed brain MR imaging in patients with hyperthyroidism or hypothyroidism before and after treatment and correlated the results with hormonal markers.
METHODS. Eight patients with hyperthyroid disease and three with hypothyroid disease underwent imaging within 1–2 days of a thyroid hormone testing. Images were registered, and brain and ventricular sizes were measured by using a semiautomated contour and thresholding technique. Changes in brain and ventricular volume were correlated with serum levels of total thyroxine (T4), unbound triiodothyronine (free T3), and thyroid-stimulating hormone (TSH) before and after treatment.
RESULTS. With treatment, brain size decreased by 6,329 –31,183 mm3in the hyperthyroid group and increased by 2,599 – 48,825 mm3in the hypothyroid group. Conversely, with treat-ment, ventricular size increased by 325– 6,279 mm3in the hyperthyroid group and decreased by 760 –2,376 mm3in the hypothyroid group. There was a highly significant correlation between reduction in brain size and reduction in T4, as well as between the increase in ventricular size and reduction in T4. There was a significant correlation between reduction in ventricular size and reduction in free T3. There were highly significant correlations between reduced levels of TSH and increase in brain size, as well as between increased levels of TSH and increase in ventricular size.
CONCLUSION. In thyroid disease, the size of the brain and ventricles significantly change after treatment, and these changes are correlated with T4, free T3, and TSH levels. The mechanism of these changes is uncertain, but it may involve osmolyte regulation, the sodium and water balance, and alterations in cerebral hemodynamics.
An excessive production or deficiency of thyroid hor-mones may result in symptoms and signs that can affect every organ in the body, including the brain (1). In patients with hyperthyroidism, feelings of nervous-ness, tension, and anxiety are common, whereas in patients with hypothyroidism, poor memory, mental slowing, and depression are frequently noted (2). Al-though the brain is clearly implicated in thyroid
dis-ease, no abnormalities have previously been demon-strated within the brain by using imaging techniques. Our aims were to use MR imaging to determine whether brain changes could be observed in patients with hyperthyroidism and in those with hypothyroid-ism after treatment and to correlate any changes with serum markers of disease.
Methods
Eleven patients (six male, five female) with a mean age⫾
SD of 41 years⫾12 (range, 22–59 years) were prospectively examined. Approval of the study was obtained from our insti-tution’s ethics committee, and all patients provided informed consent. At diagnosis, eight of the patients had hyperthyroid-ism and three had hypothyroidhyperthyroid-ism. All patients with hyperthy-roidism had serum antibodies against thyroid-stimulating hor-mone (TSH), consistent with Graves disease. At presentation, antithyroid therapy with thionamide drugs was initiated (seven patients received carbimazole, and one received propylthioura-cil). Two of the three patients with hypothyroidism had primary disease, whereas hypothyroid develop in the third patient after 131I therapy for hyperthyroidism. In all three patients with hypothyroidism, thyroxine replacement therapy was started at presentation with a maintenance dose of 100g/dL.
Received October 15, 2001; accepted after revision May 30, 2002.
From the Robert Steiner Magnetic Resonance Unit, Imaging Sciences Department, Faculty of Medicine, Imperial College, Hammersmith Hospital Campus (A.O., B.K.P., S.D.T.-R., J.V.H., N.S., G.M.B), and the Department of Endocrinology, the Whit-tington Hospital, Highgate Hill (M.L.B), London, England.
Address reprint requests to Graeme M. Bydder, Robert Steiner Magnetic Resonance Unit, Imaging Sciences Department, Faculty of Medicine London, Imperial College, Hammersmith Hospital Campus, London, W12 OHS, England.
©American Society of Neuroradiology
MR Imaging
Three-dimensional, T1-weighted, radio-frequency, spoiled MR images (TR/TE/NEX, 21/6/2; flip angle, 35°; imaging ma-trix, 152⫻256⫻114; FOV, 25 cm; section thickness, 1.6 mm) were obtained by using a 1.-T machine (HPQ Plus; Marconi Medical Systems, Cleveland, OH). All 11 patients underwent imaging before treatment and 1 month after treatment. Further follow-up images were acquired at 3 months in eight patients, at 6 months in four patients, at 9 months in two patients, and at 14 months in one patient. All follow-up images were regis-tered by using subvoxel image registration to ensure that they accurately matched the position on the pretreatment images (to approximately 0.01 mm) (3, 4). Registered-difference im-ages were generated by subtracting the registered post-treat-ment image from pretreatpost-treat-ment image.
Quantitation Method
In each patient, brain volume and ventricular volume (that of only the lateral and third ventricles) were measured from the anatomic images acquired before treatment and at the end point of treatment. A semiautomated contour and thresholding program was used (5, 6). Separate contours were drawn for the brain and ventricles. In each case, the contours were positioned so that they loosely enclosed the region of interest without impinging on it and so that they excluded any other structures of similar signal intensity. Threshold values were calculated for both the brain and CSF (5), and the number of voxels mea-sured was converted into a volume by referencing them to the imaging matrix size and section thickness.
Serum levels of total thyroxine (T4); unbound, or free, tri-iodothyronine (T3); and TSH were measured before and after treatment within 1 to 2 days of the MR imaging examinations. Changes in brain and ventricular size were correlated with changes in the levels of T4, free T3,and TSH.
Statistical Analysis
The Pearson correlation was used to correlate the change in the size of the brain and ventricles with the changes in the levels of T4, free T3, and TSH.
Results
Clinical and Biochemical Findings
The patients’ clinical assessments and the level of thyroid hormones before and after treatment and are shown in Table 1. In each case, the initial measured T4, free T3, and TSH levels were within the diagnostic range for either hyperthyroidism or hypothyroidism. In seven of the eight patients in the hyperthyroid group, the level of thyroid hormones returned to normal after treatment. In the one remaining patient, the hormone levels showed evidence of improvement after treatment, but did not reach the normal range. (For example, the T4level was reduced from 307 to
228 nmol/L.) In all patients with hyperthyroidism, symptoms of anxiety, agitation, restlessness, and hy-peractivity were reduced with treatment.
In the patients with hypothyroidism, thyroid hor-mone levels returned to the normal range except for a persistently elevated TSH level in one patient. Ini-tially, all three patients reported fatigue, lethargy, mental slowing, and depression. After treatment, these symptoms improved.
Qualitative Brain and Ventricular Changes on MR Images
[image:2.587.54.534.72.232.2]In all patients, the size of the brain and ventricular system changed after treatment. These changes were evident only on the registered subtraction images. In the hyperthyroid group, brain size decreased and ven-tricular sized increased as the patients’ conditions reverted toward a euthyroid state (Fig 1). Conversely, in the hypothyroid group, the brain increased in size and the ventricles decreased in size as the patients’ conditions reverted to a euthyroid state.
TABLE 1: Clinical features and serum levels of T4, free T3, and TSH before and after treatment
Patient
Initial Diagnosis*
Level Before Treatment
Clinical Diagnosis After Treatment
Clinical Assessment After Treatment㛳
Level After Treatment
T4 (nmol/L)†
T3 (pmol/L)‡
TSH (mU/L)§
T4 (nmol/L)†
T3 (pmol/L)‡
TSH (mU/L)§ 1 Hyperthyroidism 284 32.2 ⬍0.1 Euthyroidism Symptoms remitted 116 7.8 ⬍0.1 2 Hyperthyroidism 267 23⫹ ⬍0.1 Euthyroidism Symptoms remitted 61 2.2⫹ ⬍0.1 3 Hyperthyroidism 263 13.2⫹ ⬍0.1 Euthyroidism Symptoms remitted 112 4.6⫹ ⬍0.1 4 Hyperthyroidism 196 28.2 ⬍0.1 Euthyroidism Symptoms remitted 73 7.2 ⬍0.1 5 Hyperthyroidism 142 11.1 ⬍0.1 Euthyroidism Symptoms remitted 53 2.8⫹ ⬍0.1 6 Hyperthyroidism 287 39.7⫹ ⬍0.1 Euthyroidism Symptoms remitted 121 6.1⫹ 1.4 7 Hyperthyroidism ⬎300 55.9 ⬍0.1 Euthyroidism Symptoms remitted 66 6.2 ⬍0.1
8 Hyperthyroidism 307 ⬎45 ⬍0.1 Toxicity Symptoms remitted 229 20.4 ⬍0.1
9 Hypothyroidism 2 2.9 43.3 Euthyroidism Symptoms remitted 81 6.9 2.5
10 Hypothyroidism ⬍15 NA 76.5 Euthyroidism Symptoms remitted 94 NA 3.4
11 Hypothyroidism ⬍15 NA ⬎100 Euthyroidism Symptoms remitted 113 NA 25.9
* All patients with hyperthyroidism had neuropsychological symptoms of anxiety, agitation, restlessness, and hyperactivity. All patients with hypothyroidism had neuropsychological symptoms of tiredness, lethargy, mental slowing, and depression.
† Normal range, 60–160 nmol/L.
‡ Normal ranges, 5.4–9.3 pmol/L (assay 1) and 2.5–5.3 pmol/L (assay 2) (denoted with⫹). § Normal range, 0.4–4.0 mU/L.
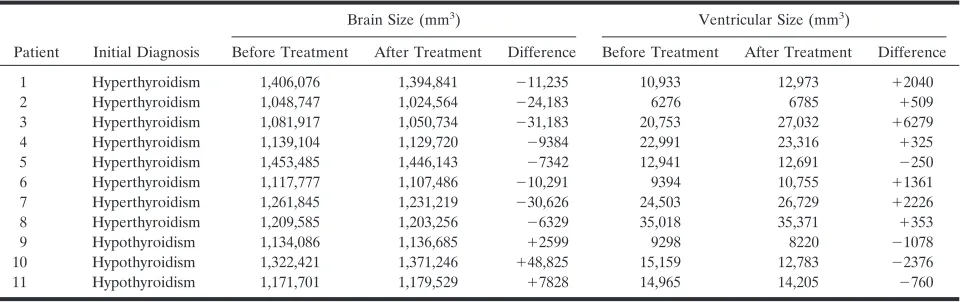
Brain and Ventricular Volume Measurements
The differences in brain and ventricular size before and after treatment are shown in Table 2. The corre-lations of volume change with changes in T4, free T3,
and TSH levels before and after treatment are shown in Figures 2–4, respectively.
In the eight patients with hyperthyroidism, brain size was reduced by 6329–31,183 mm3 after
treat-ment, as the patients’ conditions reverted toward a euthyroid state (Table 2). A corresponding increase in ventricular size of 325–6279 mm3 was noted in
seven of these patients. In one patient, the size of the ventricles was reduced by 250 mm3. In all three
pa-tients with hypothyroidism, brain size increased after treatment, as the patients’ conditions became euthy-roid. Their brain sizes were 2599, 7828, and 48,825 mm3; the corresponding reduction in ventricular size
were 1078, 760, and 2376 mm3, respectively (Table 2).
Change in Brain Size and Serum T4 Level
Figure 2 shows the change in brain size (Fig 2A) and ventricular size (Fig 2B), as correlated with the change in the level of T4(with 95% confidence
inter-vals). This analysis combined the changes occurring in the patients with hyperthyroidism and those occurring in patients hypothyroidism during treatment. In the brain, an increase in size was correlated with an in-crease in serum T4 levels (Fig 2A). The correlation
was statistically significant (n ⫽ 11, r⫽ ⫹0.81,P ⫽
.003). In the ventricles (Fig 2B), an increase in size
was correlated with a reduction of serum T4 levels.
This correlation was also statistically significant (n⫽ 11,r⫽ ⫺0.865,P⫽ .001).
Change in Brain Size and Serum Free T3Level
Figure 3 illustrates the change in brain size (Fig 3A) and ventricular size (Fig 3B) with changes in the serum levels of free T3. This analysis combined the changes
in patients with hyperthyroidism and the changes in patients with hypothyroidism during treatment. In the brain, a trend similar to that of the serum T4levels was observed, but it was not significant (n ⫽9, r⫽0.333,
P⫽.381). Increases in ventricular size and reductions in le free T3levels were significantly correlated (n⫽9,r⫽
⫺7.0,P⫽.036).
Change in Brain Size and Serum TSH Levels
Figure 4 shows the changes in brain (Fig 4A) and ventricular size (Fig 4B), as correlated with changes in TSH levels. The data fit into two distinct groups for both the brain and ventricles. The eight patients with hyperthyroidism formed one group, and the three patients with hypothyroidism formed another. In all patients in the hyperthyroid group, the serum TSH values at presentation were less than 0.1 mU/L. After treatment, the values remained suppressed at that level in all patients but one. In the hypothyroid group, the levels of TSH were elevated before treatment and markedly reduced after treatment as the patients’ conditions became euthyroid. The graphs (Fig 4) show
FIG 1. Brain and ventricular changes be-fore and after treatment in a patient with hyperthyroidism.
A, Sagittal T1-weighted image near the midline of the brain.
[image:3.587.54.376.62.203.2]B, Registered subtraction image. The low-signal-intensity boundaries at the cor-tex (large arrow) indicate reduced brain size, and the low-signal-intensity seen more centrally (small arrow) indicates ven-tricular enlargement.
TABLE 2: Brain and ventricular volumes before and after treatment
Patient Initial Diagnosis
Brain Size (mm3) Ventricular Size (mm3)
Before Treatment After Treatment Difference Before Treatment After Treatment Difference
1 Hyperthyroidism 1,406,076 1,394,841 ⫺11,235 10,933 12,973 ⫹2040
2 Hyperthyroidism 1,048,747 1,024,564 ⫺24,183 6276 6785 ⫹509
3 Hyperthyroidism 1,081,917 1,050,734 ⫺31,183 20,753 27,032 ⫹6279
4 Hyperthyroidism 1,139,104 1,129,720 ⫺9384 22,991 23,316 ⫹325
5 Hyperthyroidism 1,453,485 1,446,143 ⫺7342 12,941 12,691 ⫺250
6 Hyperthyroidism 1,117,777 1,107,486 ⫺10,291 9394 10,755 ⫹1361
7 Hyperthyroidism 1,261,845 1,231,219 ⫺30,626 24,503 26,729 ⫹2226
8 Hyperthyroidism 1,209,585 1,203,256 ⫺6329 35,018 35,371 ⫹353
9 Hypothyroidism 1,134,086 1,136,685 ⫹2599 9298 8220 ⫺1078
10 Hypothyroidism 1,322,421 1,371,246 ⫹48,825 15,159 12,783 ⫺2376
[image:3.587.54.535.228.379.2]a close relationship between the minimal change in TSH levels and a decrease in brain volume or an increase in ventricular size. Low levels of TSH were significantly correlated with an increase in brain size (n ⫽11, r⫽
0.788,P⫽.005) (Fig 4A), and elevated TSH levels were correlated with an increase in ventricular size (n⫽11,
r⫽0.782,P⫽0.004) (Fig 4B).
Discussion
We have shown a strong correlation between changes in brain and ventricular size and thyroid hormone levels after treatment. In hyperthyroidism, the brain decreased in size and the ventricles increased in size. In hypothy-roidism, the brain increased in size, and the ventricles decreased in size.
Thyroid hormones are essential for the develop-ment and maintenance of cellular function and growth. Several functional changes occur with excessive or
defi-cient levels of circulating thyroid hormones. In hyper-thyroidism, the basal metabolic rate increases (7), and the oxygen consumption of organs such as the heart, liver, kidneys, and anterior pituitary gland is in-creased (8, 9). Other changes include increases in cardiac output with a reduction in peripheral resis-tance (10); increases in the glomerular filtration rate; (11–13), and increases in protein, carbohydrate, lipid, and vitamin metabolism (14). The reverse is seen in hypothyroidism (10, 13, 15, 16). With treatment, these metabolic changes are reversible.
Neurologic and psychological manifestations occur in both states. Patients with hyperthyroidism may experience anxiety, emotional lability, and poor con-centration. More severe neuropsychological disorders may also occur; these can include delirium and mania (17). Patients with hypothyroidism can have depres-sion, reversible dementia, and schizophrenia (myx-edema madness) (18). Little is known about the
eti-FIG 2. Correlation of changes in brain and ventricular size with changes in T4 levels (with 95% confidence limits).
A, Increases in brain size were strongly correlated with increases in T4levels.
B, Reductions in ventricular size were strongly correlated with increases in T4 levels.
FIG 3. Correlation of changes in brain and ventricular size with changes in T3 levels (with 95% confidence intervals).
A, Brain size increased with increased in T3levels, but the changes were not signif-icant.
B, Reductions in ventricular size were strongly correlated with increases in T3 levels.
FIG 4. Correlation of changes in brain
and ventricular size with changes in TSH levels. The data formed two distinct groups. After treatment, TSH levels in the hyperthyroid patients either increased by a small amount or not at all. Although initially very high, TSH levels in the hypo-thyroid patients decreased to the normal range after treatment.
A, Low levels of TSH was correlated with reductions in brain size.
ology underlying the neuropsychological features of hyper- and hypothyroidism. Thyroid hormones are thought to affect neurotransmitter synthesis and the release of cytokines that affect brain function (19). In hyperthyroidism, oxidative metabolism is reduced, and this reduction in turn affects neuronal integrity. Cytokine release may result in the excessive release of neurotransmitters such as dopamine, norepinephrine, and glutamine, and cerebral confusion, which is often present in thyrotoxic patients, can result. The abnor-malities in circulating thyroid hormone levels may also be associated with changes in cellular hydration, circulatory hemodynamics, the basal metabolic rate, and calcium homeostasis.
Much work has been performed to investigate how osmotic stress effects the regulation of brain-cell vol-ume (20). With hyper- or hypo-osmotic stress, os-molyte levels are increased or decreased, respectively, in an attempt to regulate brain cellular hydration and the passage of water across the blood-brain barrier. Various molecules have been shown to be brain os-molytes. In patients with hepatic encephalopathy, a reduction in the brain myo-inositol signal intensity (as detected with proton (1H) magnetic MR
spectros-copy) has been related to a reduction in the intracel-lular osmotic pressure. These findings are reversible once hepatic encephalopathy is successfully treated (21). These results have also been demonstrated in animal studies. Other cellular osmolytes, such as tau-rine and glycerophosphocholine, have been shown to be depleted in animals (22) and humans (23) during exposures to hypo-osmotic stress (24). These changes reverse once the stress factor is removed. In thyroid disease, the sodium and water homeostasis in brain cells may be disturbed. Some evidence suggests a reduction in brain-cell osmolyte levels in the hyper-thyroid state; this reduction may be an adaptive re-sponse to increased amounts of cellular water and decreased cellular osmotic pressure. The reverse may be true in hypothyroidism. This possibility is interest-ing because patients with hyperthyroidism usually lose weight, but their brains appear to increase in size. In hypothyroidism, the reverse is evident. That is, weight gain occurs with a reduction in brain size.
In studies of hyperthyroid rats (25) and cats (26), a depletion of intracellular taurine has been seen sec-ondary to a reduction in the sodium concentration. The reverse findings are seen in neonatal rats with induced hypothyroidism, in which an increase in tau-rine levels was detected (27). In humans, tautau-rine concentrations in blood platelets are reduced in hy-perthyroidism and increased in hypothyroidism. After treatment, the changes reverse (28). Furthermore, in patients with Graves disease,1H MR spectroscopy of
the frontal lobes shows that the choline-creatine (Cho/Cr) signal decreases when patients are thyro-toxic and increases after treatment when patients’ conditions change to euthyroidism (29). Findings sug-gest that a reduction in levels of glycerophosphocho-line, another osmolyte, is associated with brain swell-ing. In hypothyroidism, the same explanation may also apply. The reverse findings were seen in a study
of infants with hypothyroidism who underwent proton MR spectroscopy. The results showed that the cho-line signal increases in the hypothyroid state (30). Combined studies of both MR imaging and MR spec-troscopy performed in patients before and after treat-ment may provide additional useful information.
Abnormalities in circulating thyroid hormone lev-els are known to affect sodium and water handling. In hyperthyroidism, the glomerular filtration rate (GFR) increases (10, 13), as does the amount of excreted so-dium and creatinine (31, 32). Changes in plasma vaso-pressin levels and sensitivity have also been found. In hypothyroidism, renal blood flow and the GFR are re-duced, and excretion of a water load is reduced. Exces-sive or deficient levels of circulating thyroid hormones may also directly affect brain cellular hydration and sodium content. This possibility was reflected in changes in brain volume seen in this study.
Other possible causes for the changes in brain size in thyroid disease include alterations in the cerebral hemodynamics. In hyperthyroidism, cardiac output is increased and peripheral resistance is reduced. These changes have been shown to be reversible with treat-ment (33, 34). In rats, a reduction in peripheral re-sistance is associated with an increase in cerebral blood flow, which may lead to or contribute to the development of cerebral edema (35, 36). These same phenomena may also occur in humans. Although the theory is still controversial, our findings support the cell hydration and dehydration theory.
Conclusion
We have shown that brain and ventricle sizes change with treatment of hyperthyroid and hypothy-roid states in humans and that these alterations are correlated with changes in the levels of circulating thyroid hormones. The reasons for the changes in brain size are uncertain, but they may involve os-molyte regulation, the sodium and water balance, and alterations in cerebral hemodynamics.
Acknowledgment
We wish to thank Marconi Medical Systems for their con-tinued support.
References
1. Becker KL, ed.Principles and Practice of Endocrinology and Metab-olism.Philadelphia: Lippincott; 1990:331–370
2. Becker KL, ed.Principles and Practice of Endocrinology and Metab-olism.Philadelphia: Lippincott; 1990:1479–1488
3. Hajnal JV, Saeed N, Soar E, et al.A registration and interpolation procedure for subvoxel matching of serially acquired MR images.
J Comput Assist Tomogr1995;19:677–691
4. Saeed N.Magnetic Resonance image segmentation using pattern recognition, and applied to registration and quantitation. MR Biomed.1998;11:157–167
7. Iossa S, Liverini G, Barletta A.Relationship between the resting metabolic rate and hepatic metabolism in rats: effect of hyperthy-roidism and fasting for 24 hours.J Endocrinol1992;135:45–51 8. Singh G, Sharma AC, Thompson EB, et al. Renal endothelin
mechanism in altered thyroid states.Life Sci1994;54:1901–1908 9. Gomberg-Maitland M, Frishman WH.Thyroid hormone and
car-diovascular disease.Am Heart J1998;135:187–196
10. Weissel M. Hyperthyroidism and heart (review). Wien Klin Wochenschr2001;113:157–161
11. Montenegro J, Gonzalez O, Saracho R, et al. Changes in renal function in primary hypothyroidism.Am J Kidney Dis1996;27:195– 198
12. Kryvych NV, Pishak VP.Water-salt balance in patients with diffuse toxic goiter and hypothyroidism.Lis Sprava1997;4:110–114 13. Capasso G, De Tommaso G, Pica A, et al. Effects of thyroid
hormones on the heart and kidney functions. Miner Electrolyte Metab1996;25:56–64
14. Pucci E, Chiovato L, Pinchera A.Thyroid and lipid metabolism.
Intl J Obes Relat Metab Disord2000;2(suppl):109–112
15. Bengel FM, Nekolla SG, Ibrahim T, Weniger C, Ziegler SI, Schwaiger M. Effect of thyroid hormones on cardiac function, geometry, and oxidative metabolism assessed non-invasively by positron emission tomography and magnetic resonance imaging.
J Clin Endocrinol Metab2000;85:1822–1827
16. Villabonna C, Sahun M, Roca M, et al.Blood volumes and renal function in overt and subclinical primary hypothyroidism.Am J Med Sci1999;318:277–280
17. van der Mast RC.Pathophysiology of delirium.J Geriatr Psychiatry Neurol1998;11:138–145
18. Hierholzer K, Finke R.Myxedema.Kidney Int Suppl1997;59:82–89 19. Rasmussen AK.Cytokine actions on the thyroid gland.Dan Med
Bull2000;47:94–114
20. Haussinger D, Kircheis G, Fischer R, et al.Hepatic encephaolopa-thy in chronic liver disease: a clinical manifestation of astrocytic swelling and low-grade cerebral edema.J Hepatol 2000;32:1035– 1038
21. Haussinger D.Role of cellular hydration in the regulation of cell function.Biochem J1996;313:697–710
22. Estevez AY, O’Regan MH, Song D, et al.Hyposmotically induced amino acid release from the rat cerebral cortex: role of phospho-lipases and protein kinases.Brain Res1999;844:1–9
23. Burg MB Molecular basis of osmotic regulation.Am J Physiol
1995;268:983–996
24. Law RO.The role of taurine in the regulation of brain cell volume in chronically hyponatraemic rats.Neurochem Int1998;33:467–472 25. Nozaki M.Changes in free amino acids in the central nervous system of hypo- and hyperthyroid rats.Rinsho Shinkeigaku1989; 29:713–719
26. Fox PR, Trautwein EA, Hayes KC, et al.Comparison of taurine, alpha-tocopherol, retinol, selenium, and total triglycerides and cholesterol.Am J Vet Res1993;54:563–569
27. Sugie H, Tsurui S, Ishikawa A, et al.Effects of neonatal hypothy-roidism on brain development: analysis of brain metabolites using high resolution phosphorus and proton magnetic resonance (NMR) spectroscopy.No To Hattatsu1990;22:166–172
28. Baskin SI, Klekotka SJ, Kendrick ZV, et al.Correlation of taurine levels with thyroid function.J Endocrinol Invest1979;2:245–249 29. Bhatora VS, Tripathi RP, Sankar R, et al. Frontal lobe proton
magnetic-resonance spectroscopy in Graves’ disease: a pilot study.
Psychoneuroendocrinology1998;23:605–612
30. Gupta RK, Bhatia V, Poptani H, et al.Brain metabolite changes on in vivo proton magnetic resonance spectroscopy in children with congenital hypothyroidism.J Pediatr1995;126:389–392
31. Shirota T.Studies on the renal handling of urea nitrogen, creatine, water and electrolytes in hyperthyroid patients with Graves’ dis-ease.Nippon Naibunpi Gakkaiz Asshi1991;67:611–621
32. Shitora T, Shinoda T, Yamada T, et al.Alteration of renal function in hyperthyroidism: increased tubular secretion of creatine and decreased distal tubule delivery of chloride.Metabolism1992;41; 402–405
33. Toft P, Botker HE.Hyperthyroidism and heart disease: is thyro-toxic cardiomyopathy a disease entity? Ugeskr Laeger 1993;155: 1354–1357
34. Araki T, Tofuku Y. An 85 year old case of Basedow’s disease associated with high output heart failure and angina pectoris.
Nippon Ronen Igakkaiz Asshi1996;33:191–195
35. Cordoba J, Crespin J, Gottstein J, et al.Mild hypothermia modifies ammonia-induced brain edema in rats after portacaval anastomo-sis.Gastroenterology1999;116:686–693