Preparation and Characterization of Silica and Clay-Silica
Core-Shell Nanoparticles Using Sol-Gel Method
Olfat M. Sadek1,Safenaz M. Reda2*, Reem K. Al-Bilali3
1Department of Materials Science, Institute of Graduate Studies and Research, Alexandria University, Alexandria, Egypt
2Chemistry Department, Faculty of Science, Benha University, Benha, Egypt
3Chemistry Department, College of Science for Girls, University of Dammam, Dammam, Kingdom of Saudi Arabia Email: *[email protected]
Received December 24, 2012; revised January 25, 2013; accepted February 2, 2013
Copyright © 2013 Olfat M. Sadek et al. This is an open access article distributed under the Creative Commons Attribution License,
which permits unrestricted use, distribution, and reproduction in any medium, provided the original work is properly cited.
ABSTRACT
Silica and montmorillonite-supported silica nanoparticles were prepared via an acid one step sol-gel process. The syn-thesized solids were characterized using XRD, FTIR, TEM and N2 adsorption. The effect of preparing temperatures on the structure and properties of the silica nanoparticles were studied. The results show that the increase of annealing temperature from 25˚C to 200˚C, don’t change amorphous state of silica. While for montmorillonite-supported silica the clay platelets are delaminated during the sol-gel process. TEM results showed that the average particle size of silica is increased by increasing temperature due to the particle sintering and the clay-silica nanoparticles possessed core–shell morphology with diameter of 29 nm. The surface area measurements showed that by increasing annealing temperature the surface area was decreased due to aggregation of particle. The clay-silica sample showed lower average pore width than that of the silica prepared at 200˚C indicating that it has a macropores structure. The adsorption efficiency of the prepared samples was tested by adsorption of protoporphyrin IX. The highest adsorption efficiency was found for SiO2 prepared at 200˚C. Temkin model describe the equilibrium of adsorption of protoporphyrin IX on caly-silica nanoparti-cles under different conditions.
Keywords: Silica; Clay-Silica; Sol-Gel Method; Core-Shell; Nanoparticles
1. Introduction
Silica nanoparticles have attracted wide interest in view of their excellent optical, electrical and thermal proper-ties. It has been applied in many fields, such as catalysis, cosmetics, paints and drug delivery. Different approaches have been used to prepare silica nanoparticles, including the thermal methods, the sol-gel processing technique and water-in-oil (W/O) microemulsion. The sol-gel pro- cessing technique for the synthesis of silica nanoparticles has been widely used since pore volume and pore size can be controlled at the chemical solution stage [1-4]. Sol-gel-derived nano silica has many unusual properties such as an adjustable refractive index, a high porosity, a low thermal conductivity, and a low dielectric constant. Therefore, it has become increasingly attractive to use in optical, microelectronic, and thermal applications such as
antiglare and antireflective coatings, thermal insulation, and other applications [5-8]. Nano structures and proper-ties of silica are greatly dependent on experimental con-ditions in a sol-gel process [9-12].
Recently, considerable effort has been devoted to the fabrication of core-shell particles, which often exhibit improved physical and chemical properties of silica [4]. The core-shell can be broadly defined as comprising a core (inner material) and a shell (outer layer material). These are able to consist of a wide range of different combinations in close interaction, including inorganic/ inorganic, organic/organic, and inorganic/organic mate-rials which the inorganic/inorganic interaction has util-ized in this paper. The core-shell composite particles have been utilized in a wide range of areas, such as elec-tronics, catalysis and separation. The inorganic samples such as clay minerals have wide applications for a long time, such as catalysts and catalytic supports [13], ad-sorbents of organic substances and clay based porous
*1,2Present address: Chemistry Department, College of Science for Girls,
materials [13]. Since they have enhanced thermal/me on structure and particle size of silica. These samples are referred to as 25, 60, 100 and silica-200, respectively.
chanical stability, high surface area and can effectively reduce the agglomeration of particles [13].
In this paper, the silica nanoparticles have been pre-pared by an acid one step sol-gel method. The effect of temperatures on the structure of silica is discussed. The effect of addition of sodium montmorillonite clay (Na-MMT) to properties of silica is also observed. Protopor-phyrin IX (PPIX) was used as a candidate to study the adsorption efficiency of the prepared samples.
2. Experimental
2.1. Chemicals
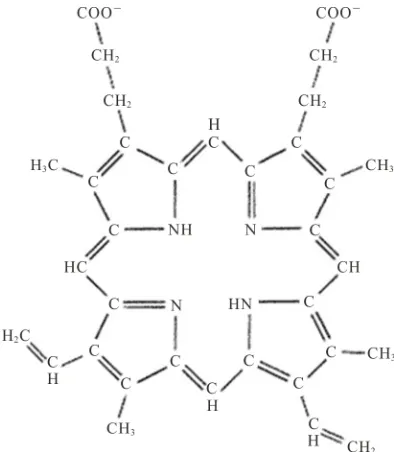
All chemicals were used as received without further treatment. Tetraethyl-orthosilicate (acros organics), etha-nol, protoporphyrin IX (sigma), montmorillonite (Saudi ceramics company). The molecular structure of pro-toporphyrin IX is represented in Figure 1.
2.2. Preparation of SiO2 Nanoparticles
[image:2.595.73.270.491.717.2]SiO2 nanoparticles were prepared by the acid catalyzed through the hydrolysis of tetraethyl-orthosilicate (TEOS) using the following method: 150 ml of TEOS was added to 155 ml of ethanol and 190 ml of H2O and stirred thor-oughly. The mixture was vigorously stirring for 1 h. 2:3 drops of the hydrochloric acid was added to the reaction mixture as a hydrolysis catalyst to adjust the pH value of alkoxide reaction system. After hydrolysis, the mixture becomes a clear sol. The sols were dried in Teflon dishes at room temperature. The obtained dry xerogels were heated at temperature of 25, 60, 100, 200˚C in air for 25 min in order to study the effect of annealing temperature
Figure 1. The structure formula of protoporphyrin IX.
2.3. Synthesis of Montmorillonite-Silica Core-Shell
1 g of Na-MMT was dispersed in 19 ml of distilled water to form well-dispersed slurry with magnetic stirring at room temperature for 24 h. the mixture was then stirring ultrasonic at 25 kHz and 100 Watt. 15 ml TEOS and 15 ml ethanol were added into the clay-water slurry. The pH was adjusted to 3 with hydrochloric acid. The admixture was stirred vigorously at 60˚C until a homogenous milk-white gel was formed. The gel was aged for several days to evaporate the solvents for further condensation reac-tion and then dried in a vacuum at 60˚C for 24 h. A rigid clay-silica was obtained by these treatments was ground into powder for the analysis.
2.4. Characterization
X-ray powder diffraction (XRD) was recorded on Diano Corporation USA diffractometer using Co-radiation ( = 0.179 nm), to study the crystal structure and crystallinity of the SiO2 nanoparticles. The surface properties namely BET surface area and mean pore radius (r) were deter-mined from N2 adsorption isotherm using conventional or classical volumetric apparatus. Surface Morphology and microstructure was investigated by TEM (Jeol JXA-840 electron probe microanalyzer). The UV-Vis absorp-tion was obtained with a (UVD-2960) labomed spectro-photometer. FT-IR was recorded using Jasco FT/IR spec-trometer in wavenumber range from 4000 - 400 cm−1.
2.5 Adsorption of Protoporphyrin IX Molecule on Silica and Clay-Silica Core-Shell
3. Results and Discussion
3.1. Characterization
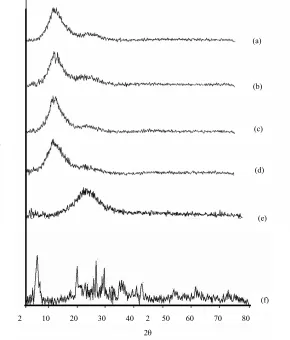
XRD patterns of the SiO2, Na-MMT and montmorillonite-silica nanocomposite are shown in Figure 2. The results show that there is any characteristic peaks of SiO2 and the appeared peaks are amorphous in nature. This indicates that the annealing temperature had no significant influence on the phase formation of the SiO2 nanoparticles till 200˚C. The results are in good agreement with that re-ported in lecture [15]. Figure 2(e) shows XRD patterns of the montmorillonite-silica core-shell. The figure shows the broad peak at 22˚ corresponds to the typical diffraction of amorphous SiO2 (Si-O short-order structure) [16]. The (001) diffraction peaks of Na-MMT at 6˚ are vanished, Figure 2(f), suggesting that clay platelets are delaminated during the sol-gel process.
FTIR spectra have been used to characterize the pre-pared samples, Figure 3. As shown in this Figure the two broad bands at 3470 and 1639 cm−1 are ascribed to the stretching modes and H-O-H bending vibration of the free or absorbed water. Strong absorptions at 1077, 798,
474 cm−1 indicate the formation of silica network. The absorption band at 1077 cm−1 attributed to Si-O-Si of the SiO4 tetrahedron and the absorption band at 474 cm−1 associated with Si-O-Si or O-Si-O bending mode. These observations afford proof of the generating silica nano- particles [12].
Figure 3(e) illustrates FT-IR spectra of clay -modified silica. After modification with clay, the bands at about 3470 cm−1 corresponds to the stretching vibration of sur-face hydroxyl groups, and the bands at 956 and 798 cm−1 attribute to the -OH bending vibration. The intensity of these characteristic bands of the surface hydroxyl groups increase indicating that the condensation reactions takes place not only between the silica sol particles themselves but also between the sol particles and hydroxyl groups on clay surfaces. A new band at about 545 cm−1 appears which is assigned to Al-O-Si of clay. The FT-IR spectra (Figure 3(e)) shows no obvious changes of the −OH bands at about 3627, 916 and 847 cm−1. These results suggest that surface hydroxyl groups of the clay were reacted with the hydrolyzed TEOS, and the resultant sil-ica is covalently attached on the clay surfaces [13].
(a)
(b)
In
ten
sity
(a.u
) (c)
(d)
(e)
(f)
2 10 20 30 40 2 50 60 70 80 2
[image:3.595.155.445.362.702.2]Figure 3. FTIR specrta of silica-25 (a), silica-60 (b), silica-100 (c), silica-200 (d) and clay-silica nanocomposite (e).
Figure 4 shows TEM images of pure silica and silica-clay samples. The compacted spherical morphology is clearly visible in the TEM images for all samples. Fig-ures 4(a)-(d) illustrate the TEM photographs of silica nanoparticles annealed at different temperatures. The average particle size for silica-25, silica-60, silica-100 and silica-200 was 27, 30, 65, and 202 nm, respectively.
As we seen, the average particle size increase by increas-ing temperatures.The main reason is that the growth of particles by increasing temperature. It is evident that the higher annealing temperature the narrower size distribu-tion was observed. This may be due to the lowered vis-cosity at higher temperatures, which increase the particle aggregation during precipitation process. The transmis-sion electronic micrographs (TEM) of the obtained clay-silica nanocomposites are shown in Figure 4(e). From the insets of this figure, it is evident that the final com-posite nanoparticles possessed core-shell morphology with diameter of 29 nm was obtained. This is easily un-derstood because more silica network was formed on the clay and surrounding the clay plates [13].
3.2. Nitrogen Adsorption-Desorption Measurements
The nitrogen adsorption-desorption isotherms are carried
out to investigate the surface morphology and physical properties of the silica samples annealed at different temperatures, Figure 5. A comparison between the hys-teresis loops of these samples indicates that they are of type H4 except for silica-200 for which a superposition of H3 loops is observed. The isotherm of silica-200 ( Fig-ure 5(d)) presents a type-H3 hysteresis loop ascribed to aggregates (loose assemblages) of plate-like particles forming slit-shaped pores [15]. All of the isotherms are closet in shape to type I because hysteresis occurs during the desorption branches, according to the BDDT classifi-cation [15]. However, there are noticeable differences in the shape of their hysteresis loops. However, silica-200 showed shape to type II.
Figure 5(e) shows the adsorption-desorption isotherm for clay-silica core shell. This Figure shows that the clay modified silica present a type-H3 hysteresis loop, which can be attributed to mesoporous structure containing open slit-shaped capillaries with wide bodies and narrow short necks [13].
The BET surface areas (SBET), total pore volumes (Vp) and average pore radius (r) for all examined samples are shown in (Table 1). It shows that pristine silica-25 has an obvious increase in surface area compared with the silica repared at different temperature [15]. The BET surface p
(a)
% Trans
m
ance
(a.
u)
(b)
(c)
(d)
(e)
(a) (b)
(c) (d)
[image:5.595.98.498.88.585.2](e)
Figure 4. TEM images for silica-25 (a), silica-60 (b), silica-100 (c), silica-200 (d) and clay-silica nanocomposite (e).
areas are decreased by increasing annealing temperature for silica samples due to increase aggregation of particle by increasing annealing temperature. The clay silica sample shows higher average pore width than that of the pure silica-200 (as shown in Table 2), indicating again macropores and interstices are formed between the silica particles, while mesoporous silica networks are formed in the latter case. Under the acid-catalyzed conditions the sol-gel process involves complete hydrolysis reaction, replacing alkoxide groups (−OC H ) with hydroxyl
groups (−OH), and subsequent condensation reactions between silanol groups (Si-OH) and hydroxyl groups located on the clay surfaces to form covalent bonds [15]. Meanwhile, the hydrolyzed TEOS also self condense to form large continuous silica networks with mesoporous structure, especially in the case of the high TEOS/clay. As a result, clay platelets are covalently attached with silica, and the growth of the mesoporous networks pene-trated into clay interlayer leads to the formation of the exfoliation structure of clay platelets. Measurements of 2 5
15000 x
500 nm
30000 x
500 nm
500 nm 500 nm
30000 x 60000 x
igure 5. Nitrogen adsorption-desorption isotherm for silica-25 (a), silica-60 (b), silica-100 (c), silica-200 (d) and clay-silica (e).
Table 1. Parameters resulting from the analysis of N2 adsorption isotherms of the silica samples.
Samples BET surface area (SBET, m2/g) Total pore volume (Vb, cm3g−1) Average pore width (r, A˚)
Silica-25 596.61 0.3498 1.47
Silica-60 451.04 0.3247 1.80
Silica-100 338.32 0.2476 1.83
Silica-200 338.32 0.0466 1.83
[image:7.595.294.535.213.494.2]Clay-silica core-shell 79.59 0.0763 2.40
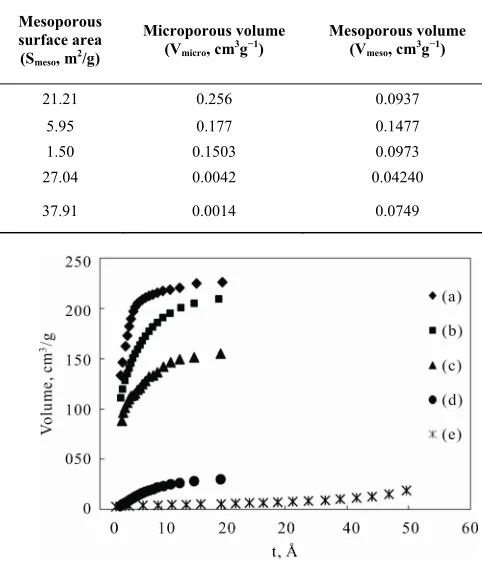
Table 2. Para s resulting from the t-analys l investigated samples.
Samples Pore surfac(S
t, m2/g) (Sext, m /g) surface area 2 surface area 2 (Vmicro, cm3g−1)
Mesoporous volume (Vmeso, cm3g−1)
meter is for al
e area 2 Microporous Mesoporous Microporous volume
(Smicro, m /g) (Smeso, m /g)
Silica-25 547.51 70.32 526.3 21.21 0.256 0.0937
Silica-60 354.35 102.6 348.4 5.95 0.177 0.1477
Silica-100 145.5 61.73 276.6 1.50 0.1503 0.0973
Silica-200 36.66 28.85 9.622 27.04 0.0042 0.04240
Clay-silica
core-shell 66.53 50.97 28.62 37.91 0.0014 0.0749
the pore size showed a decreased in pore size by increas-g annealinincreas-g temperature for pure silica reachinincreas-g the
t-Plot
t, of the physically adsorbed
ive pressure is estimated based in
mesoporous region. While for the clay-silica sample has a pore size around 2 nm, the clay-silica sample has a lar-ger amount of pores in the micropore region than in the mesopore region.
3.4. Analysis by
The statistical thickness, layer as a function of relat
on the de Boer equation given in equation [15]: 1/ 2
13.9 / 0.034 log Po
t P
(1)
The volume of gas adsorbed versus t k
then used for the pore analysis. Figure 6 shows two dis-nown as t-plot is
tinct linear stages in the t-plots, initial stage of adsorption
on the pore wall; intermediate stage is extrapolated to the adsorption volume ordinate, the positive intercept at the ordinate measures the micropore volume of the sample that have been filled by adsorbed molecules at the begin-ning of the intermediate stage. Similarly, the linear por-tion of the last stage measures the external surface area and the total pore volume exclusive of external surface pore volume [15]. Therefore t-plot analysis is more
ap-propriately used for the samples containing both micro-pores and mesomicro-pores [15]. The t-plot pore surface areas of
the silica samples and caly-silica, St, calculated from the slopes of the initial linear stage of t-plots are similar to the
corresponding BET surface areas except that for silica annealed at 100 and 200˚C (Table 2). The micropore pore volumes, VPORE,MICROPOROUS is large the corresponding
Figure 6. t-analysis for silica-25 (a), silica-60 (b), silica-100 (c), silica-200 (d) and clay-silica (e).
mesopore pore volumes, VPORE,MESOPOROUS (Table 2)
of micropores is due gaseous adsorption that occupies larger surface area cept silica annealed at 200 and clay-silica samples. This is not surprising as the pore filling
to
than the pore filling of mesopores with liquid-like capil-lary condensation. Table 2 shows also that, for all sam-ples external surface Sext areas are less than the corre-sponding BET surface areas. It can be noted that, if St (calculated from the initial slope) is considered as the total surface area arising from all pores, the microporous surface area Smic will be {St − (St,MESOPOROUS +
St,EXTERNAL)} that is 526, 348, 276, 9.6 and 28.6 m
2 /g for
silica prepared at 25, 60, 100, 200 and clay-silica, re-spectively. The total pore volume of the silica at 25˚C is found to be maximum, 0.349 cm3/g; and is minimum in
case of the silica at 200˚C, 0.0466 cm3/g. Also, the
largest, 0.256 cm3
/g. This agrees well with the
differ-ences in corresponding St surface areas.
3.5. Adsorption of Protoporphyrin IX Molecule on Nano Particles of Silica and Clay-Silica The adsorption process was carried out using silica nano
s
has n
practices pretreated at 25˚, 60˚, and 200˚C, as well a clay-silica nano particles. It was observed that silica-25
not ability to absorb the PPIX, there is no change i PPIX concentration in the medium till two days. Other samples: silica-60, silica-100 and silica-200 show slight capability to interact with PPIX. The efficiency of the adsorption process (% eff.) can be determined using the following equation:
o
o % c ceq 100
eff c
(2)
where c and c are t
d equ riumeq
[image:8.595.308.537.344.491.2]he concentration of PPIX at ini-tial an ilib time respectively, (m
Figure 7 shows the adsorption e
phyrin IX on different SiO2 surfaces after two days, as n
with 37% in
, the intensity of the sort band at 402 ± 0.5 nm w
0−5 mol/l) was studied on th
Figure 7. Dependence of adsor tion efficiency of protopor-phyrin IX on the annealing te rature of SiO2 samples
after 2 days. (SiO2 dosage = 1 g/l, initial pH 7, initial dye
concentration = 1.5 × 1 g/l).
fficiency of
protopor-functio of annealing temperature. Obviously, the silica-200 exhibited the highest adsorption efficiency
[image:8.595.315.533.553.695.2]2days, while silica-100 showed 34% and silica-60 showed 25% adsorption efficiency in the same test pe-riod. The silica-25 don’t show any change in adsorption in the same time. Also, it was observed that silica-200 show slight increase in its efficiency after the third day to attain 52%, while is no improvement of the efficiency of silica-60 and silica100. The highest adsorption efficiency of silica-200 in may be attributed to its large pore radius (7.6 nm) as observed in BET measurements, indicating that the pore of meso-type considers to the suitable void type permit the interaction of PPIX molecules with silica surfaces. Also, the surface area of mesopores increased dramatically when the annealing temperature increase to 200˚C.
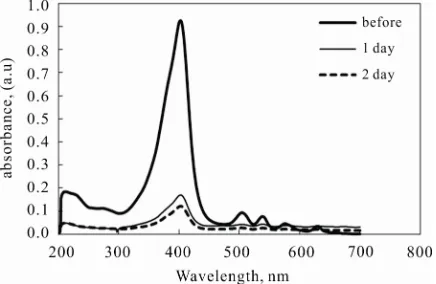
Figure 8 shows the UV-Vis absorption spectra of the PPIX in supernatant solution before and after the adsorp- tion on clay-silica nano particles at pH = 10. After ad- sorption
as decreased as expected due to the reduction in the PPIX concentration in solution due to their interaction with clay-silica nano particles.
The initial dye concentration is another important vari-able that can affect the adsorption process. The effect of initial concentration of protoporphyrin IX at pH = 10 were (10−4, 5 × 10⁻⁵ and 1.5 × 1
eir adsorption onto clay-silica powder under previously determined optimum conditions. The results, in terms of efficiency versus initial concentration of dye, are indi-cated in Figure 9. According to Figure 9, efficiency of PPIX increases by increasing dye concentration and
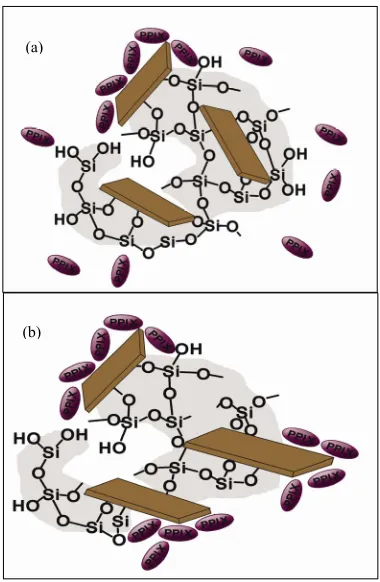
doesn’t change by increasing concentration up to 1.5 × 10⁻⁵ M. This may be attributed to the saturation of ad-sorption sites on clay-silica by dyes at this concentration. It was noted that the incorporation of clay with silica lead to increase in the mesopores surface area leading to maximize the interaction between PPIX and the clay- silica nano particles in point of view their rate and effi-ciency. We notes that the values of adsorption efficiency of the clay-silica nano particles at pH = 10 is better than the pure silica and clay and reaches to 87% at initial concentration (1 × 10⁻⁵ mol/l) of PPIX. This can be ex-plained on the bases of the dissolution of silica network surrounding the clay layers at pH = 10 and the clay plates become available for adsorption of PPIX [15], while in neutral and acidic medium (pH = 2) less clay surface is available to adsorb PPIX, as shown by the proposed structure model (Figure 10).
In order to investigate the adsorption equilibrium of the adsorption process, the concentration of PPIX was determined. The adsorbed amount of PPIX (qt) in mg/g
p mpe
0−5 mol/l). 34
36 38
Figure 8. UV-Vis spectra for PPIX before and after adsorp-tion on clay-silica (initial concentraadsorp-tion of PPIX = 1 × 10⁻⁵
M, pH = 10).
20 22 24 26 28 30 32
50 70 90 110 130 150 170 190 210
Annealing temperature, oC
Adsor
ptio
n efficiency (%
Figure 9. Effect of concentration on adsorption efficiency of PPIX on clay-silica samples. (clay-silica dosage = 2 g/l and pH = 10).
Figure 10. Schematic representation of proposed structure models of clay-silica nanocomposite after adsorption of PPIX (Co = 10 μM) at (a) neutral medium and pH = 2, and
(b) pH = 10.
dry sample, on the silica surfaces at any time (t) in min.,
can the calculated from the equation:
t
t
c c
q v
m
(3)
where is the PPIX concentration in the supernatant at any tim mg/l) v is the solution volume (l), and m is the
[image:9.595.77.267.278.569.2]weight of the dray sample (g).
Figure 11 shows the adsorption isotherm of PPIX onto clay-sil nano particles at pH=10 which was deter-mined by plotting the amount PPIX adsorbed by the nano particles (qeq) in mg/g dray sample versus the equilibrium
concentration of PPIX (ceq) in mg/l in solution. The
shape of this isotherm is corresponding to s-type, sub-group-3 according to Giles classification [13]. The s- curve indicates that there is a solute-solute attractive force of the surface. Also, it indicates that the sorption of PPIX may be inhabited by a competing reaction with the solution, such as a complexation reaction with the sur-faces. This means that the PPIX have low affinity to the-surface, but as soon as surface is covered by PPIX mole-cules, other molecules are adsorbed more easily. There are a second layer can formed readily, thus, it follows up the sub-group 3.
It is very important to establish the most appropriate correlation for the equilibrium data and optimize the ad-sorption system design to adsorb PPIX on clay-silica nano particles. Four common adsorption equilibrium models (Langmuir, Frundlish, Tembkin and Dubinin-Radushkevish) were tested. The adsorption data were analyzed according to the linear from the previous mod-els, the figures not included, and the correlation
coeffi-t
c
e (
ica
cient, R2 was determine which is follow the order:
[image:9.595.314.532.396.538.2]Figure 11. Adsorption isotherm of protoporphrin IX on clay -silica sample. (clay-silica dosage = 1g/l, initial pH = 10).
Figure 12. Temkin adsorption model for adsorption of pro-toporphyrin IX on clay-silica sample at pH = 10.
(a)
(b)
50 55 60 65 70 75 80 85 90
0 2 4 6 8 10
Ad
so
rp
tio
n efficie
ncy
(%)
[image:9.595.315.527.577.706.2]Temkin (0.88) > Dubinin-Radushkevich (0.76) > Fre- undlich (0.75) > Langmuir (0.32). According to R2 values, the most probable models can describe the interaction of PPIX on clay-silica nano particles is Temkin isotherm. It has generally been applied the following form [17].
eq eq Acq ln (4)
Their linear form can be expressed as:
eq eq A c
q ln ln (5)
where pe
is a constant, refers to the differential surface capacity r unit binding energy, ( RT b), T is
ab-solute temperature, R is the gas constant. is inversely propor o the heterogeneity and e tent of adsor-bate-adsobate interaction. The adsorption data can he analy ording to Equation 5. There e, a plot of ve us lnceq as shown in Figure 12, enable to
de-termine the constants A and
tional t zed acc rs x for eq q
. From slope of the ed the va
the
straight line obtain lue of can he obtained,
= 4. then the value of n he calculated from the intercept of the line with the coordinate, A = 3.654.
and clay-silica core-shell nanoparticle were fabri-cated by one-step catalyzed sol-gel method. The effect of temperature on properties of resulting silica was studied. The prepared samples were characterized using XRD, FT-IR, TEM and N2 adsorption. The obtained results showed that increasing temperature from 25 to 200˚C increase particle size and decease BET surface area due to the particle aggregation. As confirmed from TEM the clay-silica nanoparticles possessed core-shell morphol-ogy with diameter of 29 nm. The pore structure proper-ties such as external surface, microporous surface area,
t-analysis
s the highest adsorption efficiency du
(7.6 nm). The results of adsorption showed also that the y-silica nan ticles core-shell is better described by the model.
nc
277, A ca
4. Conclusion
Silica
mesoporous surface area, total pore volume, microspore volume, mesopore volume are evaluated using
method. It was found that the microporous surface area is 526, 348, 276, 9.6 and 28.6 m2
/g for silica prepared at 25,
60, 100, 200˚C and clay-silica, respectively. The adsorp-tion efficiency of the prepared samples for poroto- porphrin IX showed that SiO2 prepared at 200˚C ha
e to its large pore radius
adsorption of protoporphyrin IX on cla opar-Temkin
5. Acknowledgements
The authors very gratefully thank the King Abdulaziz City for Science and Technology for cooperation and support (AT-17-73).
REFERENCES
[1] R. Vacassy, R. J. Flatt, H. Hofmann, K. S. Choi and R. K. Singh, “Synthesis of Microporous Silica Spheres,” Jour-nal of Colloid and Interface Scie e, Vol. 227, No. 2,
2000, pp. 302-315.doi:10.1006/jcis.2000.6860
[2] F. Iskandar and O. K. Mikrajuddin, “In Situ Production of
Spherical Silica Particles Containing Self-Organized Me-
Letters, Vol. 1, No. 5, 2001, pp. 231-234.
155227 sopores,” Nano
doi:10.1021/nl0
[3] G. De, B. Karmakar and D. Ganguli, “Hydrolysis-Con- densation Reactions of TEOS in the Presence of Acetic Acid Leading to the Generation of Glass-Likesilica Mi-crospheres in Solution at Room Temperature,” Journal of Materials Chemistry, Vol. 10, 2000, pp. 2289-2293.
doi:10.1039/b003221m
[4] J. Zhang, Z. Liu, B. Han, Z. Li, G. Yang, J. Li and J. Chen, “Preparation of Silica and TiO2-SiO2 Core-Shell Nanoparticles in Water-in-Oil Microemulsion Using Com-pressed CO2 as Reactant and Antisolvent,” Journal of Supercritical Fluids, Vol. 36, No. 3, 2006, pp. 194-201.
doi:10.1016/j.supflu.2005.06.002
[5] A. Palaniappan, J. Zhang, X. Su and F. E. H. Tay, “Preparation of Mesoporous Silica Films Using Sol-Gel Process and Argon Plasma Treatment,” Chemical Physics Letters, Vol. 395, No. 1-3, 2004, pp. 70-74.
doi:10.1016/j.cplett.2004.07.060
[6] C. Pijolat, J.P. Viricelle, G. Tournier and P. Montmeat, “Application of Membranes and Filtering Films for Gas Sensors Improvements,” Thin Solid Films, Vol. 490, No.
1, 2005, pp. 7-16.doi:10.1016/j.tsf.2005.04.017
[7] M. H. Jo, J. K. Hong, H. H. Park, J. J. Kim, S. H. Hyun and S. Y. Choi, “Application of SiO2 Aerogel Film with Low Dielectric Constant to Intermetal Dielectrics,” Thin Solid Films, Vol. 308-309, 1997, pp. 490-494.
doi:10.1016/S0040-6090(97)00437-9
ley, C. Leveagle and J. H. Das, ties Following Rapid Thermal [8] B. J. O’sullivan, P. K. Hur
“Si-SiO2 Interface Proper
Processing,” Journal of Applied Physics, Vol. 89, No. 7, 2001, pp. 3811-3821.doi:10.1063/1.1343897
[9] M. Ritala, K. Kukli, A. Rahtu, P. Risnen, M. Leskel, T. Sajavaara and J. Keinonen, “Atomic Layer Deposition of Oxide Thin Films with Metal Alkoxides as Oxygen Sour- ces,” Science, 0, pp. 319-321.
doi:10.1126/scVol. 288, No. 5464, 200ience.288.5464.319
[10] S. Tanaka, N. Nishiyama, Y. Oku, Y. Egashira and K. Ueyama, “Nano-Architectural Silica Thin Films with Two-Dimensionally Connected Cagelike Pores Synthe-sized from Vapor Phase,” Journal of the American Che- mical Society, Vol. 126, No. 15, 2004, pp. 4854-4858.
doi:10.1021/ja039267z
[11] H. Yang, N. Coombs, I. Sokolov and G. A. Ozin, “Free- Standing and Oriented Mesoporous Silica Films Grown at the Air-Water Interface,” Nature, Vol. 381, No. 6583, 1996, pp. 589-592.doi:10.1038/381589a0
309-312.doi:10.1016/j.matchemphys.2008.09.056 [13] Z. Qian, G. Hu, S. Zhang and M. Yang, “Preparation and
Characterization of Montmorillonite-Silica Nanocompo-sites: A Sol-Gel Approach to Modifying Clay Surfaces,”'
Physica B, Vol. 403, No. 18, 2008, pp. 3231-3238.
doi:10.1016/j.physb.2008.04.008
[14] J. Sun, L. Qiao, S. Sun and G. Wang, “Photocatalytic Degradation of Orange G on Nitrogen-Doped TiO2 Cata-lysts under Visible Light and Sunlight Irradiation,” Jour-nal of Hazardous Materials, Vol. 155, No.
1-312-319.doi:10.1016/j.jhazmat.2007.11.062 2, 2008, pp. [15] P. S. Singh, “High Surface Area Nanoporous Amorphous Silica Prepared by Dodecanol Assisted Silica Formate
Sol-Gel Approach,” Journal of Colloid and Interface Sci-ence, Vol. 325, No. 1, 2008, pp. 207-214.
doi:10.1016/j.jcis.2008.05.037
[16] K. M. S. Meera, R. M. Sankar, A. Murali, S. N. Jaisankar and A. B. Mandal, “Sol-Gel Network Silica/Modified Montmorillonite Clay Hybrid Nanocomposites Hydro-phobic Surface Coatings,” Colloids and Surfaces B: Bio-interfaces, Vol. 90, 2012, pp. 204-210.
doi:10.1016/j.colsurfb.2011.10.018