In vivo measurement of skin microrelief using photometric
stereo in the presence of interreflections
Ali Sohaib,
1,∗Abdul R. Farooq,
1Gary A. Atkinson,
1Lyndon N. Smith,
1Melvyn
L. Smith,
1and Robert Warr
21Machine Vision Laboratory, University of the West of England,
Bristol, BS16 1QY, UK
2Department of Plastic Surgery, North Bristol NHS Trust,
Bristol, UK
∗Corresponding author: [email protected]
This paper proposes and describes an implementation of a novel photometric stereo based technique for in vivo assessment of three-dimensional (3D) skin topography in the presence of interreflections. The proposed method illuminates skin with red, green, and blue colored lights and uses the resulting variation in surface gradients to mitigate the effects of interreflections. Experiments were carried out on Caucasian, Asian and African American subjects to demonstrate the accuracy of our method and to validate the measurements produced by our system. Our method produced significant improvement in 3D surface reconstruction for all Caucasian, Asian and African American skin types. The results also illustrate the differences in recovered skin topography due to non-diffuse Bidirectional reflectance distribution function (BRDF) for each color illumination used, which also concur with the existing multispectral BRDF data available for skin. c 2012 Optical Society of America
OCIS codes: 150.6910, 290.1483, 330.4300.
1. INTRODUCTION
Since the emergence of photometric stereo [1], the technique has developed into a recognized ap-proach for three dimensional 3D object shape recovery using a relatively simple methodology.
The classical application of photometric stereo has been based on the interaction of collimated, uniform lighting with continuous smooth, Lambertian (diffusely reflective) surfaces. Photometric
differences only in the source lighting directions. Most often this is achieved by a form of tempo-ral multiplexing. That is, light is provided at different times from differently positioned sources, to allow the acquisition system to capture shaded images in isolated channels [2]. From this we can resolve the surface gradient and reflectance of the surface under inspection [3, 4] at a pixel or even sub-pixel resolution. However, accurate estimates of object geometry require that the surface reflectance properties and lighting conditions are known a priori and also assumes that the surface reflection is Lambertian.
The interreflection problem is a result of direct and indirect light reflection at the surface. Most concave surfaces exhibit such behavior, as light bounces multiple times between patches on the surface before returning to the viewer. This phenomenon creates problems for shape for shading techniques, which for a given albedo assume that the surface normal alone at a point defines the reflected radiance. On the other hand, the presence of interreflections can help resolve bas-relief ambiguity [5] and this is particularly useful in uncalibrated photometric stereo techniques where lighting properties are unknown [6].
Interreflections are also strongly dependent on surface albedo as investigated by Forsyth [7]. Ob-jects with higher albedo values experience more interreflections than ones with lower albedo. Liao [8] used this distinction to separate direct and indirect reflected light by using colored lights to vary surface albedo. However they did assume surface reflection to be Lambertian, which is also a prevailing assumption associated with skin when using shape from shading algorithms.
Nayar [9] proposed an iterative algorithm that refines an estimate of the actual shape and reflectance from an initial erroneous shape and reflectance approximation of a Lambertian surface. Most work related to interreflection has been aimed at opaque Lambertian objects, with the most relevant work done regarding interreflections in skin being based on the analysis of skin replicas [10, 11]. The reflectance properties of replicas tend to be very different to that of skin. Replicas are often opaque while skin on the other hand is translucent and has complex reflectance properties which not only depend on the wavelength of light used but also on the type of skin (Asian, Caucasian etc.) under inspection [12, 13].
color [16–18].
Infrared light has already been proven to offer advantage over white light [19] for skin imaging and was reported to exhibit a more diffuse reflection than visible light, suggesting a difference in BRDF between infrared and visible light. This paper further investigates the effects of change in illumination color in the visible spectrum on accuracy of 3D reconstruction of different skin types using photometric stereo. The following is a summary of key contributions of this paper.
1. To the best of our knowledge, no published work has so far looked into the quantitative as-sessment of 3D skin microrelief using photometric stereo. Much of the analysis concerning the accuracy of skin microrelief is visually qualitative. The skin topography measurements presented in this paper were validated using the PRIMOS 4 device and detailed experiments were performed with different skin types to determine the amount of error in surface nor-mals and reconstructed height for each individual color(R, G, B) and white light caused by differences in BRDF.
2. Earlier work regarding the surface accuracy analysis between infrared and white light showed that infrared was superior in capturing accurate skin topography to white light [19]. This paper further contributes to the state-of-the-art by explaining the reasons for inaccurate acquisition of skin topography while using white light.
3. The development of a new technique for minimizing surface errors due to interreflection in the presence of wrinkles.
4. The development of a practical low-cost 3D capture system for static analysis of skin mi-crorelief , which has its applications in efficacy evaluation of cosmetic treatments, surgical procedures and lesions analysis. The acquisition time of this system is shorter than most available commercial systems, has both a large field of view and depth of field, which allows observation of small scale variations (pores) to large wrinkles.
The following sections discuss issues concerning skin optics, skin reflectance and the BRDF of skin, as they are important factors in understanding the interreflection problem in skin and will form the basis of our proposed technique in order to diminish its effects.
2. SKIN OPTICAL CHARACTERISTICS
how much light is reflected back and how diffusely it is reflected.
Skin is not homogeneous and has complex optical properties. Aspects such as depth of penetra-tion, scattering and absorption vary considerably as the wavelength varies from 400nm to 600nm [12]. Depth of penetration is the distance traveled by light before falling to (1/e) 37% of its initial value. For the range of wavelengths defined by the LEDs and filter used in our device, the depth of penetration for blue, green and red light is approximately 0.7mm, 0.9mm and 1.6mm respectively [12]. The variation is due to an increase in absorption at shorter wavelengths. Absorption in skin is mainly due to melanin and blood (oxy and deoxy-hemoglobin) in the epidermal and dermal layers and decreases as the wavelength increases in the visible spectrum [22, 23].
There are some differences in how diffusively skin reflects light based on wavelength. There is diffuse reflection due to interface roughness at the dermal-epidermal interface and shorter wave-lengths (blue-green) are more sensitive to this than longer (red) wavewave-lengths due to their lower penetration depth [24]. Longer wavelengths (red) are however more affected by multiple scatter-ings in the dermal layers; which consists predominantly of blood - due to absorption in the shorter wavelengths.
400 450 500 550 600 650 700
0 0.1 0.2 0.3 0.4 0.5 0.6 0.7 0.8 0.9 1
Wavelength [nm]
Reflectance
Light Caucasian Dark Caucasian Asian African American
Fig. 1. (Color online)Multispectral reflectance of different skin types (NCSU skin reflectance data [25]).
3. MULTISPECTRAL REFLECTANCE OF SKIN
[image:4.595.199.412.397.607.2]has the highest reflectance. This decreases as the wavelength of light decreases towards the blue part of the spectrum. This variation in reflectance as a function of wavelength is very important, as the inter-reflection phenomenon is closely related to the surface albedo/reflectance. The algorithm defined in section 7 utilizes this variation to acquire more accurate depth estimates for concave parts of the skin. Areas such as grooves/wrinkles in the skin are most susceptible to interreflections as the hollow rounded/v-shaped geometry force light to bounce multiple times before reaching the camera sensor. However at shorter wavelengths the skin absorbs more light which increases the chances of absorption of a photon after interreflection, unlike at longer wavelengths, where the chances of photons reaching the camera sensor are greater as the skin absorption is lower.
4. BRDF OF SKIN AS A FUNCTION OF WAVELENGTH
The BRDF describes how light is reflected from a surface. Its accurate description can improve the accuracy of shape from shading algorithms, such as photometric stereo, which assumes that the surface under inspection reflects light equally in all directions. BRDF is a function of incoming and outgoing light directions relative to the surface orientation. Also, it is a function of wavelength, as some materials absorb, reflect and transmit each wavelength differently. This is very much the case for skin. The BRDF function is written as:
BRDF(θi,φi,θo,φo,x,y,λ) (1)
Whereθx andφxrepresent incoming and outgoing direction in spherical coordinates, x and y
rep-resent spatial position and λ the wavelength. In its basic form, photometric stereo assumes that the surface under inspection has diffuse reflectance at all wavelengths, which is not the case for skin. Most of the reported BRDF/BTF (Bidirectional Texture Function) measurements done for skin represent aggregates over the visible spectrum [26–28] and ignore variation in BRDF at spe-cific wavelengths in the visible spectrum. The measurements done by [29, p. 2] were over 390nm to 710nm. These measurements were for a single reflected angle in order to see the variation in skin reflectance over the spectrum and did not take into account the variation for a wider range of reflection angles. Measurements undertaken by [30] were over 544nm and 633nm wavelengths using a CASIR scatterometer device.The device has an advantage of covering a range of incidence and reflected angles and provides a better understanding of the skin BRDF. These measurements show that there is considerable variation in BRDF of skin for these wavelengths.
5. MATERIALS AND METHODS
5.A. Photometric Stereo Setup and Acquisition
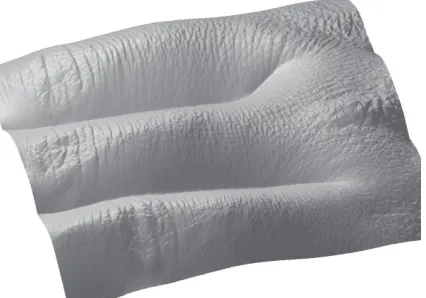
Fig. 2. (Color online)(a) The 3D skin macro and microrelief on the back of the hand
acquired using our photometric stereo device.
a 10.6mm depth of field and is able to recover both micro and macro 3D topography of skin as shown in Fig. 2.
The LEDs used were 40 Watt color LEDs LZC-A0MD40 from LedEngin. These consist of a single emitter comprised of red, green, blue and white individually addressable dies. The dominant wave-length for each color light is 462nm, 523nm and 625nm. The photometric stereo rig is designed to capture 12 images, four from each red, green and blue channel.
5.B. Camera Calibration
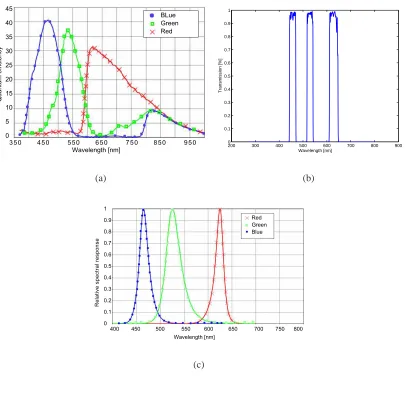
The camera used in this experiment had a Kodak KAI-1020 sensor and its spectral response is shown in Fig. 3. The spectral response shows an overlap between each color channel, there is vari-ation in quantum efficiency for each channel and the sensor is sensitive between ultraviolet and infrared regions. In view of these constraints our imaging system was calibrated for color correc-tion and channel cross talk minimisacorrec-tion.
Color correction is an important step in camera calibration as it allows to get a device independent color space from a device dependent color space. It is usually performed by applying a 3-by-3 color correction matrix (CCM) to the sensor R’G’B’ data [31, 32]. For the camera used in this experiment, a device independent sRGB space was chosen and a CCM was formulated by min-imising the RMS difference between measured and original values of each color block in the 24 patch MacBeth ColorChecker chart.
[image:6.595.200.413.126.275.2]cross talk was minimised by using a Semrock FF01-457/530/628-23.3-D triband filter. The filter also keeps the spectral response of the LEDs to a relatively narrow range of wavelengths as shown in Fig.3 (b) and cuts off the response of the camera below 450nm (close to ultraviolet) and above 650nm in the infrared region.
BLue Green Red 45 40 35 30 25 20 15 10 5 0
3 5 0 4 5 0 5 5 0 6 5 0 7 5 0 8 5 0 9 5 0 Wavelength [nm] Quan tu m e ffici en cy (a)
200 300 400 500 600 700 800 900 0 0.1 0.2 0.3 0.4 0.5 0.6 0.7 0.8 0.9 1 Wavelength [nm] Transmission [%] (b) R e la ti v e s p e c tr a l re s p o n s e Wavelength [nm]
400 450 500 550 600 650 700 750 800 1 0.9 0.8 0.7 0.6 0.5 0.4 0.3 0.2 0.1 0 Red Green Blue (c)
Fig. 3. (a) CCD spectral response. (b) Triband filter response. (c) Spectral response
of the LEDs
[image:7.595.106.511.207.600.2]after scaling the exposure time. Both these methods have their own drawbacks, an increase in gain also increases the quantization noise [34] while an increase in exposure time increases the signal dependent shot noise. We compared the error in reconstructed height for skin resulting due to both quantisation and shot noise. The error in reconstructed height was relatively less when the exposure time was varied and hence was selected for further analysis. Consequently, the exposure times for red and green light was kept longer than the blue and was controlled by varying the integrating time of sensor. The sensor uses an electronic shutter and has light shielded areas to accumulate and transport the charges at the end of the integration period. A microcontroller was used to precisely control the integration times for each color light. Overall, this technique keeps the signal quantization errors to a minimum and also avoids reduction in the signal to noise ratio. Keeping in view the wavelength range limited by the triband filter, the patches in the last row of the MacBeth ColorChecker chart can be considered nearly spectrally neutral, meaning they reflect all color bands equally. These patches were used to see whether the CCD recorded equal intensities of each red, green and blue light after calibration for differences in quantum efficiency.
5.C. Skin Replica and Ground Truth
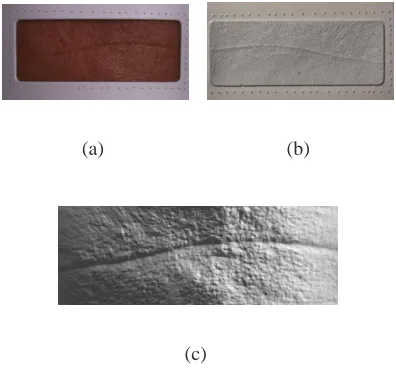
Twenty two subjects were selected for this experiment; among them, ten were Caucasians, eight Asians and four African American. Only subjects with no history of skin condition/allergy with visible wrinkles on their forehead were selected. The measurements were done for all subjects in a cool dry place with constant temperature. The subjects were strictly advised not to use any makeup or moisturisers on their face and to make sure the skin surface was free of dust particles and sweat, the skin was gently wiped with a dry swab as dust particles or sweat can cause imperfection in the replica and in the recovered shape. The subjects were also asked to keep their eyes closed as it can alter the depth of wrinkles. The procedure involved imaging the skin directly using our photometric stereo device and then by producing a corresponding replica for the same skin location for each subject as shown in Fig. 4. All replicas were made using the SILFLOR impression material. The
material has excellent flow and hardening characteristics, can reproduce very fine skin texture and has been widely used before for very fine replication of skin features [35–37]. The replica produced for each corresponding skin patch in the experiment gave a negative height of the skin i.e. wherever there is a wrinkle in the skin, the replica produced a peak. These replicas were then imaged using a PRIMOS 4R device and used as a ground truth. This PRIMOS device is based on the principle of structured light 3D imaging and has already proven to work for wrinkles and scar evaluation and for efficacy testing of skin treatments [38–41]. Its acquisition time is<100ms
(a) (b)
(c)
Fig. 4. (Color online)(a) Forehead wrinkle directly imaged using photometric stereo device. (b) Corresponding replica. (c) 3D reconstruction of skin images taken in
vivo.
in projected pattern to recover height information. Hence the measurements from this device were used to verify the in vivo measurements produced by our photometric stereo device.
The PRIMOS device has different spatial resolution and has a small measurement area compared to our device. First overlapping regions from both devices were extracted by using markers that were added at the boundary of the replica as shown in Fig. 4 (a) and (b). The data from Photometric stereo was then interpolated by using PRIMOS data as reference and finally the registration of both 3D data sets was achieved using the iterative closest point algorithm [43].
6. ERROR ANALYSIS
[image:9.595.207.405.131.321.2]0 2 4 6 8 10 12 14 16 -0.4 -0.3 -0.2 -0.1 0 0.1 0.2 0.3 Length [mm] Height [mm] Ground truth(PRIMOS) Profile-red light Profile-green light Profile-blue light Profile-white light Profile-our method (a)
0 2 4 6 8 10 12 14 16 18 0 0.005 0.01 0.015 0.02 0.025 0.03 0.035 0.04 0.045 0.05 Length [mm] RMS error (b)
0 2 4 6 8 10 12 14 16 18 0 0.005 0.01 0.015 0.02 0.025 0.03 0.035 0.04 0.045 0.05 Length [mm] RMS error (c)
0 2 4 6 8 10 12 14 16 18 0 0.005 0.01 0.015 0.02 0.025 0.03 0.035 0.04 0.045 0.05 Length [mm] RMS error (d)
0 2 4 6 8 10 12 14 16 18 0 0.005 0.01 0.015 0.02 0.025 0.03 0.035 0.04 0.045 0.05 Length [mm] RMS error (e)
0 2 4 6 8 10 12 14 16 18 0 0.005 0.01 0.015 0.02 0.025 0.03 0.035 0.04 0.045 0.05 Length [mm] RMS error (f)
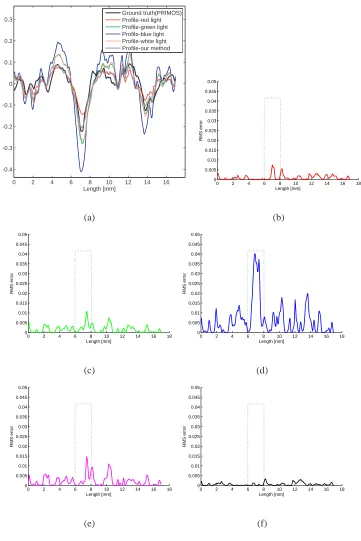
[image:10.595.129.490.132.673.2]Since white light is an aggregate of all three colors it also overestimated the wrinkle depth as it has one part of red and two parts of green and blue combined.
Integration of surface normal data can introduce errors in the reconstruction of the surface. An analysis of surface slant angles without integration was carried out. At the wrinkled region and with reference to the slope estimation shown in Fig. 6, it is evident that the over and underestimation of surface normals from the three primary color lights still occurs and the error in reconstructed height is not just due to the integration method used. To minimize the error, our proposed method makes use of spectral variation of surface normals in gradient space, consequently making it free of integration method used.
25 30 35 40
-60 -40 -20 0 20 40 60 Position S lo p e An gl e[ d eg ] Slope-red light Slope-green light Slope-blue light Slope Ground truth
(a)
25 30 35 40
40 45 50 55 60 65 70 75 Position S lo p e An gl e[ d eg ] Slope-red light Slope-green light Slope-blue light Slope Ground truth
(b)
Fig. 6. (Color online)(a) Over and underestimation of slope from each (R, G, B) light at the wrinkled region (valley). The mid region data value rise represents low-est point of valley of wrinkle where slope changes sign. (b) Increased scale to show differences in slope from one side of valley.
7. SURFACE NORMAL MAPPING IN GRADIENT SPACE
[image:11.595.106.505.300.531.2]p q
[image:12.595.182.434.121.300.2]Gradients from green light Gradients from red light
Fig. 7. Gradient map obtained from red and green light (The center cluster of a lighter shading represents the group of gradients from red light).
red light, this is mainly due to a smoothing effect under red light and the opposite effect under green light. By controlling the amount of spread in gradients from red light we can resolve a surface which has the right balance of high and low frequency data. This has been achieved by altering the orientation of the gradients from the directions obtained under red light towards the directions obtained under green light.
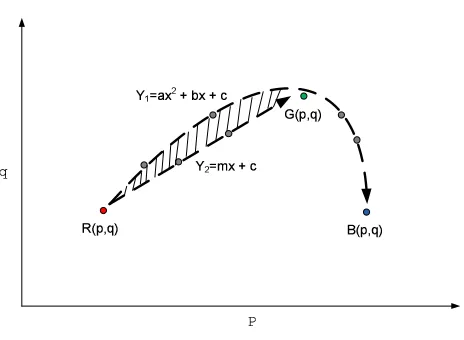
By fitting linear and quadratic functions between gradients recovered from each R, G, B light (R(p,q) , G(p,q)and B(p,q)), a bounding region is obtained as shown in Fig. 8. This bounded region provides the search space for finding the optimal gradient for each point. By defining a constraint in the Fourier domain the optimal point lying in the bounded region is obtained. This results in emulation of a surface that is closer to the ground truth.
The selection of an optimum point for each normal is difficult as the movement of gradients from red towards green is different for each point in the gradient map and for each skin type. Dong and Liang [44, 45] used Fourier analysis to obtain a perfect synthetic gradient map of a Lambertian surface and determined a constraint to extract diffuse components for different reflectance models. We use this constraint to find the optimum point in the gradient map that is closer to the ground truth for each skin type.
Given a surface described as a height function:
[image:13.595.192.424.116.286.2]
Fig. 8. Movement of gradients from red light towards the green. The gradient set is calculated in the region bounded between quadratic and linear fits.
At a given point on a surface S(x,y)the gradients in x and y directions are given as:
grad(S(x,y)) = (p(x,y),q(x,y)) = [∂z(x,y)
∂x ,
∂z(x,y)
∂y ]
By taking the Fourier transform (F) of each pair of surface gradients p(x,y)and q(x,y)we get
their corresponding expressions in frequency domain P(c, r), Q(c, r).
F(p(x,y)) =P(c,r) =icH(c,r) (3)
F(q(x,y)) =Q(c,r) =irH(c,r) (4)
Where H(c,r)is the Fourier transform of the surface height map S(x,y)and(c,r)represents the 2D spatial frequency coordinate. From Eq. (4) and (5)
rP(c,r) =cQ(c,r) (5)
Given the location of two points pr(x,y), qr(x,y)and pg(x,y), qg(x,y)in gradient space from red
and green light respectively (Subscripts r and g are for red and green light), the gradients from red light are moved towards the green and a new location is acquired at pp(x,y), qq(x,y). By using a
quadratic and linear fit function a new set of gradients is obtained for each point in the gradient map.
P1...s(x1,y1)...P1...s(xm,yn)and Q1...s(x1,y1)...Q1...s(xm,yn) (6)
Where m×n is the total number of points in the gradient map, s represents the number of points
condition below proposed by Dong, we find the optimum gradient map from the set of gradients in (7).
|rP(c,r)−cQ(c,r)| (7)
An inverse Fourier transform is taken of the optimum gradient map from (8) and integrated to get the resultant height map. Fig. 5 shows a profile of the resultant height obtained. Our method emulates a surface that lies between the surfaces obtained from red and green light and is thus closer to the ground truth. It also minimizes the underestimation of wrinkle depth and improves the overall accuracy in recovery of surface data for all Caucasian, Asian and African American skin types, as shown in Table 1 and 2.
8. VALIDATION OF OUR METHOD
The proposed technique uses gradients from red light as a base as it already has the minimum error in reconstructed height. It produces maximum variation at the wrinkled regions of the skin to compensate for underestimation of depth, however at relatively flatter parts of the skin it keeps the variation to a minimum, consequently keeping the estimated height close to the ground truth as shown in Fig. 5. The method was tested on all subjects and the RMS error in height and
l2-Table 1. Mean and standard deviation (SD) of RMS error in height for each skin
type and the corresponding light used.
RMS error
Red light Green light Blue light White light Our method
Caucasian Mean 1.3150 1.5212 2.2487 1.5105 0.7174
SD 0.8565 0.9852 1.3722 0.9573 0.5180
Asian Mean 1.3507 1.5409 3.02613 1.7294 0.7277
SD 0.7797 0.9549 1.7022 1.0587 0.4911
African American Mean 3.7145 5.7687 7.2140 5.7087 3.3183
SD 1.5353 1.1518 1.5821 1.2263 0.7594
[image:14.595.76.537.509.663.2]Table 2. Mean and standard deviation (SD) of l2-norm error for all skin types and the corresponding light used.
l2-norm error
Red light Green light Blue light White light Our method
Caucasian Mean 0.1741 0.2162 0.3197 0.2073 0.1106
SD 0.1263 0.0935 0.1997 0.0806 0.0611
Asian Mean 0.2112 0.3357 0.3936 0.3527 0.1627
SD 0.1333 0.1920 0.2207 0.2045 0.0885
African American Mean 0.4881 0.6914 0.8066 0.6897 0.4161
SD 0.1274 0.1490 0.1739 0.1439 0.1353
9. DISCUSSION
The results in section 8 demonstrate the effectiveness of our method and also shows that for overall skin geometry red light is less prone to error in comparison to using green, blue and white light, as its accuracy suffered only at concave parts of the surface. However, the RMS and l2-norm error clearly indicate that our technique further reduced the error when compared to each red, green, blue and white light.
The availability of multispectral skin BRDF data is scarce, as most measurements are taken using white light for a limited set of incoming and outgoing angles. There are currently no datasets that show dense BRDF measurements for different types of skin, over a range of wavelengths. Knowledge of skin BRDF is not only important for realistic skin renderings but also for accurate 3D reconstruction of skin, as shape from shading algorithms are dependent on how light is reflected from the surface and how light distribution varies as a function of wavelength.
10. CONCLUSION
It is evident from the results that the BRDF of skin is not Lambertian in the visible part of the spectrum. Our findings that a lack of diffuse reflection when imaging using the green light and that a relativity diffuse behavior exhibited under red light, adheres to the BRDF measurements pro-duced by [30]. However, although there is no skin BRDF data for the blue part of the spectrum, the further decrease in depth of penetration and increase in absorption from 523nm to 462nm suggests a reduction of diffuse light reflection and increase in the specular component. This variation in BRDF also explains the variation in shape estimation from each color light at the concave parts of the skin where we found both over and under estimation of depth.
The use of white light for imaging skin using photometric stereo proved to be less effective than using lights in the red or infrared regions. Because white light is an aggregate of red, green and blue parts of the spectrum, the accuracy of the surface data obtained suffered due to the non-diffuse BRDF, especially at green and blue part of the visible spectrum.
We have presented a technique for minimizing the effects of interreflection in skin with topographic features and varying reflectance and BRDF. Results were verified using ground truth data from a PRIMOS 4 device which show improvement in surface reconstruction for both light and dark skin subjects after using our method. Our photometric stereo based 3D capture system has proved to be an efficient skin microrelief imaging device, it is low-cost and requires less acquisition and calibra-tion time and also has a much larger field of view compared to other commercial skin microrelief imaging systems and can be used for in vivo measurement and quantitative analysis of skin relief. In future the experimental work will be extended by using polarizer’s to separate diffuse from specular reflection over the visible spectrum in order to get more accurate skin topography.
ACKNOWLEDGEMENTS
The authors would like to thank Jeffrey Bamber and Nigel Bush at the Institute of Cancer Research, Sutton, UK for allowing us to use the PRIMOS device.
References
1 R. J. Woodham, “Photometric stereo: A reflectance map technique for determining surface orientation from image intensity,” in “Proceedings of the Society of Photo-Optical Instrumen-tation Engineers Conference on Image Understanding Systems and Industrial Applications,”
, vol. 155 (1978), pp. 136–143.
2 M. L. Smith and L. N. Smith, “Dynamic photometric stereo-a new technique for moving
surface analysis,” Image and Vision Computing 23, 841–852 (2005).
of human skin using colour photometric stereo: with particular application to pigmented le-sion analysis,” Skin Research and Technology 14, 173–179 (2008).
4 A. R. Farooq, M. L. Smith, L. N. Smith, and S. Midha, “Dynamic photometric stereo for on line quality control of ceramic tiles,” Computers in Industry 56, 918–934 (2005).
5 M. Chandraker, F. Kahl, and D. Kriegman, “Reflections on the generalized bas-relief ambi-guity,” in “Computer Vision and Pattern Recognition,” , vol. 1 (2005), pp. 788–795.
6 A. Yuille, D. Snow, R. Epstein, and P. Belhumeur, “Determining generative models of objects
under varying illumination: Shape and albedo from multiple images using SVD and integra-bility,” International Journal of Computer Vision 35, 203–222 (1999).
7 D. Forsyth and A. Zisserman, “Mutual illumination,” in “Computer Vision and Pattern Recog-nition,” (1989), pp. 466–473.
8 M. Liao, X. Huang, and R. Yang, “Interreflection removal for photometric stereo by using spectrum dependent albedo,” in “Computer Vision and Pattern Recognition,” (2011), pp. 689– 696.
9 S. K. Nayar, K. Ikeuchi, and T. Kanade, “Shape from interreflections,” International Journal of Computer Vision 6, 173–195 (1991).
10 T. Yamada, H. Saito, and S. Ozawa, “3D reconstruction of skin surface from image se-quence,”in “IAPR Workshop on Machine Vision Applications,” (1998).
11 A. Matsumoto, H. Saito, and S. Ozawa, “3D reconstruction of skin surface from photometric stereo images with specular reflection and interreflection,” Electrical Engineering in Japan
129, 51–58 (1999).
12 A. N. Bashkatov, E. A. Genina, V. I. Kochubey, and V. V. Tuchin, “Optical properties of human skin, subcutaneous and mucous tissues in the wavelength range from 400 to 2000 nm,” Journal of Physics D: Applied Physics 38, 2543–2555 (2005).
13 R. R. Anderson and J. A. Parrish, “The optics of human skin,” Journal of Investigative Der-matology 77, 13–19 (1981).
14 T. Chen, M. Goesele, and H. P. Seidel, “Mesostructure from specularity,” in “Computer Vision and Pattern Recognition,” , (2006), pp. 1825 – 1832
16 Y. Zhou, M. Smith, L. Smith, and R. Warr, “Combinatorial photometric stereo and its ap-plication in 3D modeling of melanoma,” Machine Vision and Apap-plications 23, 1029–1045 (2012).
17 T. Malzbender, B. Wilburn, D. Gelb, and B. Ambrisco, “Surface enhancement using real-time photometric stereo and reflectance transformation.” in “Rendering Techniques,” (Eurograph-ics Association), pp. 245–250. (2006)
18 J. A. Paterson, D. Claus, and A. W. Fitzgibbon, “BRDF and geometry capture from extended inhomogeneous samples using flash photography,” Computer Graphics Forum 24, 383–391 (2005).
19 M. F. Hansen, G. A. Atkinson, L. N. Smith, and M. L. Smith, “3D face reconstructions from photometric stereo using near infrared and visible light,” Computer Vision and Image
Under-standing 114, 942–951 (2010).
20 D. E. Barker, “Skin thickness in the human,” Plastic and Reconstructive Surgery 7, 115–116
(1951).
21 Y. Lee and K. Hwang, “Skin thickness of Korean adults,” Surgical and Radiologic Anatomy
24, 183–189 (2002).
22 V. Barun, A. Ivanov, A. Volotovskaya, and V. Ulashchik, “Absorption spectra and light pen-etration depth of normal and pathologically altered human skin,” Journal of Applied Spec-troscopy 74, 430–439 (2007).
23 A. Krishnaswamy and G. V. Baranoski, “A biophysically-based spectral model of light inter-action with human skin,” Computer Graphics Forum 23, 331–340 (2004).
24 J. F. Federici, N. Guzelsu, H. C. Lim, G. Jannuzzi, T. Findley, H. R. Chaudhry, and A. B. Rit-ter, “Noninvasive light-reflection technique for measuring soft-tissue stretch,” Applied Optics
38, 6653–6660 (1999).
25 M. J. Vrhel, R. Gershon, and L. S. Iwan, “Measurement and analysis of object reflectance spectra,” Color Research and Application 19, 4–9 (1994).
26 K. J. Dana, “BRDF/BTF measurement device,” in “International Conference on Computer Vision,” , vol. 2 (2001), pp. 460–466.
28 S. R. Marschner, S. H. Westin, E. P. F. Lafortune, K. E. Torrance, and D. P. Greenberg, “Image-based BRDF measurement including human skin,” in “Eurographics Workshop on Rendering,” , (1999), pp. 139–152.
29 E. Angelopoulou, “The reflectance spectrum of human skin,” Tech. rep., University of Penn-sylvania (1999).
30 B. Koch, “A multispectral bidirectional reflectance distribution function study of human skin for improved dismount detection,” Master’s thesis (2011).
31 B. K. Park, W. Choe, J. Lim, S. Lee, and C. Kim, “Color correction with edge preserving and minimal SNR decrease using multi-layer decomposition,” IS & T/SPIE Electronic Imaging
pp. 829613–829613–7 (2012).
32 C. Chao, H. Y. Tu, K. Y. Chou, P. S. Chou, F. L. Hsueh, V. Wei, R. J. Lin, and B. C. Hseih,
“Crosstalk metrics and the characterization of 1.1µm-pixel CIS,” in “International Image Sen-sor Workshop,” (2011).
33 P. D. Burns, “Analysis of image noise in multispectral color acquisition,” Ph.D. thesis (1997).
34 M. V. Newberry, “Increasing precision and accuracy in photometric measurements,” Precision CCD Photometry, ASP Conference Series 189, 74–82 (1999).
35 J. M. Lagarde, C. Rouvrais, D. Black, S. Diridollou, and Y. Gall, “Skin topography measure-ment by interference fringe projection: a technical validation,” Skin Research and Technology
7, 112–121 (2001).
36 R. Bazin and J. L. Leveque, “Longitudinal study of skin aging: from microrelief to wrinkles,” Skin Research and Technology 17, 135–140 (2011).
37 M. Setaro and A. Sparavigna, “Irregularity skin index (ISI): a tool to evaluate skin surface texture,” Skin Research and Technology 7, 159–163 (2001).
38 T. Fujimura, K. Haketa, M. Hotta, and T. Kitahara, “Global and systematic demonstration for the practical usage of a direct in vivo measurement system to evaluate wrinkles,” International Journal of Cosmetic Science 29, 423–436 (2007).
39 P. M. Friedman, G. R. Skover, G. Payonk, A. N. B. Kauvar, and R. G. Geronemus, “3D
in vivo optical skin imaging for topographical quantitative assessment of non-ablative laser
40 E. T. Weiss, A. Chapas, L. Brightman, C. Hunzeker, E. K. Hale, J. K. Karen, L. Bernstein, and R. G. Geronemus, “Successful treatment of atrophic postoperative and traumatic scarring with carbon dioxide ablative fractional resurfacing: Quantitative volumetric scar improvement,” Archives of Dermatology 146, 133–140 (2010).
41 M. C. Bloemen, M. S. van Gerven, M. B. van der Wal, P. D. Verhaegen, and E. Middelkoop, “An objective device for measuring surface roughness of skin and scars,” Journal of the Amer-ican Academy of Dermatology 64, 706–715 (2011).
42 S. Jaspers, H. Hopermann, G. Sauermann, U. Hoppe, R. Lunderstdt, and J. Ennen, “Rapid
in vivo measurement of the topography of human skin by active image triangulation using a
digital micromirror device,” Skin Research and Technology 5, 195–207 (1999).
43 P. Besl and H. McKay, “A method for registration of 3-D shapes,” IEEE Transactions on
Pattern Analysis and Machine Intelligence, 14, 239 –256 (1992).
44 J. Dong and M. Chantler, “Estimating parameters of an illumination model for the synthesis
of specular surface textures,” in “Computer and Information Technology,” (2004).
45 Z. Liang, J. Dong, X. Dong, X. Hu, and J. Xu, “Relations between surface gradient maps in
![Fig. 1. (Color online)Multispectral reflectance of different skin types (NCSU skinreflectance data [25]).](https://thumb-us.123doks.com/thumbv2/123dok_us/640864.565321/4.595.199.412.397.607/color-online-multispectral-reectance-different-types-ncsu-skinreectance.webp)