Experiments on Non-native Speech Assessment and its Consistency
Ziwei ZhouIowa State University, USA [email protected]
Sowmya Vajjala
National Research Council, Canada [email protected]
Seyed Vahid Mirnezami Iowa State University, USA
Abstract
In this paper, we report some preliminary experiments on automated scoring of non-native English speech and the prompt spe-cific nature of the constructed models. We use ICNALE, a publicly available corpus of non-native speech, as well as a vari-ety of non-proprietary speech and natural language processing (NLP) tools. Our re-sults show that while the best performing model achieves an accuracy of 73% for a 4-way classification task, this performance does not transfer to a cross-prompt evalu-ation scenario. Our feature selection ex-periments show that most predictive fea-tures are related to the vocabulary aspects of speaking proficiency.
1 Introduction
Advancements in NLP and speech processing have given rise to the research and development of automated speech scoring systems in the past 10-15 years. The goal of such systems is to provide efficient and consistent evaluation in oral proficiency tests. Whereas early systems scor-ing English proficiency predominantly made use of extracting low-level features, such as pronun-ciation (e.g. segmental errors, phone spectral match) and fluency (e.g. speech rate, number of pauses, lengths of silences), a sustained push to fully represent and evaluate test takers commu-nicative competence has provided major momen-tum to the investigations in automated scoring for spontaneous or unconstrained speech rather than scripted or constrained speech. As a result, au-tomated scoring systems expanded their invento-ries to include multiple dimensions of speaking
This work is licensed under a Creative Commons Attribution 4.0 International Licence. Licence details: http://creativecommons.org/licenses/by/4.0/
proficiency such as prosody, vocabulary, grammar, content, and discourse, as well as exploiting plex models to makes sense of rich data in com-plex tasks from large-scale assessment contexts (Williamson et al., 2006).
However, the research and development of such systems has largely centralized around a few pro-prietary systems (e.g., SpeechRater (Xi et al., 2008; Chen et al., 2018)). Language assessment researchers expressed concerns about the validity of inferences made from such automated systems in high-stakes testing scenarios such as college ad-missions in the past (Chapelle and Chung, 2010). In this paper, we take first steps towards address-ing these issues of proprietary work and validity by: a) reporting our experiments on a freely avail-able corpus, b) looking the transferability of our approach by performing cross-prompt evaluations, c) studying the consistency of our results and d) understanding what features perform well for pre-diction.
Specifically, we explore the following research questions:
1. RQ1: Which classifier performs the best in terms of agreement with human scorers when compared using multiple performance mea-sures?
2. RQ2: How consistent are the machine scores rendered by the best performing model?
3. RQ3: What features are influential in predict-ing human scores?
While the first and third questions were also stud-ied in the past research (with proprietary datasets and software), the second question is some what under explored, to our knowledge.
2 Related Work
SpeechRaterT M, developed by Educational Test-ing Service (ETS) can be considered as a lead-ing strand of research into automated scorlead-ing of non-native speech (Xi et al., 2008; Chen et al., 2018). Since its initial deployment in 2006, a large amount of research has been conducted into the role of various features for this task (e.g., Evanini et al., 2013; Loukina et al., 2015; Tao et al., 2016). Other recent research (Johnson et al., 2016; Kang and Johnson, 2018b,a) explored the role of prosody features in automated proficiency scoring for unconstrained speech. However, much of the previous work in this direction has been on corpora that are not freely accessible, making replications or adaptions to new corpora difficult. In this paper, we follow existing approaches, but with a hitherto unexplored, publicly available cor-pus.
Since such test scores typically serve high-stake purposes, the need for ensuring the validity of machine scores arises. As reviewed by Yang et al. (2002), such validity enquiry can be ap-proached by: (1) demonstrating the correspon-dence between human and machine scorers; (2) understanding the construct represented within the automated processes; and (3) examining the re-lationship between machine scores and criterion measures. In this paper, we take the first steps in this direction by addressing the first aspect.
3 Methods
3.1 Corpus
The data used in this study comes from the In-ternational Corpus of Network of Asian Learn-ers (ICNALE-Spoken), which has a collection of speech data from learners in ten countries and ar-eas in Asia China, Hong Kong, Indonesia, Japan, Korean, Pakistan, the Philippines, Sigapore, Tai-wan, and Thailand, as well as from English native speakers (Ishikawa, 2013). The range of partic-ipants covers the three concentric circles Inner, Outer, and Expanding circles of English language use (Kachru, 1992).
This corpus consists of oral responses provided by college students to two opinion-based prompts (PTJ denoting part-time jobs and SMK denot-ing smokdenot-ing behavior) over telephone recorddenot-ings, lasting about 1 minute each. Each prompt was done in two trials and we used the first trial
(N=950 for each prompt). In order to protect the participants’ identity, speech samples were mor-phed using a speech morphing system developed by ICNALE team (available for download). The program adjusted the pitch and formant of sound files without altering the sound file itself, thereby enabling corpus users to still conduct acoustic analyses on this data.
The participants English proficiency levels are indicated on the Common European Framework of Reference (CEFR) scale with four categories: A2 0 (N=100), B1 1 (N=211), B1 2 (N=469), and B2 0 (N=160). These scores are either di-rectly converted from the participants existing pro-ficiency scores from standard propro-ficiency tests, such as TOEFL, IELTS, or TOEIC, or estimated from a vocabulary size test (Nation and Beglar, 2007) through multiple regression. We used the manual transcriptions provided with the corpus for extracting textual features related to language use.
3.2 Features
We extracted fluency features and audio sig-nal features from the speech samples and lexi-cal/syntactic features from text transcriptions.
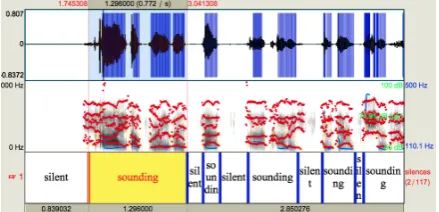
[image:2.595.307.527.555.661.2]Fluency Features: Fluency features are com-monly used in oral proficiency modeling. A Praat script (De Jong and Wempe, 2009) was used (Boersma and Weenink, 2001) to analyze the speech samples for 7 automated measures of fluency: number of syllable nuclei, number of pauses, total response time, phonation time, speech rate, articulation rate, and average sylla-ble duration2. A visual display from the scripts output texgtrid file is presented in Figure 1. As
Figure 1: TextGrid Output From Praat Script That Calculates fluency Measures
shown in the figure, the continuous speech is
au-2The script was originally developed to automatically
tomatically segmented and the fluency measures can be calculated based on these segments. Other measures such as oral fluency can be simply calcu-lated based on the output. Also, since the repairs were indicated in the original transcription by ”-”, the number of repairs in each spoken response were extracted. It should be pointed out that, since the transcriptions did not have any indication for fillers, fillers are not taken into account in the this study.
Audio Signal Features: To extract low-level signal features, which may be helpful in model-ing the automated scormodel-ing models, PyAudio Anal-ysis, which is an open-source Python library for audio feature extraction, classification, segmenta-tion, and applicasegmenta-tion, was used (Giannakopoulos, 2015). We extracted 34 signal level audio fea-tures in both time and frequency domains. These include: zero-crossing rate, energy, entropy of energy, spectral centroid, spectral spread, spec-tral entropy, specspec-tral flux, specspec-tral rolloff, Mel Frequency Cepstrum Coefficients (MFCCs-11), chroma vector (12), and chroma deviation. These kind of features (if not the specific ones we used) were used to build filter model to flag non-scorable responses (Higgins et al., 2011), but not in the scoring model in past research.
Lexical Features: Lexical Complexity Ana-lyzer (Lu, 2012) was used to automatically extract 25 measures of lexical density, variation, and so-phistication from the transcriptions.
Syntactic Features: The L2 Syntactic Com-plexity Analyzer was used to automatically extract 14 measures of syntactic complexity as proposed in the second language development literature (Lu, 2014). They were also used in past research on the topic (Chen and Zechner, 2011).
3.3 Model Building and Validation
We used Scikit-learn, (Pedregosa et al., 2011) to build and compare classification models using different classifiers with this feature set. Since the corpus was unbalanced across proficiency lev-els, Synthetic Minority Oversample Technique (SMOTE) (Chawla et al., 2002) was explored with the aim to help the prediction of minority class and avoid bias towards predicting the majority class. We explored two cases, both with and without oversampling:
• classification models trained and tested sepa-rately for each prompt, which we call intrin-sic evaluation (with 10-fold cross validation)
• classification models trained on one prompt, but tested on the other, which we call extrin-sic evaluation.
A variety of performance measures, including ac-curacy, precision, recall, F1-score, Cohens Kappa (CK), Quadratically Weighted Kappa (QWK), and Spearman Rho Correlation (SRC) statistics were reported. In addition, to further validate the con-sistency of the models, 95% confidence intervals were calculated both based on statistical theory and empirical bootstrap technique.
4 Results
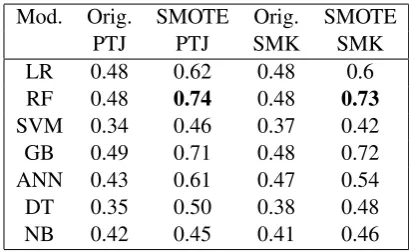
[image:3.595.313.518.519.645.2]Intrinsic Evaluation: We evaluated classifica-tion models using various classifiers: Naive Bayes, Logistic Regression, Random Forests (RF), SVMs, Gradient Boosting and Neural Net-works. Hyperparameters were tuned for each of the candidate classifiers. For example, different hyperparameters including optimizers, loss func-tion, number of layers, number of hidden units, and number of epochs were used to build different ANN models. Results for the model performance in terms of accuracies obtained through intrinsic evaluation from comparing multiple classifiers are shown in Table 1.
Table 1: Model Performances of All Classifiers in Training Set
Mod. Orig. SMOTE Orig. SMOTE
PTJ PTJ SMK SMK
LR 0.48 0.62 0.48 0.6
RF 0.48 0.74 0.48 0.73
SVM 0.34 0.46 0.37 0.42
GB 0.49 0.71 0.48 0.72
ANN 0.43 0.61 0.47 0.54
DT 0.35 0.50 0.38 0.48
NB 0.42 0.45 0.41 0.46
An analysis of the best model showed that RF per-formed better in predicting A2 0 level as well as B2 0 level, but did poorly for distinguishing be-tween B1 1 and B2 2.
Accuracy is equivalent to the exact agreement between human and machine scores. Given that (Xi et al., 2006) reported exact agreement of only 51.8%, this result is promising, especially since both studies have four levels of speaking profi-ciency. However, considering the differences in the nature of data, construct definition, scores, fea-tures, and general approach, results are not di-rectly comparable.
[image:4.595.308.520.230.377.2]As accuracy only captures a specific aspect of the model performance, various other perfor-mance measures have been studied. Table 2 sum-marizes results with the conventionally used psy-chometric measures - CK, QWK and SRC. The highest Cohens Kappa reported in previous stud-ies was 0.52 (Zechner et al., 2007), quadratically-weighted Kappa was 0.60 (Higgins et al., 2011) and SRC was 0.718 (Kang and Johnson, 2018b). This shows that our results are comparable to other research on this topic, albeit with different cor-pora and experimental setup. However, it has to be remembered that we are relying on manual transcriptions of speech and not using automatic speech recognition systems yet in these experi-ments. Considering that there is no publicly ac-cessible code or data from other relevant research on this topic, exact replication may be challenging.
Table 2: Psychometric Measures for Model Per-formance
PTJ SMOTE SMK SMOTE
PTJ SMK
CK 0.11 0.60 0.08 0.66
QWK 0.17 0.73 0.11 0.76
SRC 0.21 0.73 0.16 0.77
To estimate the stability of the model predic-tions, 95% confidence intervals are constructed for the 10-fold CV results using both statisti-cal theory and bootstrapping using sampling-with-replacement technique. Specifically, the theoreti-cal 95% CI was constructed by the following for-mula:
p= f+
Z2
2N±Z
q
f
2N− f2
N+
Z2
4N2
1+Z2 N
where p is the theoretical 95% CI, f is the mean accuracy of the 10-fold CV, Z is the is z-statistic
from the specified confidence level, and N is the sample size (Witten et al. (2016), p. 151). This assumes that the accuracies from 10-fold CV fol-low normal distribution with unknown parameters. This showed an interval of [71.65% –75.67%] for PTJ prompt and [70.99% – 75.03%] for SMK.
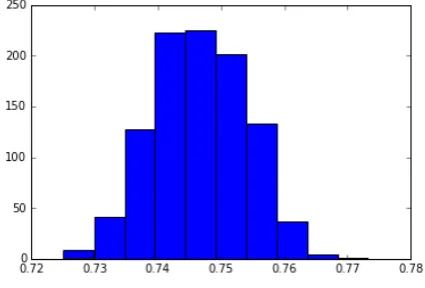
The empirical/ boostrapping 95% CI was con-structed by repetitively fitting the same random forest classifier in 1000 iterations. This is shown in Figure 2 and Figure 3 for both the prompts re-spectively.
Figure 2: Confidence Interval for PTJ prompt model
Figure 3: Confidence Interval for SMK Prompt model
This showed an interval of [72.8% -75.6%] for PTJ and [73.2% - 76%] for SMK. This adds extra evidence as to our degree of certainty about the consistency of the 10-fold CV accuracy through replications.
[image:4.595.309.522.443.587.2] [image:4.595.79.283.534.604.2]cross-prompt evaluation when the training data was oversampled. For example, when the PTJ model was tested on SMK, the accuracy dropped from 74% 55.58%. When the SMK model was tested on PTJ, the accuracy dropped to 52.95%. Thus, the positive effect of oversampling in intrin-sic evaluation is not seen in extrinintrin-sic evaluation. Interestingly, the non-oversampled models did not result in such stark degradation, with accuracies in both cases being closer to 55% and 53% respec-tively, which is actually better than their intrinsic evaluation performance. This leads to a conclu-sion that the non-oversampled model is somehow better agnostic to prompts.
The reason for this performance could be that the oversampling process with low frequency cat-egories makes the dataset too specific. Whether this is an experimental artifact or is there some-thing more to it needs to be evaluated in a future experiment.
Feature Diagnostics: In order to gain deeper understanding of the influential features that may figure prominently in the best-performing model (i.e., over sampled model), feature importance is computed for each prompt using the normalized total reduction of Gini impurity criterion brought by the feature. Results indicated that the random forest classifiers rather than relying on a subset of dominant features, relied on multiple features, al-though the influence of top few features is rela-tively larger for both models.
This result, in some sense, justifies the use of tree-based models for building automated scoring system in operational tests. From a fairness point of view, models that make use of all features rather than a subset of dominant features should be fa-vored in that the latter may unduly advantage those test takers who learns to manipulate certain fea-tures such as complexity of vocabulary3.
Zooming into the top ranking features that have the highest Gini decrease, we notice that influ-ential features used in PTJ are: number of so-phisticated tokens, number of unique words, num-ber of repairs in speech fluency, standard devia-tion of the 2nd and 13th MFCCs, number of de-pendent clauses, corrected type-token ratio, and
3
When features based on feature importance are ranked in descending order, the plot showed a smooth curva-ture, rather than abrupt gaps. Detailed figures and ta-bles with feature scores are provided in the supple-mentary material available at: https://github.com/ nishkalavallabhi/ZhouEtAl2019-SupMat
number of syllables. Influential features for SMK are number of different words, correct type-token-ratio, square root of type-token-type-token-ratio, different word types, number of word tokens, spectral flux, and number of repairs in speech fluency. Thus, the majority of the important features seem to be related to the diversity or variability of vocabu-lary use and repairs in speech fluency. Such Gini-based feature selection result was consistent with other feature evaluation measures such as correla-tion and informacorrela-tion gain.
When we compare the best models with the non-oversampled models, however, the top most important features differ significantly. For PTJ, the top 10 features include 5 audio signal fea-tures and 5 vocabulary based feafea-tures. The top 10 features for SMK include 5 vocabulary based features, 2 syntactic features (Complex nominals per T-unit and mean length of T-unit) and 3 audio signal features. Considering that the oversampled model did not transfer its performance in a cross prompt evaluation, it needs to be studied in future whether these features play a role in having better results across prompts.
5 Conclusion and Discussion
We reported some of our initial experiments with automated scoring of non-native speech using a new corpus and a set of audio, speech, and text fea-tures. In terms of our research questions, for RQ1, our results indicate that the best-performing model with accuracy of about 73% for both prompts is achieved by using oversampling and random forests. For RQ2, our results showed that the accu-racies drop substantially for the oversampled data sets, but the accuracies for the non-oversampled versions remain consistent. For RQ3, various fea-ture selection schemes consistently pointed to the dominance of vocabulary related features for this classification task.
ICNALE speech samples were morphed to de-identify speaker voice. We did not verify the ac-curacy of the praat script used to estimate fluency features with such morphed speech. Considering that these are the first results on a publicly avail-able dataset for this task (to our knowledge), future work includes incorporating these aspects into our approach.
Finally, as was pointed out earlier in Section 3, the class labels used in this study may be prob-lematic in that are either directly converted from the participants existing proficiency scores from other tests, which need not have reflected in the current responses. While we don’t have a solution for this yet, we believe these experiments would still result in further research in the direction of ex-ploring more generalizable approaches, using non-proprietary resources.
References
Paul Boersma and David Weenink. 2001. Praat, a sys-tem for doing phonetics by computer. Glot Interna-tional, 5(9/10):341–345.
Carol A Chapelle and Yoo-Ree Chung. 2010. The promise of nlp and speech processing technolo-gies in language assessment. Language Testing, 27(3):301–315.
Nitesh V. Chawla, Kevin W. Bowyer, Lawrence O. Hall, and W. Philip Kegelmeyer. 2002. Smote: Syn-thetic minority over-sampling technique. Journal of Artificial Intelligence Research, 16:321–357.
Lei Chen, Klaus Zechner, Su-Youn Yoon, Kee-lan Evanini, Xinhao Wang, Anastassia Louk-ina, Jidong Tao, Lawrence Davis, Chong Min Lee, Min Ma, Robert Mundkowsky, Chi Lu, Chee Wee Leong, and Binod Gyawali. 2018. https://doi.org/10.1002/ets2.12198 Automated scor-ing of nonnative speech usscor-ing thespeechratersm v. 5.0 engine. ETS Research Report Series, 2018(1):1– 31.
Miao Chen and Klaus Zechner. 2011. Computing and evaluating syntactic complexity features for auto-mated scoring of spontaneous non-native speech. In Proceedings of the 49th Annual Meeting of the Asso-ciation for Computational Linguistics: Human Lan-guage Technologies, pages 722–731.
N. H. De Jong and T. Wempe. 2009. Praat script to detect syllable nuclei and measure speech rate au-tomatically. Behavior Research Methods, 41:385– 390.
Keelan Evanini, Shasha Xie, and Klaus Zechner. 2013. Prompt-based content scoring for automated spoken language assessment. In Proceedings of the eighth
workshop on innovative use of NLP for building ed-ucational applications, pages 157–162.
T. Giannakopoulos. 2015. Pyaudioanalysis: An open-source python library for audio signal analysis. PloS One, 10:1–17.
Derrick Higgins, Xiaoming Xi, Klaus Zechner, and David Williamson. 2011. A three-stage approach to the automated scoring of spontaneous spoken re-sponses. Computer Speech & Language, 25(2):282– 306.
S. Ishikawa. 2013. The ICNALE and sophisticated contrastive interlanguage analysis of asian learners of english. Learner Corpus Studies in Asia and the World, 1(1):91–118.
David O. Johnson, Okim Kang, and Romy Ghanem. 2016. https://doi.org/10.1007/s10772-016-9366-0 Improved automatic english proficiency rating of unconstrained speech with multiple corpora. Int. J. Speech Technol., 19(4):755–768.
B. Kachru. 1992.he other tongue: English across cul-tures. University of Illinois Press.
Okim Kang and David Johnson. 2018a. The roles of suprasegmental features in predicting english oral proficiency with an automated system. Language Assessment Quarterly, 15(2):150–168.
Okim Kang and David O Johnson. 2018b. Automated english proficiency scoring of unconstrained speech using prosodic features. In Proceedings of the In-ternational Conference on Speech Prosody, volume 2018, pages 617–620.
Anastassia Loukina, Klaus Zechner, Lei Chen, and Michael Heilman. 2015. https://doi.org/10.3115/v1/W15-0602 Feature selection for automated speech scoring. In Pro-ceedings of the Tenth Workshop on Innovative Use of NLP for Building Educational Applications, pages 12–19, Denver, Colorado. Association for Computational Linguistics.
Xiaofei Lu. 2012. The relationship of lexical richness to the quality of esl learners’ oral narratives. The Modern Language Journal, 96:190–208.
Xiaofei Lu. 2014. Computational methods for corpus annotation and analysis. International Journal of Corpus Linguistics, 21:133–138.
I.S.P. Nation and D. Beglar. 2007. A vocabulary size test. The Language Teacher, 31(7):9–13.
Jidong Tao, Lei Chen, and Chong Min Lee. 2016. Dnn online with ivectors acoustic modeling and doc2vec distributed representations for improving automated speech scoring. Interspeech 2016, pages 3117– 3121.
David M Williamson, Robert J Mislevy, and Isaac I Be-jar. 2006. Automated scoring of complex tasks in computer-based testing. Psychology Press.
Ian H Witten, Eibe Frank, Mark A Hall, and Christo-pher J Pal. 2016. Data Mining: Practical machine learning tools and techniques. Morgan Kaufmann.
Xiaoming Xi, Derrick Higgins, Klaus Zechner, and David M Williamson. 2008. Automated scoring of spontaneous speech using speechratersm v1. 0.ETS Research Report Series, 2008(2):i–102.
Xiaoming Xi, Klaus Zechner, and Isaac Bejar. 2006. Extracting meaningful speech features to support di-agnostic feedback: an ecd approach to automated scoring. Proc. Annu. Meet. Natl. Counc. Meas. Educ.(NCME).
Yongwei Yang, Chad W Buckendahl, Piotr J Juszkiewicz, and Dennison S Bhola. 2002. A review of strategies for validating computer-automated scoring. Applied Measurement in Education, 15(4):391–412.