Hutchison et al.
Structural controls on fluid pathways in an active rift system:
A case study of the Aluto volcanic complex
William Hutchison
1,*
, Tamsin A. Mather
1, David M. Pyle
1, Juliet Biggs
2, and Gezahegn Yirgu
31
COMET, Department of Earth Sciences, University of Oxford, South Parks Road, Oxford OX1 3AN, UK
2
COMET, School of Earth Sciences, University of Bristol, Wills Memorial Building, Queens Road, Bristol BS8 1RJ, UK
3
School of Earth Sciences, Addis Ababa University, P.O. Box 1176, Addis Ababa, Ethiopia
ABSTRACT
In volcanically and seismically active rift systems, preexisting faults may control the rise and eruption of magma, and direct the flow of hydrothermal fluids and gas in the subsurface. Using high-resolution airborne imagery, field observations, and CO2 degas-sing data on Aluto, a typical young silicic vol-cano in the Main Ethiopian Rift, we explore how preexisting tectonic and volcanic struc-tures control fluid pathways and spatial pat-terns of volcanism, hydrothermal alteration and degassing. A new light detection and ranging (lidar) digital elevation model and evidence from deep geothermal wells show that the Aluto volcanic complex is dissected by rift-related extensional faults with throws of 50–100 m. Mapping of volcanic vent distri-butions reveals a structural control by either rift-aligned faults or an elliptical caldera ring fracture. Soil-gas CO2 degassing surveys show elevated fluxes (>>100 g m–2 d–1) along major faults and volcanic structures, but significant variations in CO2 flux along the fault zones reflect differences in near-surface permeability caused by changes in topogra-phy and surface lithology. The CO2 emission from an active geothermal area adjacent to the major fault scarp of Aluto amounted to ~60 t d–1; we estimate the total CO
2 emission from Aluto to be 250–500 t d–1. Preexisting vol canic and tectonic structures have played a key role in the development of the Aluto volcanic complex and continue to facilitate the expulsion of gases and geothermal fluids. This case study emphasizes the importance of structural mapping on active rift vol-canoes to understand the geothermal field as well as potential volcanic hazards.
INTRODUCTION
Existing fault structures can play a significant role in the development of a volcanic complex, ultimately providing high permeability path-ways for magma, hydrothermal fluids, and gas to ascend to the surface (e.g., Arnórsson, 1995; Rowland and Sibson, 2004; Caliro et al., 2005; Fridriksson et al., 2006). Understanding how preexisting structures such as regional tectonic faults and caldera ring faults affect fluid flow to the surface is a major task in defining the evolu-tion of rift zones and has important implicaevolu-tions for mineralization, geothermal exploration, and the assessment of volcanic hazard.
Recent work, specifically focused on hydro-thermal venting and volcanic degassing (Schöpa et al., 2011; Pantaleo and Walter, 2013), has shown that while preexisting structures may control permeability at the edifice scale, at smaller scales these structural controls may be obscured by localized near-surface permeability variations. These local influences may include (1) lithological variations, where fluids will preferentially migrate along high permeability layers (e.g., poorly consolidated tephra layers) and (2) topographic controls, where the stress field induced by gravitational loading causes fracturing parallel to topography, and focuses pathways for steam and other gases toward topo graphic highs (Schöpa et al., 2011). To understand how large-scale structures influence active volcanic processes it is useful to look at the surface expression of different volcanic flu-ids (i.e., magma, hydrothermal fluflu-ids, and gas) across a variety of scales to disentangle large-scale structural controls from these localized near-surface permeability variations.
Both direct and remote measurements can be used to assess the spatial distribution of fluids and fluid pathways. Remotely sensed data such as lidar (light detection and ranging) and aerial photography (e.g., Pyle and Elliott,
2006; Cashman et al., 2013) are powerful tools to analyze volcano morphology, map sites of eruption and extrusion, and distinguish zones of hydrothermal alteration and fluid upwelling (e.g., Crowley and Zimbelman, 1997). On the other hand, volcanic gases (e.g., CO2) that may be difficult to detect remotely, can be readily measured in the field using modern surveying techniques (Chiodini et al., 1998) and gridded to produce detailed maps of gas flux across a volcanic edifice (Cardellini et al., 2003; Parks et al., 2013). These techniques allow us to build detailed pictures of how different fluids are released from active volcanoes; the challenge for volcanologists is integrating these observa-tions to unravel the subsurface structure and the processes controlling fluid pathways.
The Main Ethiopian Rift (MER, East Africa) provides an ideal natural laboratory to study how preexisting structural features (of both volcanic and tectonic origin) influence active volcanic processes. Firstly, the MER hosts a number of young silicic peralkaline volcanoes, allowing investigation of active magmatic and geothermal systems. Secondly, extension in the MER has generated abundant faults and fracture networks (e.g., Keir et al., 2006; Corti, 2009) through which magma can ascend and erupt. Finally, many of the MER volcanoes have undergone caldera collapse (Cole et al., 2005) and thus are likely to have established ring fault systems (Cole, 1969; Gibson, 1970; Mohr et al., 1980; Acocella et al., 2003; Rampey et al., 2010).
The silicic peralkaline volcanoes of the MER are among the least studied on Earth: few have detailed geological maps and significant knowl-edge gaps exist regarding their past and current activity (Aspinall et al., 2011). Detailed studies of peralkaline volcanic systems are limited to a few key complexes (e.g., Pantelleria; Mahood and Hildreth, 1983, 1986; Civetta et al., 1988; White et al., 2009; Neave et al., 2012; Williams et al., 2013), despite the fact that they appear
Geosphere; June 2015; v. 11; no. 3; p. 542–562; doi:10.1130/GES01119.1; 12 figures; 2 tables.
Received 18 August 2014 ♦ Revision received 14 December 2014 ♦ Accepted 9 February 2015 ♦ Published online 2 April 2015 *Corresponding author; william .hutchison@ earth
.ox .ac .uk.
to be a ubiquitous feature of continental rift zones (Mahood, 1984; Cole et al., 2005). The caldera structures produced at peralkaline vol-canic centers in the East African Rift system are also of note because many appear elliptical in map view (e.g., Acocella et al., 2003; Bosworth et al., 2003; Holohan et al., 2005). While several recent publications have emphasized the role of elongate magma chamber collapse in generating elliptical calderas in the East African Rift sys-tem (e.g., Acocella et al., 2003; Bosworth et al., 2003), there is a lack of consensus regarding the exact mechanism in the MER. Establish-ing the controls on magma rise and pondEstablish-ing in tectonically thinned crust is fundamental to understanding how continental rift zones evolve (Ebinger et al., 2010).
In this paper we integrate observations from field campaigns, airborne remote sensing (lidar, aerial photos) and soil-gas CO2 surveys to examine how magma, hydrothermal fluid, and gas pathways are coupled to the major structural features on Aluto, a typical young peralkaline volcanic complex of the MER. We show that each data set provides unique information about the complex and the links between volcanic activity and preexisting volcanic and tectonic structures. From these data we develop a con-ceptual model that captures both the volcanic evolution and the role these major structures play in controlling fluid pathways.
MER—REGIONAL SETTING
The MER (Fig. 1) is a zone of active exten-sion in the East African Rift system that con-nects the Afar depression to the north with the Turkana depression and Kenyan rift to the south. The MER is an oblique rift, exhibiting an overall NE–SW trend, formed by E–W exten-sion between the Nubia and Somalia plates via both magmatic intrusion and tectonic faulting (Ebinger , 2005; Corti, 2009; Corti et al., 2013a). Geodetic and seismic data (Bendick et al., 2006; Keir et al., 2006; Stamps et al., 2008) indicate that the current E–W (~N100°E) extension rates are 4–6 mm yr–1. The MER is usually divided into three sectors (northern, central, and south-ern) that reflect differences in terms of the spatial pattern of the faulting (Agostini et al., 2011), the timing of the major faulting episodes (Wolde-gabriel et al., 1990; Wolfenden et al., 2004; Bonini et al., 2005), and the thermal-mechani-cal state of the lithosphere (e.g., Keranen and Klemperer , 2008). This pattern is consistent with rift maturity increasing northward along the MER toward Afar, where the overall physiol-ogy changes from continental rifting to incipient oceanic spreading (Beutel et al., 2010; Ebinger et al., 2010; Ferguson et al., 2013).
The MER has two distinct fault sets: (1) NE– SW-oriented border faults with large vertical offsets (>100 m) on the boundaries of the rift, and (2) a set of closely spaced internal faults, the Wonji faults, with smaller vertical offsets (<100 m) oriented NNE–SSW and concentrated on the rift floor (Chorowicz et al., 1994; Boc-caletti et al., 1998). In the central MER (CMER), the focus of this paper, the border faults formed at 6–8 Ma (Woldegabriel et al., 1990; Bonini et al., 2005), while the Wonji faults initiated ca. 2 Ma (Boccaletti et al., 1998; Ebinger and Casey, 2001). These observations support models of rift initiation and continental extension (Hay-ward and Ebinger, 1996; Ebinger, 2005; Corti, 2008) whereby border faults are progressively abandoned and strain becomes localized to active segments central to the rift zone. This focusing of strain has resulted in discrete narrow zones (~20 km wide) where extension is accom-modated by Wonji faults as well as magmatic intrusion (Keranen et al., 2004; Keir et al., 2005; Kendall et al., 2005; Mackenzie et al., 2005). In the CMER, while the border faults are still seismically active (Keir et al., 2006; Pizzi et al., 2006) much of the active tectonic deformation occurs in the magmatic segments via the NNE– SSW Wonji faults (Keir et al., 2006).
Magmatic intrusion within the active seg-ments has produced abundant surface vol canism. Basalts are associated with scoria cones and erup-tive fissures, whereas rhyolitic vol canism has produced a series of peralkaline volcanoes com-prising silicic lava flows, domes, and coulees , and extensive pyroclastic products (Gibson, 1969; Di Paola, 1972).
Aluto Volcano—Geological Overview and Deep Well Observations
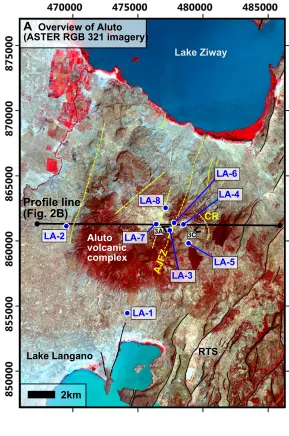
Aluto is a silicic peralkaline volcano located in the CMER (Fig. 1). The complex (outlined by the white box in Fig. 1 and detailed in Fig. 2A) is dominated by an ~14-km-wide, 700-m-high edifice composed of a thick pile of coalescing rhyolitic lava flows and domes, pumice cones, and ignimbrite deposits. There are a significant number of smaller volcanic vents and domes formed off the main edifice, particularly to the northwest of the complex. Aluto has an inter-nally drained central depression (herein referred to as a caldera floor) that has been partially in-filled by alluvium and reworked material from the surrounding surface volcanic depos-its. While there are no detailed accounts of the eruptive history of the complex, descriptions of the geology of Aluto are in regional-scale map-ping reports (e.g., Dakin and Gibson, 1971; Di Paola, 1972; Kebede et al., 1985); studies of the Ziway-Shala lake basin system (Gasse and
Street, 1978; Street, 1979; Le Turdu et al., 1999; Benvenuti et al., 2002; Gibert et al., 2002), and publications related to geothermal development on Aluto (Gebregzabher, 1986; Valori et al., 1992; Gizaw, 1993; Gianelli and Teklemariam, 1993; Teklemariam et al., 1996; Saibi et al., 2012). This work and our own field investiga-tions suggest that the Aluto volcanic complex has undergone several cycles of explosive and effusive volcanism throughout its history and that these eruptive phases have been dominantly silicic in composition.
There are few constraints on the ages of the erupted products of Aluto. A single K/Ar date from a geothermal feasibility study gives an age of 155 ± 8 ka for the Hulo-Seyno ignimbrite, which is taken as one of the first products of the silicic complex (ELC Electroconsult, 1986). The most recent volcanic activity on Aluto is represented by a series of obsidian lava flows, the youngest of which likely erupted within the past 2000 yr (Gianelli and Teklemariam, 1993). Aluto is an active volcanic system. Across the complex, hydrothermal manifestations include fumaroles and hot springs (Kebede et al., 1985). Interferometric synthetic aperture radar (InSAR) studies show that Aluto has undergone several uplift and subsidence events of 10–15 cm over the past decade (Biggs et al., 2011). While the exact mechanism driving deformation is uncer-tain, the source characteristics and time scale are indicative of shallow magmatic processes active beneath the complex (Biggs et al., 2011).
significant faulting preceded volcanic activity at Aluto. Of the 8 wells drilled, only 2 (LA-3 and LA-6) are productive. The sustained pro-duction in these wells is linked to their location along a major NNE–SSW fault on Aluto (herein referred to as the Artu Jawe fault zone; AJFZ in Fig. 2A). Well temperatures (Gizaw, 1993), alteration mineral assemblages (Gebregzabher, 1986; Gianelli and Teklemariam, 1993), and the Na/K ratio of geothermal fluids from these deep wells (Gizaw, 1993) all support the hypothesis
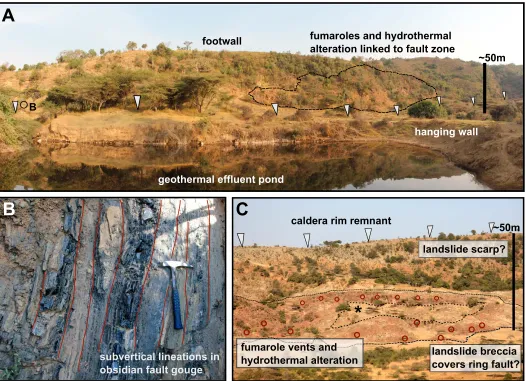
that this faulted zone, photographed in Fig. 3A, is the main upflow zone through which high-temperature fluids ascend to the surface.
METHODS
Remote Sensing
Mapping of the volcanic and tectonic land-forms on Aluto was carried out using airborne and satellite remote sensing, complemented by
eight weeks of field mapping to ground truth these interpretations. High-spatial-resolution topography and imagery of the volcanic edifice were acquired in November 2012 by the UK Natural Environmental Research Council’s Air-borne Research and Survey Facility. The aircraft was equipped with a Leica ALS50 airborne laser scanner, AISA (Airborne Imaging Spectrometer for Application) Eagle and Hawk hyperspectral instruments and a Leica RCD105 39 megapixel digital camera. The lidar system acquired first,
37°
37°
38°
38°
39°
39°
40°
40°
6°
6°
7°
7°
8°
8°
9°
9°
0
1000
2500
5000
(m)
Nubian plate
Nubian plate
Somalian plate
Somalian plate
NMER
NMER
CMER
CMER
SMERSMER
Elevation
4–6 mm yr–1
Fig. 2A
Ay
Sh Ab Ln
Zw Ko
AA
NZ
AW SH
Aw
Lake Langano
Lake Ziway
Aluto volcanic complex
2km
LA-1 LA-8
LA-3 LA-2
Profile line
(Fig. 2B)
B
Deep well cross section
LA-2
LA-4 LA-5 LA-7 LA-6
no deep well observations
uplifted
block? rift shoulder
Alutu silicic products
Pleistocene lacustrine sediments
Bofa basalt Tertiary ignimbrite
rift floor
Trachytic pyroclastics
?
?
?
2500
2000
1500
1000
500
0
–500
Elevation (m
)
0
5
10
15
20
Distance along profile (km)
?
geothermal reservoir
cap rock
no deep well observations fault orientation
unknown
?
west
east
A
Overview of Aluto (ASTER RGB 321 imagery)LA-6
CR
AJF Z
RTS
3C 3A
LA-4
LA-5 LA-7
[image:4.594.222.511.57.493.2]second, and last returns for ~140 × 106 discrete points and was operated with a pulse repetition frequency of 46,200 kHz and scan frequency of 29.9 Hz. The last-return data points were com-bined into a single point cloud and a 2-m-reso-lution digital elevation model (DEM) was gen-erated using GRASS (Geographic Resources Analysis Support System; http:// grass .osgeo .org/). The DEM was also used to ortho rectify aerial photos acquired by the digital camera. Orthorectification was performed with the Leica Photogrammetry Suite in ERDAS Imagine soft-ware (www .hexagongeospatial .com /products /remote -sensing /erdas -imagine) using camera calibration information provided with the photo-graphic data. Orthophotos reveal valuable
sur-face and morphological information and have a resolution of 0.25–0.50 m.
Using the airborne data we mapped (1) vol-canic vent locations, the site of an effusive vent of a lava flow, and the center of a crater (or set of nested crater features), represented by points (Figs. 4 and 5), and (2) volcanic lineaments, crater rims, and other linear fissures represented by line features (Fig. 5B). We could only map volcanic lineaments on the main edifice of Aluto (i.e., the area covered by the lidar DEM); off the main edifice, Google Earth and ASTER (Advanced Spaceborne Thermal Emission and Reflection Radiometer) satellite imagery were used. Owing to their lower resolution and the generally greater erosion of the volcanic
land-forms beyond the main edifice, only vent loca-tions could be accurately mapped (Fig. 4).
The spatial distribution of volcanic vents and the orientation of elongate vents and fissures can be used to make inferences about geom-etry of feeder dikes and ultimately evaluate the underlying structural or stress field controls on magma pathways (e.g., Nakamura, 1977; Tibaldi, 1995; Paulsen and Wilson, 2010). On the main edifice, we used crater rim and fissure line data (Fig. 5) to investigate whether these features exhibited any prevailing orientations and alignments with regional faults. To do this we analyzed the orientation of all individual segments of the digitized crater and fissure line data and length-weighted our results. The
fumaroles and hydrothermal
alteration linked to fault zone
B
A
footwall
hanging wall
geothermal effluent pond
~50m
B
C
caldera rim remnant
subvertical lineations in
obsidian fault gouge
fumarole vents and
hydrothermal alteration
~50m
landslide scarp?
landslide breccia
covers ring fault?
[image:5.594.28.554.61.442.2]*
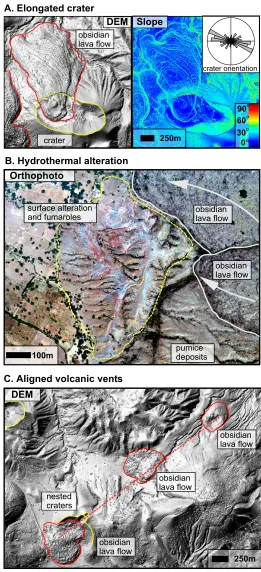
results are illustrated for an individual elongate crater in Figure 6A; the inset clearly demon-strates a rose plot with prevailing E–W orien-tation. This method is similar to that employed previously (e.g., Trippanera et al., 2014), but has the advantage that rather than taking one aver-aged elongation direction, all mapped segments that make up the crater and fissures are used and can be compared together. Beyond the coverage of the lidar DEM, where it was not possible to carry out detailed volcanic lineament mapping, an azimuth-based method was used to assess vent alignments (Lutz, 1986; Wadge and Cross, 1988; Lutz and Gutmann, 1995; Cebriá et al., 2011). Vents are treated as discrete points, and the azimuth (or alignment direction) between a vent and its neighbors is determined for a given separation distance. When vent locations (or magma pathway to the surface) are controlled by faulting, then neighboring vents will have similar orientations relative to each other. How-ever, as the distance between vents increases, then so does the likelihood that the vents will not be located on the same fracture. Thus, align-ments need to be assessed within a specific sepa-ration window to best expose regional structural trends (Cebriá et al., 2011). Ultimately, these numerical interpretations of the volcanic vents and structural data are considered in the context of the physical observations from the remote sensing, field observations, and the CO2 degas-sing measurements to assess their real geologi-cal significance.
Hydrothermal fluid upwelling on Aluto causes visible alteration of the surface volcanic products, producing red and orange clays over areas >>10 m2, which can be mapped using
aerial photographs (Fig. 6B). While an auto-mated mapping approach using the spectral sig-nature of these alteration facies (e.g., Crowley and Zimbelman, 1997) would be feasible given our data set, for the purposes of this study the resolution of the aerial photos is sufficiently high that major altered zones can be approxi-mately mapped, and their locations can be linked with structural interpretations and CO2 degassing results. Our assessment of hydro-thermal alteration made using the orthophotos correlates well with fumarole vents mapped on the ground by the Geological Survey of Ethiopia (Kebede et al., 1985); for hot spring locations
that were beyond the coverage of our remote sensing data, we used Kebede et al. (1985) to constrain their location.
Soil CO2 Flux
[image:6.594.222.566.58.540.2]Measurements of soil CO2 flux on Aluto were undertaken in three surveys between January 2012 and February 2014. The first survey (January 2012) sought to transect large-scale structures and identify whether they provided key permeability pathways for CO2 -rich geothermal fluids and magmatic gases to upwell. Degassing surveys were conducted
in November 2012 and February 2014, and focused on producing a detailed map of spa-tial degassing patterns along the major tectonic fault (Artu Jawe fault zone). A 1000 m × 800 m study area (Fig. 5A) was chosen to include both the major fault scarp (photograph in Fig. 3A) and the productive geothermal wells (LA-3 and LA-6). A 30-m sampling grid was use, a com-promise between attaining spatial coverage of the fault zone at sufficient sampling resolution. In total 560 sites were visited (424 in Novem-ber 2012 and 136 in February 2014). Those that were in geothermal effluent ponds, areas of dense vegetation, or on hazardous slopes were excluded, and in some instances extra measurements were made off the predefined sampling grid to help characterize the highest values in the degassing regions.
The CO2 flux was measured directly using two portable closed system gas analyzer units (a LICOR LI-8100 automated soil CO2 flux system and a PP-systems SRC-1 chamber with EGM-4 analyzer). Both instruments have an infrared gas analyzer and use the accumulation method (Parkinson, 1981; Chiodini et al., 1998) to measure CO2 flux. Measurements were con-sistent between the instruments; comparisons
made at identical sites showed variations of 10%–25% between the two instruments (sig-nificantly less than the variation seen across the complex). Repeated site measurements showed variations of ~25% in low flux zones (<10 g m–2 d–1) and <10% in high flux zones (>100 g m–2 d–1), consistent with random error in natural emission rates (Carapezza and Granieri, 2004; Viveiros et al., 2010) and in line with the quoted reproducibility of each instrument (5%–10%, Chiodini et al., 1998; Giammanco et al., 2007).
To generate maps of soil CO2 flux from the discrete point measurements the sequential Gaussian simulation (sGs) method was used (Cardellini et al., 2003). A simulation grid was defined (at higher spatial resolution than the sampling grid) and 100 sGs were performed using the sgsim code (Deutsch and Journel, 1998) available in the Stanford Geostatistical Modeling Software (SGeMS) open-source geo-statistics package (Remy et al., 2009). A CO2 flux map was constructed from these simula-tions taking the arithmetic mean of each indi-vidual cell across all simulations, equivalent to the E-type soil flux map proposed by Cardellini et al. (2003). The total CO2 flux was calculated for each simulation and the mean and standard
deviations of all simulations were computed and used to estimate total CO2 release as well as the associated uncertainty (Cardellini et al., 2003).
RESULTS
Recent Volcanism and Links to a Ring Fracture System
The spatial distribution of volcanic vents on Aluto is shown in Figure 4. Vents are largely restricted to the main edifice and a NNE–SSE-trending zone to the northwest of this. A detailed map of volcanic vents, lava flows, craters and fissures overlain on the lidar DEM is given in Figure 5. Lava flows on the central edifice are rhyolitic; Figure 6A shows shaded relief and slope maps for a typical obsidian lava deposit. Craters are predominantly <1 km in diameter and <100 m deep; many are elliptical (e.g., Fig. 6A) or are composed of nested structures (Fig. 5).
On the northeast flank of Aluto, several lines of evidence support the existence of a caldera rim structure; from remote sensing data we iden-tify a 2.5-km-long arcuate structure (CR in Fig. 2A; also see Figs. 4 and 5) that is orthogonal to
[image:7.594.27.551.66.335.2]the regional NNE–SSE tectonic structures (RTS in Fig. 2A). Viewed from the southwest (Fig. 3C), the rim comprises a steep wall 50–60 m in height. Fumaroles and hydrothermal alteration are picked out at the base of the structure (Fig. 3C), and tentatively correlated with a buried ring fault. Northeast of the rim (Figs. 2A and 5) the topography gently slopes away from the edifice and is incised by numerous gullies and channels. The morphology of this structure is characteristic of a volcanic caldera (Lipman, 1997; Cole et al., 2005), including a caldera rim, curving landslide scarp, and possible landslide breccia that conceals the ring fault (labeled in Fig. 3C).
An underlying caldera ring fault (E–W-oriented ellipse; Figs. 4 and 5) centered on the floor of the main edifice may explain a number of aspects of the young volcanism. Assuming that vent and fissure elongation parallels the orientation of subsurface fractures (Paulsen and Wilson, 2010), then crater rim and fissure linea-tions in Figure 5 can be used as proxy for the underlying structures feeding surface eruption. Vent elongations on the southern rim of Aluto show clear E–W orientations (e.g., Fig. 6A, and the nested crater structures east of this in Fig. 5B) indicative of an E–W–oriented fissure feeding surface eruptions. In Figure 5B it is also clear that mapped crater rims on the western margin of the edifice show approximate elonga-tion N–S, and likewise on the east of the com-plex a group of clustered craters shows overall elongations in N–S and NE–SW directions. The
distribution of volcanic vents (Figs. 4 and 5) also shows a dominantly elliptical ring distribu-tion on the main edifice with a marked absence of vents within the center of the caldera. Figure 4 shows that a number of vents on the main edi-fice (62% of total mapped using the lidar) are
within ±500 m uncertainty of the proposed ring structure. Vents that are not within this structure may have been controlled by other structures (e.g., the Artu Jawe fault zone; see following), or alternatively the caldera ring fault may be more structurally complex than the proposed
d. Hydrothermal alteration Orthophoto
surface alteration and fumaroles
obsidian lava flow obsidian lava flow
pumice deposits
obsidian lava flow
obsidian lava flow
obsidian lava flow
nested craters 100m
250m
B. Hydrothermal alteration A. Elongated crater
DEM DEM Slope
obsidian lava flow
crater 250m 300°°
60°
90°
DEM
crater orientation
[image:8.594.263.524.60.632.2]C. Aligned volcanic vents
ellipse. Caldera ring faults are unlikely to truly approximate an ellipse in shape; however, this is the simplest first-order model of a ring fault in the absence of other evidence concerning its structure.
The vent elongations and distributions match orientations that would be expected for a mature caldera structure feeding eruptions at the sur-face. We assume that feeder dikes here are either elongate in response to the local stress field set up on the caldera or are directly exploiting an existing ring fracture. The ellipse fit is ~5 km in N–S diameter and ~8 km in E–W diameter, with ellipticity (short/long axis ratio) of 0.63 and long-axis elongation of N090°E. The mapped caldera rim remnant corresponds closely to the proposed ring fracture, although it only overlaps ~8% of the entire ellipse (Figs. 4 and 5).
Evidence for Faulting
The deep well stratigraphy (Fig. 2B) reveals several major fault zones, aligned with regional tectonic trends, dissecting the Aluto volcanic complex. However, few of these structures have a clear surface expression, due to the large vol-umes of young volcanic and lacustrine sediment cover. On the edifice the surface is mantled by tephra and obsidian lava flows; to the north, west, and south of Aluto there are substantial lacus-trine deposits (including gravels, sands, muds, and diatomite) that were deposited throughout the late Pleistocene and early Holocene (Grove and Goudie, 1971; Grove et al., 1975; Gasse and Street, 1978; Street, 1979; Gillespie et al., 1983; Le Turdu et al., 1999; Benvenuti et al., 2002).
The only major fault scarp visible on Aluto is exposed in a 500-m-long segment on the east of the caldera, the NNE–SSW Artu Jawe fault zone (Figs. 2A and 3A). Topographic profiles across the fault show a typical profile expected for a normal fault down throwing to the west (with a maximum throw of 50 m measured at the sur-face). The scarp is mostly covered by recent slumped clastic material, but in a more pristine deeper exposure a highly brecciated aphyric obsidian lava is visible (Fig. 3B). The poorly consolidated texture and thin (1–10 cm) sub-vertical banding of the deposit is very different from obsidian lavas encountered elsewhere on the complex and therefore may represent fault gouge. The near vertical dip and approximate north-south strike of the foliations (Fig. 3B) closely match the overall trend of the fault scarp.
To the north, the fault scarp is covered by an elongate dome of pumice and obsidian lava units (Figs. 5B and 7). This elongate dome is 2 km (E–W) by 4 km (north-south), ~180 m high, and is close to the trend of the Artu Jawe fault scarp. We infer that these volcanic deposits have
erupted along the fault zone building up the elongate pumice dome. To the south of the Artu Jawe fault scarp the surface rupture is obscured by mantling tephra; however three-dimensional views of the fault zone (Fig. 7) show a gorge fol-lowing the same trend, supporting its continua-tion into the volcanic pile. There is evidence of a secondary, less-pronounced break in topogra-phy ~500 m west of the main scarp (Fig. 7). The surface topography data alone are not sufficient to classify these faults separately. Owing to their proximity to the main scarp, we group these structures together as the Artu Jawe fault zone.
There are no clear fault traces exposed on the caldera floor (CF in Fig. 7), suggesting that either the material infilling the caldera is very young and/or there has been no significant recent displacement on faults within the caldera. It has been suggested (Kebede et al., 1985; ELC Electroconsult, 1986) that a fault gorge extends through the southern rim (SFG in Fig. 7). A line of fumaroles parallel to this gorge (Fig. 7B) pro-vides qualitative evidence to support existence of this fault (see following discussion of hydro-thermal features).
Three obsidian domes and nested craters were identified on the northwest of the caldera floor (Fig. 6C). The domes are of comparable size (150–400 m diameter) and are aligned along a trend of N050°E. In the field the domes appear compositionally similar and display similar weathering characteristics, suggesting that they share a common source and erupted at a similar time. These observations suggest an underlying tectonic control on the eruption of these lavas at the surface.
From remote sensing (Figs. 2A and 4) there is a clear prevalence of volcanic vents aligned NNE–SSW northwest of the edifice, but there is no evidence for large fault structures at the sur-face. Highstands in the lake system since 10 ka have reached maximum lake levels of 1660– 1680 m above sea level (Street, 1979; Gillespie et al., 1983; Benvenuti et al., 2002, 2013), suffi-cient to isolate these vents. We therefore assume that these young lacustrine sediment deposits have masked any surface fault breaks.
Volcanic Alignments
In Figure 8 we compare the orientations of volcanic features and vent alignments with regional fault trends. As expected (e.g., Agos-tini et al., 2011), we can distinguish two distinct fault systems in the CMER: border faults and the younger internal faults (referred to herein as the Wonji faults). There is a marked differ-ence in strike between the two groups (Figs. 8A, 8B). The Wonji faults have a NNE–SSW strike (mean value of N012°E); in contrast, the border
faults have a more NE–SW orientation (mean value of N032°E).
Figure 8C shows a length-weighted rose plot for all crater rim and fissure line segments mapped on the main volcanic edifice (identi-fied in Fig. 5). Unlike tectonic fault trends these features display preferential orientations along both N–S and E–W alignments. Crater rim and fissure line orientations are also skewed to NE–SW rather than NW–SE align-ments (Fig. 8C). Figures 8D and 8E show the azimuth between volcanic vent locations (i.e., point features) on and off the main edifice of Aluto. On the main edifice the volcanic vent alignments (Fig. 8D) show equivalent results to those shown in Figure 8C; there is a pro-nounced NNE–SSW alignment (N010–020E° bin), secondary E–W alignment, and a general skew to NE–SW rather than NW–SE align-ments. Off the main edifice (Fig. 8E) the results show that the prevailing vent alignment range is N000–020E°.
The preferential E–W orientations observed in Figure 8C arise due to the large number of elongated craters (clearly present on the south-ern rim of the complex; Fig. 5). Figures 8C and 8D both support the existence of E–W-oriented structures feeding surface eruptions; follow-ing the precedfollow-ing discussion, it is assumed this is the surface manifestation of an underlying elliptical caldera structure. Crater and fissure line orientations (Fig. 8C) as well as vent align-ments (Fig. 8D) also show N–S and NNE–SSW orientations; these are representative of aligned elongate craters on the east and west margins of the caldera ring structure (Fig. 5) but also align-ments along the major tectonic fault structure (Artu Jawe fault zone). Off the main edifice (Fig. 8E) vent alignments are very close to the observed fault strike of the Wonji faults (Fig. 8A), strengthening the case that beyond the cal-dera tectonic fault structures are the dominant control on magma pathways.
Hydrothermal Features
Figure 4 shows the zones of hydrothermal alteration, fumaroles, and hot springs mapped using the aerial photos and supplemented by mapping reports from the Geological Survey of Ethiopia (Kebede et al., 1985). A summary of the main hydrothermal features and their links to the volcanic and tectonic structures is provided in Table 1.
Along the Artu Jawe fault zone (Fig. 5) fuma-roles continue both north and south of the fault scarp (Figs. 5 and 7B), indicating that the fault continues beneath the young volcanic cover (Fig. 7A). Hydrothermal alteration is also found at the base of the remnant caldera rim (Fig. 4), where several zones of fumaroles are seen ema-nating from fractures in altered lava (Fig. 3C; Bobesea, Table 1). The lines of fumaroles (iden-tified in Fig. 3C) follow a NW–SE trend,
identi-cal to the orientation of the identi-caldera rim, and thus are linked to a buried ring fault.
Not all hydrothermal features on Aluto can be correlated with mapped structures. For example, on the west flank of Aluto fumaroles occur over a large area at Hulo and Auto (HL and AT in Fig. 4) and while these may link to structures and aligned volcanic vents northwest of the edifice, evidence for a tectonic control at the surface is absent (Fig. 6B). On the southern
flank of Aluto, fumaroles at Kore and Gebiba (K and GB in Fig. 4) also show no clear struc-tural association.
CO2 Degassing
The CO2 flux values measured on Aluto span several orders of magnitude, varying between 0.5 and 40,000 g m–2 d–1. Background CO
2 flux measurements at locations 10–20 km away from
crater and obsidian lava flow
CF: caldera floor
mapped fumarole vents
(this study and Kebede et al., 1985) speculative fault offset in
talus pile fault scarp
SFG: speculative fault gorge
AJFZ: Artu Jawe fault zone
avalanching volcaniclastic deposits
PD: elongate pumice dome, erupted along fault plane
southern rim of Aluto productive geothermal well
non-producing well
B. Active fumaroles and
surface geology
A. Structural features
and geothermal wells
south-west rim of Aluto
N
pumice dome AJFZ: Artu Jawe fault zone
AJFG: Artu Jawe fault gorge continuation?
AJFG: Artu Jawe fault gorge continuation?
CF: caldera floor
~500 m
[image:10.594.178.561.61.588.2]SFG: speculative fault gorge Figure 7. Three-dimensional
Aluto ranged from 0.5 g m–2 d–1 in rocky organic-poor soils to 6 g m–2 d–1 in darker organic-rich soils (i.e., vegetated areas with more abundant leaf litter). A flux of 6 g m–2 d–1 was taken as the upper limit for a purely biogenic background CO2 flux in the study area. These fluxes are low when com-pared to values that characterize soils in less arid climates, 10–30 g m–2 d–1 (Mielnick and Dugas, 2000; Rey et al., 2002; Cardellini et al., 2003).
Transects Across Major Structures
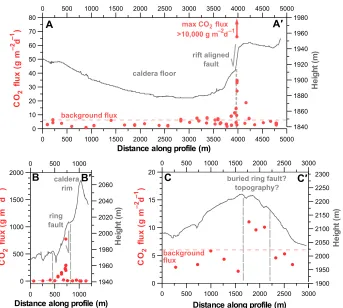
The CO2 degassing transects across the main structural features (A–A′, B–B′, C–C′; Fig. 5A) correspond with lidar-derived topography and soil CO2 flux profiles shown in Figure 9. Profile A–A′ is along the center of the volcanic complex across the caldera floor and intersects the Artu Jawe fault zone to the east. The
topog-raphy reveals the smoothly downward-curving caldera floor and the well-defined ~50 m offset across the fault zone. The CO2 flux through the caldera floor is below or very close to the back-ground biogenic flux value. The absence of sig-nificant degassing through the caldera floor is in line with remote sensing observations that did not indicate any clear fault offsets. Adjacent to and within 500 m of the fault scarp the CO2 flux is significantly above the background levels . The scale in Figure 9 (A–A′) was chosen to illustrate the small variations in the low fluxes, and maximum values measured along the fault zone were >10,000 g m–2 d–1 (the full range of flux values along the fault zone is shown in Fig. 10).
Profile B–B′ transects the remnant caldera rim structure. The CO2 flux shows greatest
val-ues (to 1850 g m–2 d–1) at the base of the cal-dera rim, with lower values (2–7 g m–2 d–1) to the southwest and on the caldera rim. The area of anomalous degassing is defined by several sets of fumaroles; CO2 flux values are greatest on fumaroles (500–1850 g m–2 d–1) and lower in cohesive soils between the open fractures (15– 240 g m–2 d–1; Fig. 3C).
Profile C–C′ follows the topographic high on the southern rim of the complex. The CO2 flux values increase from low background values (<6 g m–2 d–1) to 11 g m–2 d–1 at the peak and immediately south of the rim. Elevated CO2 flux values coincide with the hypothesized location of the ring fault. However, the maximum values encountered at the peak were significantly lower than those found on profile B–B′, and no evident structural feature was exposed at the surface. A. Wonji fault strike
D. Azimuth between volcanic vents on main edifice
B. Border fault strike
C. Crater and fissure orientation on main edifice
mean = N012°E
E. Azimuth between volcanic vents off main edifice ring
structure long axis ring structure
short axis mean = N032°E
0
90
[image:11.594.70.508.62.347.2]180 270
Artu Jawe Fault Zone
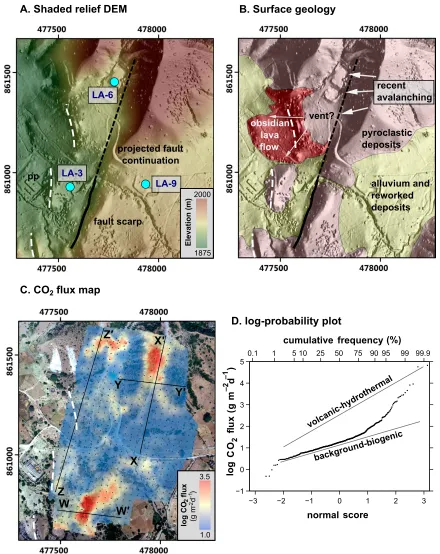
On profile A–A′ (Fig. 9), there are consid-erable CO2 flux variations encountered in the fault zone. To better constrain these variations along the fault, we undertook a high-resolution (30 m) sampling survey. Figure 10 provides topography, surface geology, and soil CO2 flux results for the survey area (outlined in Fig. 5B). The shaded relief DEM (Fig. 10A) identi-fies the main ~50-m-high fault scarp (Fig. 3A) and its projected continuation north, where it is obscured by pumice dome deposits (identified in Figs. 5B and 7). To the west of the main fault scarp there are a number of smaller breaks in topography (10–20 m high) (white dashed lines in Fig. 10A).
Figure 10B shows the surface geology map. The area is largely covered in young tephra (pumice fall and pyroclastic deposits) sourced either from the pumice dome to the north of the study area (Figs. 5B and 7) or from erup-tive vents on the southern rim of the caldera complex. At the base of these slopes, tephras were reworked by fluvial processes and are rep-resented by fine-grained alluvium and gravel deposits. A porphyritic obsidian flow is located on the west of the grid. The obsidian flow is likely sourced from a vent at the base of the cliff; however, recent avalanching of the vol-cani clastic deposits in the cliff has obscured the exact position of the vent.
The soil CO2 flux map (Fig. 10C) shows that the flux varies by several orders of magnitude across the survey area, while a log probability plot (Fig. 10D) shows a bimodal distribution confirming the existence of two distinct CO2 sources (i.e., background biogenic and volcanic hydrothermal; Chiodini et al., 1998) that con-tribute to the degassing. The highest CO2 flux values are found close to fumarole vents, sug-gesting that in those areas CO2 travels mostly with hydrothermal steam. From the mean of the simulations the total diffuse CO2 emission for the 800,000 m2 grid (Fig. 10C) is calculated as 62 ± 12 t d–1.
[image:12.594.70.370.59.726.2]Transect lines shown in Figure 10C link to Figure 11, which show the topography and flux measurements along the profile line. On profile W–W′, peak flux values occur at the base of the main cliff, associated with a fault plane. Profiles X–X′ and Y–Y′ (Fig. 11) cross the ridge of pyro-clastic deposits east of the fault and also show a relationship between CO2 flux and topogra-phy, with peak values in CO2 flux close to but slightly displaced from the absolute topographic high. Profile Z–Z′ crosses several lithologies on the west of the grid; CO2 flux values are on average lower on the obsidian lava flow depos-its compared to the tephra deposdepos-its to the north and south.
TABLE 1. SUMMA
RY
OF
THE MAIN HYDROTHERMA
L
FEA
TURES ON
THE
ALUT
O VOLCANIC COMPLEX
Area Eastin g (m) Northin g (m)
Maximum temperature at 5–15 cm
(°C) Maximum CO 2 fl ux (g m
–2 d –1) Structural association Notes Hulo (HL) 469800 860300 95 † ND W est Aluto faul tL
arge area of hydrothermal alteration with several groups of fumarole vent
s Auto (A T) 470000 861300 94 † ND W est Aluto fault
Fumaroles located southeast of well LA-2 on west
fl ank of
Aluto (Fig. 2D), signi
fi cant alteration of
pumice to red/orange clays
Adonshe (AD) 472700 861900 85 † ND
Continuation of NE–SW fault?
Altered pumiceous ground through which fumaroles are issued
Humo (HM) 474000 860900 77 † eg ro g gn ol a gni dn et xe st elt uo el or a muf er ut ar ep met -wo L n wo nk n U D N W orbota (WB) 474300 863200 85 *2 300
NE–SW fault or ring fault?
Steaming ground found in small crater and patches of orange/brown alte
red ground within 1 km
North Bay (NB)
475000 852300 67 † ND Outfl
ow along water tabl
eS
everal springs located along the northern shore of Lake Langan
o Oitu Artu (OA) 475100 856200 94 † ND Continuation of Artu Jawe fault zone?
Fumaroles exposed in N–S oriented gorge, fumaroles emanate from rhyolite lava units at base of gorge, surrounding pumices is altered to yellow/red clay
, fumaroles have
H2
S smell
Edo Laki (EL
)4 75100 85040 09 5 † dn al si eht fo er oh s eht gn ol a sl oo p du m dn a sg nir ps to H n wo nk n U D N
Artu Jawe (AJ)
476500
860200
95*
10,000–40,000
Artu Jawe fault zone
Large groups of fumaroles located east of power plant, steam has
H2
S smell, alteration of rhyolite
and pumice surface lithologies
Finkilo (FK) 47710 08 5920 08 5 † ND
Artu Jawe fault zone
Groups of fumaroles emanating from rhyolitic lava units in N–S-oriented gorge,
H2
S smell,
alteration of surface rocks to red-brown clays
Kore (K) 47780 08 5770 09 5 † ND Hidden NNE–SSW -trending
fault or lateral outfl
ow from
Artu Jawe fault zone
?
Fumaroles aligned in north-south running gorge, issued through rhyolite lava
Gebiba (GB) 478500 855900 95 *5 400
Hidden NNE–SSW–trending fault or lateral outfl
ow from
Artu Jawe fault zone
?
Fumaroles at base of gorge oriented NNE,
H2
S smell, alteration of pumice to red/gray clays
ir ar edl ac tn an me r ot lel la ra p( se gdi r gni dn er-E S– W Nl ar ev es ni dn et xe st ne v el or a mu F tl uaf gni R 05 81 *3 9 00 01 68 00 10 84 ) B O B( ae se bo B m), large
area of hydrothermal alteration where pumices are altered to red/gray clays
Note:
A
bbreviations of areas are keyed to locations given in Figure 4 (see text). ND—no data.
*Ground temperature measurements made in the
fi eld with thermocouple during this stud
y.
†Ground temperature measurements made in the
fi eld with thermocouple by Kebede et al. (1985)
DISCUSSION
Tectonic Features Dissecting the Volcano
The results of this study, combined with prior mapping and geothermal well data (Dakin and Gibson, 1971; Di Paola, 1972; Kebede et al., 1985; Gebregzabher, 1986; Valori et al., 1992; Gizaw, 1993; Gianelli and Teklemariam, 1993), show that the Aluto volcanic complex has been dissected by normal faults related to the regional extensional tectonics, which have in turn influenced the distribution of volcanic products. The aligned vent trains that cross Aluto reflect magma pathways controlled by faults. Young vents and craters on and off the main edifice show a prevailing alignment to the regional NNE–SSW strike of the Wonji faults (Figs. 4 and 8), although there is field evidence that minor NE–SW-oriented structures may also exist (Fig. 6C).
Physical evidence for the link between faults and volcanic activity is particularly clear along the Artu Jawe fault zone, where magma has erupted along the fault, building an elongate
pumice dome (Figs. 5B and 7). The Artu Jawe fault zone remains a high permeability pathway through which steam (Fig. 4) and CO2 (Fig. 10C) ascend to the surface, as evidenced by the zones of fumarolic alteration and peaks in CO2 flux along the fault structure (A–A′; Figs. 7 and 9). Our work shows that hydrothermal mapping (Figs. 4 and 7) and CO2 soil-gas surveys (Fig. 10C) can be used to identify high permeability zones, revealing the locations of hidden fault structures when multiple observational data sets are considered together (e.g., Figs. 7 and 10).
Understanding the initiation and growth of these faults is critical to address the develop-ment of the Aluto volcanic complex. At present the best evidence for major fault zones on Aluto, and the only constraints on their development, are provided by the deep wells. Of particular significance is a Pleistocene lacustrine horizon that can be correlated between wells (Fig. 2B; Gianelli and Teklemariam, 1993; Gizaw, 1993) and shows a stepped west to east thinning sug-gestive of faulting. This unit is beneath the vol-canic products of Aluto (Fig. 2B), implying that significant faulting preceded surface silicic
vol-canism, and hence these preexisting faults may have controlled magmatic processes throughout the growth of Aluto. Investigations of the Soddo region in the southern MER by Corti et al. (2013b) found a similar relationship, with both basaltic and rhyolitic volcanic centers following closely preexisting border faults.
Aluto Caldera
A number of previous studies have suggested that Aluto has undergone a caldera-forming event (Dakin and Gibson, 1971; Le Turdu et al., 1999), and our observations help to confirm this. Taking together the presence of a remnant caldera rim (Figs. 2A, 4, and 5), the occurrence of eruptive vents on an elliptical (ring) struc-ture (Figs. 4 and 5) and the correspondence of this to zones of hydrothermal alteration (Fig. 4) and local peaks in CO2 degassing (B–B′, C–C′, Fig. 9), we propose that an underlying ring frac-ture system that matches the mapped caldera rim remnant can explain these observations.
A major challenge in defining this structure is that the exposure of the remnant caldera rim is limited to the northeast of the complex (only covering ~8% of the ellipse; Fig. 4). We assume that the rest of the structure has been covered by post-caldera volcanic deposits or eroded. This is typical of peralkaline volcanic edifices that undergo repeated phases of caldera collapse and caldera-filling volcanism (Cole et al., 2005) that overspill the caldera rim and mask its surface expression (Mahood, 1984). The size (~8 km × ~5 km) and shape of the proposed Aluto ring structure (Figs. 4 and 5B) are similar to other peralkaline complexes in the MER (Cole, 1969; Mohr et al., 1980; Acocella et al., 2003; Rampey et al., 2010), and within the upper range of other peralkaline calderas worldwide (Mahood, 1984; Cole et al., 2005). The caldera wall on Aluto (>50–60 m in height) is comparable to other peralkaline calderas where subsidence is a few hundred meters (Mahood, 1984).
The elliptical caldera form is typical of con-tinental rift volcanoes worldwide (e.g., Wilson et al., 1984; Acocella et al., 2003; Bosworth et al., 2003; Casey et al., 2006; Geyer and Marti, 2008). Elliptical calderas may be produced by a number of different mechanisms (Holohan et al., 2005), including (1) collapse of an ellipti-cal magma reservoir; (2) nesting, where multi-ple collapse structures overlap and give rise to an elongate geometry; (3) shallow crustal pro-cesses, where asymmetric collapse, or distortion of caldera faults leads to an asymmetric caldera above a circular magma chamber; and (4) post-caldera modification, where a circular post-caldera is distorted by erosion or regional deformation. Ultimately, the infilling of the Aluto caldera has 0 500 1000 1500 2000 2500 3000
0 5 10 15 20
0 500 1000 0
500 1000 1500 2000
0 500 1000
1940 1960 1980 2000 2020 2040 2060
0 500 1000 1500 2000 2500 3000
1900 1950 2000 2050 2100 2150 2200 2250 2300
C
C′
background flux
0 500 1000 1500 2000 2500 3000 3500 4000 4500 5000 0
10 20 30 40 50 60 70 80
0 500 1000 1500 2000 2500 3000 3500 4000 4500 5000
1840 1860 1880 1900 1920 1940 1960 1980
A
A′
B
B′
buried ring fault?topography? rift aligned
fault
ring fault
caldera floor
caldera rim
CO
2
flux
(
g
m
–2 d –1 )
CO
2
flux
(
g
m
–2 d –1 )
CO
2
flux
(
g
m
–2 d –1 )
Distance along profile (m) Distance along profile (m)
Distance along profile (m)
He
ight
(m)
He
ight
(m)
He
ight
(m)
max CO flux >10,000 g m d 2 –2 –1
[image:13.594.30.373.58.366.2]background flux
B. Surface geology
C. CO
2flux map
A. Shaded relief DEM
pp
fault scarp
projected fault continuation
alluvium and reworked deposits
obsidian lava flow
pyroclastic deposits vent?
recent avalanching
Elevation (m
)2000
1875 LA-9
LA-6
LA-3
W
W′
X
X′
Y
C'
Z′
Z
log CO flux
3.5
1.0
2
(g m d
)
-2
-1
Y′
−3 −2 −1 0 1 2 3
−1 0 1 2 3 4 5
CO
2
flux
(g
m
–2 d –1 )
lo
g
normal score cumulative frequency (%)
D. log-probability plot
volcanic-hydrothermal
background-biog enic
50 75 90 95 99 99.9
5 01 25 1
[image:14.594.86.526.60.614.2]0.1
left little information concerning the original collapse structure and the nature of the collapse event. In particular, it is unclear whether the cal-dera collapse involved one or multiple events, to create a nested structure (as is typical for peralkaline volcanic complexes; Mahood and Hildreth, 1983; Mahood, 1984; Rampey et al., 2010). It is also not possible to infer whether collapse was asymmetric or whether subsidence was accommodated by existing tectonic faults. Assuming that collapse took place at 155 ka, the only age constraint for the major ignimbrite deposits of Aluto (ELC Electroconsult, 1986), and assuming current extension rates of 5 mm yr–1 (Bendick et al., 2006; Stamps et al., 2008), then this would generate <1 km of extension since caldera formation (i.e., not sufficient to explain all of the E–W elongation).
The elliptical calderas of the East African Rift system are frequently linked to the collapse of elongate magma chambers (e.g., Bosworth
et al., 2003; Acocella et al., 2003). The genesis of elongate magma chambers in a continental rift currently revolves around two distinct mod-els, one related to the regional extensional stress field causing differential spalling of the walls of the magma reservoir (Bosworth et al., 2003), and the other related to preexisting structural weaknesses, such as pre-rift faults, facilitat-ing preferential magma chamber development (Acocella et al., 2003). To explain caldera elon-gation using the preexisting structures model requires a detailed understanding of the evolu-tion and orientaevolu-tion of regional fault patterns. For example, Acocella et al. (2003) identified a number of E–W-oriented pre-rift tectonic struc-tures on the flanks of the MER and invoked these to explain elongate calderas at Fentale, Kone, and Gedemsa. We investigated fault maps of the MER presented by Acocella et al. (2003), Abebe et al. (2007), and Agostini et al. (2011), as well as our own satellite imagery and could
not highlight any clear E–W structures on the rift plateau adjacent to Aluto. On the other hand, however, the E–W elongation of the Aluto cal-dera is almost orthogonal to the active Wonji faults of the central MER (Fig. 8A) and paral-lel to the Nubia-Somalia displacement vector (~N100°E; Bendick et al., 2006; Keir et al., 2006; Pizzi et al., 2006; Stamps et al., 2008). This observation is consistent with the idea that the regional stress field played a role in magma reservoir development at Aluto (cf. Bosworth et al., 2003).
Compared to neighboring MER volcanoes, Aluto has undergone considerable post-caldera volcanism. Shala (Mohr et al., 1980), Gedemsa (Peccerillo et al., 2003), and Kone (Cole, 1969; Rampey et al., 2010) volcanoes have all under-gone caldera-forming eruptions; however, post-caldera activity has been modest, building up small domes of pumice and obsidian (within the caldera and adjacent to the caldera ring fault).
0 100 200 300 101
102 103 104 105
106 0 100 200 300
1840 1860 1880 1900 1920 1940 1960
Distance along profile (m)
CO flux conc. up fault zone
seep into HW
seep into FW
W
W′
He
ight
(m
)
2
CO
2
flux
(g
m
–2 d –1 )
log
0 100 200 300 400 500 600
101 102 103
104 0 100 200 300 400 500 600
1900 1920 1940 1960 1980 2000 2020 2040 2060
He
ight
(m
)
X
hot steam andgas driven up topography
volcaniclastic cover
X
′
CO
2
flux
(g
m
–2 d –1 )
log
Distance along profile (m)
0 100 200 300 0
50 100 150 200
Distance along profile (m) 0 100 200 300
1900 1920 1940 1960 1980 2000 2020 2040 2060
Y
hot steamY′
and gas driven to topographic
high
He
ight
(m
)
buried fault scarp?
CO
2
flux
(g
m
–2 d –1 )
0 100 200 300 400 500 600 700 800
101 102 103 104 105
0 100 200 300 400 500 600 700 800
1860 1880 1900 1920 1940 1960 1980
He
ight
(m
)
Z
Z′
obsidian lava flow (low pemeability) volcaniclastic cover
and alluvium
volcaniclastic cover
?
topographic control?
CO
2
flux
(g
m
–2 d –1 )
log
[image:15.594.35.551.60.424.2]Distance along profile (m)
At Corbetti, two silicic cones (Chabbi and Urji) have built up within the caldera (Mohr, 1966; Di Paola, 1971). Chabbi, the larger and more voluminous of these, has built up on the east of the caldera floor and now completely covers the caldera wall on the eastern side of the complex (Di Paola, 1971). This may provide a possible analogue to Aluto, which has undergone widely distributed post-caldera volcanism along the ring fracture, and thus only a small segment of the caldera wall is retained (Fig. 4).
Controls on CO2 Degassing and the Hydrothermal System
Volcanic CO2 Degassing
At the edifice scale, both regional tectonic faults (such as the Artu Jawe fault zone; A–A′, Fig. 9) and the volcanic ring fracture (B–B′, Fig. 9) have a strong control on diffuse CO2 emissions. The escarpment of the Artu Jawe fault zone (W–W′ in Fig. 11) shows that CO2 gas is concentrated along the fault plane and that flux values remain high over a ~50-m-wide high permeability crushed zone across the fault. Across the southern rim of the complex we find elevated CO2 fluxes spread over a ~500-m-wide zone (C–C′, Fig. 9), where we infer that a ring fault is deeply buried beneath a thick pile of volcanic deposits. Without deep penetrating structures connecting reservoir to surface, significant soil-flux degassing peaks (such as A–A′, B–B′, Fig. 9) are unlikely to be observed.
Substantial variations in the spatial pat-tern of CO2 degassing are evident both paral-lel and transverse to the major structures when observed at scales <100 m (Fig. 10C). These are linked to permeability variations in the near sur-face (Schöpa et al., 2011; Pantaleo and Walter, 2013) possibly caused by changes in lithology or changes in the topography-induced stress field (that focuses the permeable pathways toward the morphological crests). There is a correla-tion between local topography and degassing flux (Fig. 11, X–X′, Y–Y′) in the pumice dome (Fig. 10). Our interpretation is that the pumice dome deposits have buried the Artu Jawe fault scarp, and thus steam and gas rising up along the fault plane enter the base of the dome and become focused toward the morphological ridge crest. A similar morphological control has been observed at Vesuvius (Italy), where CO2 anoma-lies are concentrated in the inner slopes of the crater rim (Frondini et al., 2004). The key differ-ence on Aluto is that CO2 gas and steam are fed into the base of the volcanic pile from a tectonic fault rather than a volcanic conduit.
Several (e.g., Peltier et al., 2012; Pantaleo and Walter, 2013) have studied the influence of sur-face lithology and soil texture on permeability, and our data set permits a qualitative assessment for Aluto. Profile Z–Z′ (Fig. 11) crosses several contrasting lithologies west of the Artu Jawe fault scarp; CO2 fluxes are on average lower on the obsidian lava flow deposits compared to pumiceous deposits north and south. This could be evidence that the lower permeability obsidian
lava flow restricts or deflects gas flux relative to the more permeable, poorly consolidated clastic deposits.
[image:16.594.45.570.464.698.2]The total CO2 flux value of 62 t d–1 calculated along the 0.8 km2 section of the Artu Jawe fault zone represents both the volcanic-hydrothermal and biogenic CO2 flux. Assuming that a mean biogenic flux of 6 g m–2 d–1 is constant over the survey area, subtracting this contribution from the total CO2 release would give a total vol canic-hydrothermal CO2 emission of 57 t d–1. This is comparable to other sites of volcanic CO2 degas-sing worldwide (Table 2), and when standardized to a CO2 flux per area (71 t d–1 km–2), it is similar to geothermal sites in other rift zones, such as the Reykjanes geothermal area (Iceland; Frid-riksson et al., 2006), and Taupo volcanic zone (New Zealand; Werner and Cardellini, 2006). Given that the total area of hydrothermal altera-tion and degassing features on Aluto (Fig. 4) is 5–10 times larger than the area covered by the CO2 flux survey (Fig. 10C), we expect total CO2 emission from Aluto to be 250–500 t d–1. This magnitude of diffuse CO2 release is compara-ble to a number of other volcanoes that have either undergone Holocene eruptions and/or show signs of unrest, e.g., Pululahua caldera (Ecuador), Vesuvius, Teide (Canary Islands), and Rotorua (New Zealand) (see Table 2). The estimated CO2 flux for Aluto is also comparable to mean volcanic plume CO2 fluxes measured at active volcanoes such as Merapi (Indonesia), Vulcano (Italy), Sierra Negra (Ecuador), and Villarrica (Chile) (see Burton et al., 2013, and
TABLE 2. COMPILATION OF DIFFUSE CO2 EMISSIONS FROM SELECTED VOLCANIC DEGASSING AREAS OF THE WORLD
Study area CO(t d2 fl ux–1) (kmArea2) CO(t km2 fl ux density–2 d–1) Reference
) 8 0 0 2 ( .l a t e n ó r d a P 8 3 . 3 1 6 0 1 r o d a u c E , a r e d l a c a h c o c i u C ) 8 0 0 2 ( .l a t e n ó r d a P 0 1 6 . 7 2 0 7 2 r o d a u c E , a r e d l a c a u h a l u l u P ) 1 0 0 2 ( .l a t e a r a v a F 2 1 4 8 9 8 9 y l a tI , d n a l s i a ir e ll e t n a P ) 6 9 9 1 ( .l a t e k c i n e p e o K 2 3 4 1 . 3 0 0 1 * a i n a z n a T ,i a g n e L o y n i o d l O ) 2 0 0 2 ( .l a t e e k i o m i h S 2 3 5 . 2 0 8 n a p a J , o n a c l o v a m j o w I -a m u s t a S ) 5 0 0 2 ( .l a t e u s t o N 5 3 2 2 0 6 7 n a p a J , o n a c l o v a m ij o w I ) 4 0 0 2 ( .l a t e i n i d n o r F 5 3 5 . 5 8 . 3 9 1 y l a tI , s u i v u s e V
Mount Epomeo, Italy (western flank) 32.6 0.86 38 Chiodinieta.l(2004) ) 8 9 9 1 ( .l a t e i n i d o i h C 9 3 9 . 1 5 7 ) s e p o l s n r e h t u o s d n a n r e t s e w ( y l a tI , d n a l s i o n a c l u V ) 3 0 0 2 ( .l a t e i n il l e d r a C 2 4 2 4 8 e c e e r G , a r e d l a c s o r y s i N ) 8 9 9 1 ( .l a t e i n i d o i h C 3 4 2 . 3 8 3 1 a n i h C , d l e fi l a m r e h t o e g n i a j a b n a Y ) 6 0 0 2 ( .l a t e n o s s k ir d ir F 1 6 2 2 . 0 5 . 3 1 d n a l e c I , a e r a l a m r e h t o e g s e n a j k y e R
Rotorua geothermal system, Taupo Volcanic Zone, New Zealand 620 8.9 70 Werner and Cardellini (2006) y d u t s s i h T 1 7 8 . 0 7 5 ) e n o z tl u a f e w a J u t r A ( a i p o i h t E , o t u l A ) 1 0 0 2 ( .l a t e z e d n á n r e H 7 6 1 6 . 0 0 5 1 – 0 0 1 ) ti m m u s ( n a p a J , o n a c l o v a m ij e k a y i M ) 0 1 0 2 ( .l a t e s o ri e v i V 6 8 1 2 . 5 8 6 9 s e r o z A , d n a l s I l e u g i M o ã S , o n a c l o v s a n r u F
Hakkoda volcanic area, Japan (localized flankarea) 127 0.58 219 HernándezPerezeta.l(2003) ) 8 0 0 2 ( .l a t e o r d n a s s e l A ’ D 9 5 2 1 0 . 0 9 5 . 2 e c e e r G , m e t s y s c i n a c l o v a n a h t e M ) 8 0 0 2 ( .l a t e r e n r e W 7 8 3 6 1 . 0 0 6 e n o t s w o ll e Y , n i s a B g n ir p S t o H ) 0 0 0 2 ( .l a t e r e n r e W 4 9 4 5 . 3 0 3 7 1 e n o t s w o ll e Y , o n a c l o v d u M ) 7 0 0 2 ( .l a t e n a L 9 5 6 3 0 . 0 4 . 2 2 ) r e t a r c c it a e r h p ( n a w i a T , a e r a l a m r e h t o r d y h u K -g n a u H -u i L ) 8 9 9 1 ( .l a t e z e d n á n r e H 7 1 7 3 5 . 0 0 8 3 ) a e r a ti m m u s ( n i a p S , o n a c l o v e d i e T
Mammoth Mountain, Horseshoe Lake (flankarea) 104.3 0.13 802 Cardelilnieta.l(2003) Nea Kameni, Santorini, Greece (summit area)† 21–38 0.02 1050–1900 Parks et al. (2013)
) 1 0 0 2 ( .l a t e i n i d o i h C 0 0 5 1 1 0 0 5 1 y l a tI , o n a c l o v a r a t a fl o S ) 1 0 0 2 ( .l a t e r a z a l a S 8 2 8 4 8 5 . 0 0 0 8 2 a u g a r a c i N , o n a c l o v o r g e N o r r e C
Note: Compilation is after Viveiros et al. (2010) and Burton et al. (2013).