Two-photon interference from a quantum dot microcavity:
Persistent pure dephasing and suppression of time jitter
Sebastian Unsleber,1Dara P. S. McCutcheon,2Michael Dambach,1Matthias Lermer,1Niels Gregersen,2Sven H¨ofling,1,3
Jesper Mørk,2Christian Schneider,1and Martin Kamp1
1Technische Physik and Wilhelm Conrad R¨ontgen Research Center for Complex Material Systems, Physikalisches Institut, Universit¨at W¨urzburg, Am Hubland, D-97074 W¨urzburg, Germany
2Department of Photonics Engineering, Technical University of Denmark, Ørsteds Plads, 2800 Kgs. Lyngby, Denmark 3SUPA, School of Physics and Astronomy, University of St. Andrews, St. Andrews KY16 9SS, United Kingdom
(Received 5 November 2014; revised manuscript received 21 January 2015; published 12 February 2015) We demonstrate the emission of highly indistinguishable photons from a quasi-resonantly pumped coupled quantum dot–microcavity system operating in the regime of cavity quantum electrodynamics. Changing the sample temperature allows us to vary the quantum dot–cavity detuning and, on spectral resonance, we observe a threefold improvement in the Hong-Ou-Mandel interference visibility, reaching values in excess of 80%. Our measurements off-resonance allow us to investigate varying Purcell enhancements, and to probe the dephasing environment at different temperatures and energy scales. By comparison with our microscopic model, we are able to identify pure dephasing and not time jitter as the dominating source of imperfections in our system. DOI:10.1103/PhysRevB.91.075413 PACS number(s): 73.21.La
I. INTRODUCTION
Single indistinguishable photons are key to applications in quantum networks [1], linear optical quantum computing [2,3], and quantum teleportation [4,5]. One of the most promising platforms for single-photon sources is solid-state quantum dots (QDs) [6–10]. Compared to alternative platforms, such as cold atoms or trapped ions, single QDs offer several advantages: they can be driven electrically, which is of crucial importance for compact future applications [11–13], and, in principle, can be integrated in complex photonic environments and architec-tures, such as on-chip quantum optical networks [14,15]. When embedded in a bulk semiconductor, however, QDs suffer from poor photon extraction efficiencies, since only a minor fraction of the photons can leave the high refractive index material. This problem can be mitigated by integrating QDs into optical microcavities [12,16–18] or photonic waveguides [19–21], which can enhance extraction efficiencies to values beyond 50%.
In addition to increased extraction efficiencies, exploiting cavity quantum electrodynamics (cQED) effects in QD-based sources can have a positive effect on the interference properties (and hence the indistinguishability) of the emitted photon wave packets. Ideally, the wave packets emitted by an indistinguishable photon source are Fourier limited, with a recombination time T1, and temporal extension of the wave packet given byT2=2T1[22]. If additional dephasing channels with a characteristic time 1/γexist, such as coupling to phonons or spectral diffusion, the coherence time is reduced according to 1
T2 =
1
2T1+γ, which consequently leads to a
reduction of the two-photon interference (TPI) visibility. It was theoretically shown that pure dephasing strongly affects the detuning dependence of the relative strength of the cavity and QD-emission peaks [23,24]. In the regime of cQED, the lifetime of the QD excitons can be manipulated via the photonic density of states in the cavity (the Purcell effect). If the timing of emission events is precisely known, and
γ is constant, shortening of the emitter lifetime T1 via the Purcell effect leads to an improved interference visibility as the
conditionT2=2T1 can be approximately restored [7,17,25]. This simple picture, however, is known to break down if there are uncertainties in the timing of emission events (time jitters) [26–28] or if the dephasing environment gives rise to more than a simple constant pure-dephasing rate, as is known to be the case for phonons [28–32]. As such, with the aim of designing improved single indistinguishable photon sources, it is crucially important to first establish the magnitude of time jitters and the nature of any dephasing environments.
In this work, we exploit a microcavity with a high Purcell factor and weak nonresonant contributions of spectator QDs to probe the interference properties of photons emitted from a single QD as a function of the QD-cavity detuning. In contrast to previous studies, where nonresonant coupling to spectator QDs [33] or strong temperature-induced dephasing [25] dominated the experiments, we observe a strong improvement of the two-photon visibility on resonance, which exceeds a factor of three compared to the off-resonant case. We extend the theoretical model of Ref. [28] to derive an expression for the Hong-Ou-Mandel dip, including the effects of both time jitter and pure dephasing on- and off-resonance. This allows us to reject timing jitter and definitively attribute sources of pure dephasing as the dominant factor limiting the indistinguishability of our photons. Furthermore, we show that the degree of symmetry we observe for positive and negative detuning suggests pure dephasing caused by both phonon coupling and spectral diffusion.
II. QUANTUM DOT–CAVITY SYSTEM
The device under investigation comprises a QD embedded in a micropillar cavity with a quality factor of Q=3200. The layer structure consists of 25 (30) alternating λC
10 15 20 25 30 1.3495
1.3500 1.3505 1.3510
C,Q≈3200
Temperature (K)
En
e
rg
y
(e
V)
X
Intensity (arb. units)
Temperature (K)
Energy (eV)
Cavity
QD
T
(ps)
Detuning (meV) 0.4 0.2 0.0 0.2 0.4 0.6 0.8 1.0
100 200 300 400
(a) (b)
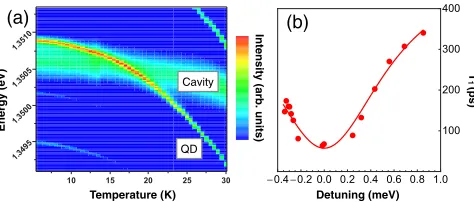
FIG. 1. (Color online) (a) Temperature-dependent intensity map of the QD-cavity system. The QD reaches spectral resonance with the cavity mode at T =17.5 K. (b) QD lifetime as a function of QD-cavity detuning. The fit is a Lorentzian profile where the linewidth is fixed to the cavity linewidth. A Purcell enhancement of
FP=7.8±2.3 is extracted.
in the central layer of the tapered segment, i.e., in the vertical maximum of the optical field [34]. Micropillars with varying diameters were etched into the wafer (the pillar under investigation has a diameter of 1050 nm) to provide zero dimensional mode confinement. As a result of the Bloch mode engineering [34], our micropillars support optical resonances with comparably large quality factors down to the submicron diameter range, which yields the possibility to significantly increase the Purcell factor in such microcavities compared to conventional DBR resonators based onλ-thick cavity spacers. The sample was placed inside an optical cryostat, and the QD was excited via a picosecond-pulsed Ti:sapphire laser with a repetition frequency of 82 MHz (pulse separation 12.2 ns). The laser beam was coupled into the optical path via a polarizing beam splitter, which also suppresses the scattered laser light from the detection path of the setup. Further filtering was implemented by a long-pass filter in front of the monochromator. After spectral filtering, the emitted photons were coupled into a polarization maintaining single-mode fiber followed by a fiber-coupled Mach-Zehnder interferometer (MZI) with a variable fiber-coupled time delay in one arm to measure the TPI in a Hong-Ou-Mandel (HOM) setup. The second beam splitter of the MZI can be removed to directly measure the autocorrelation function of the signal.
Figure 1(a) shows the temperature-dependent micropho-toluminescence (μ-PL) map of the investigated QD-cavity system, which was recorded under nonresonant excitation conditions. The QD-emission line, which we attribute to the neutral exciton, can be tuned through the cavity mode by changing the sample temperature. Spectral resonance with the fundamental cavity mode is achieved at T =17.5 K. Due to the Purcell enhancement, the integrated intensity of the QD increases by a factor of more than three when the QD and cavity are tuned into resonance. In order to directly and accurately extract the Purcell factor of our coupled system, we measured the exciton lifetime via time-resolvedμ-PL as a function of the QD-cavity detuning (see AppendixA 2). As seen in Fig.1(b), we observe a strong decrease of the lifetime when the QD is tuned into resonance as a result of the Purcell effect. The Purcell factorFP =TT11((→∞→0)) −1 [35] is extracted by fitting the data with a Lorentzian profile (the width being fixed to the cavity linewidth κ =0.42 meV), and we find a
Coincidence counts
Delay (ns) Detuning (meV)
g
(0)
(b)
-20 0.0 20 40
(a)
0.0 150 300
FIG. 2. (Color online) (a) Autocorrelation histogram on QD-cavity resonance, from which we extractg(2)(0)=(0.058±0.006). (b) Autocorrelation function as a function of QD-cavity detuning (the inset shows a zoom-in of theyaxis).
value as high asFP =7.8±2.3 as a result of the small mode volume of our microcavity.
We now study the single-photon emission properties of our system, which is particularly important on-resonance, where the single-photon characteristics can be deteriorated by nonresonant contributions to the cavity from spectator QDs, or luminescence from the background continuum funneled into the cavity mode [36]. The second-order photon autocorrelation was probed under quasiresonant excitation conditions, with a laser tuned 32 meV to the high-energy side of the single-exciton emission feature, with a (below-saturation) power of 311μW. The on-resonance (T =17.5 K) autocorrelation histogram is shown in Fig.2(a). The strongly suppressed peak aroundτ =0 is a clear signature of single-photon emission. We extract the g(2)(τ =0) value by dividing the area of the central peak by the average area of all the side peaks, leading tog(2)(0)=0.058±0.006, reflecting the high purity of our cavity-enhanced single-photon source. Off-resonance we find a minimum value of g(2)(0)=(0.036±0.005) at
= −0.28 meV (T =6.4 K). For increasing temperatures, we note a modest increase up tog(2)(0)=(0.11±0.01) for
=0.61 meV (T =25.5 K). This value is still close to perfect single-photon emission, and we attribute the slight rise to a lowered signal to background ratio between QD and cavity emission. We note that no deterioration of theg(2)(0) value can be observed on spectral resonance, which suggests only very weak contributions from spectator QDs to the cavity signal.
III. PHOTON INDISTINGUISHABILITY
[image:2.608.54.291.72.173.2] [image:2.608.311.557.74.165.2]Delay (ns)
-20 0.0 20 40
Coincidence counts
0.0 50 100
Delay D (ps)
g
HOM
(2)
(
D
)
(b) (a)
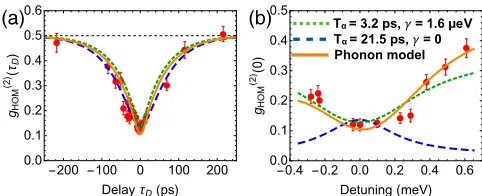
FIG. 3. (Color online) (a) Histogram of the TPI for zero time delay between the two arms of the interferometer, from which we ex-tractg(2)HOM(0)=0.17±0.02. (b) Measured two-photon interference vs the time delay. The measurement shows the clear HOM dip (black dots). Due to a nonvanishing two-photon probability, the data points go slightly above 0.5 for largeτD. These are corrected by subtracting
half the measuredg(2)(0) value on resonance shown in Fig.2(red markers). These corrected data were fitted to extract a visibility of
ν=(83±5)%.
(red markers) (see Appendix B 2). We then fit our data to the functiongHOM(2) (τD)=0.5(1−νexp[−|τD|/T1]), where we setT1 =67 ps [see Fig.1(b)], and we find a visibility of
ν=83±5%. This high value is a direct consequence of the large Purcell factor in our high-quality QD-cavity system.
To further analyze our experimental data and, in particular, to determine the relative influences of time jitter and pure dephasing on the indistinguishability of the emitted photons, we extend the theory of Ref. [28] to derive an expression for the TPI as a function of both time delay τD and detuning. Dephasing caused by coupling to phonons is known to affect the TPI properties of the emission from a QD-cavity system in a highly nontrivial way, giving rise, for example, to pronounced asymmetries for positive and negative QD-cavity detunings [28–30]. We find, however, that nearly all features seen in our data can be well reproduced by a model assuming a simple constant pure-dephasing rate. We present this simplified model first, and then go on to show that by including phonons in a rigorous manner at a Hamiltonian level, the behavior off-resonance allows us to approximately determine the relative influence of phonons as compared to other sources of dephasing.
We model the QD as a three-level system, and consider the vacuum and single-photon Fock states of the cavity. Provided the QD-cavity coupling strength is sufficiently weak and/or the cavity decay rate is sufficiently large, the cavity degrees of freedom can be adiabatically eliminated from the equations of motion for the QD-cavity system [28]. The result is a master equation of the form (see AppendixB 3)
dρ dt = −
i
[|EE|,ρ]+(L (|GE|)
+L2γ(|EE|)+Lα(|EP|))ρ, (1)
where the states |E = |e,n=0, |G = |g,n=1, |P =
|p,n=0 represent the QD in ground (g), single-exciton state (e), or pump level (p), with the cavity containing zero or one excitation. The QD-cavity detuning is , while γ
is the pure-dephasing rate, and α is the rate at which the pump level decays into the single-exciton state, withTα=1/α determining the magnitude of the time jitter (i.e., Tα=0
Tα = 3.2 ps, = 1.6 μeV
Phonon model Tα = 21.5 ps, = 0
(a) (b)
FIG. 4. (Color online) (a) HOM dip and HOM-dip depth as a function of detuning (b). The dashed blue curves correspond to a parameter set for which time jitter dominates, which we find to be inconsistent with the data off-resonance shown in (b). The dotted green curves correspond to a parameter set for which pure dephasing dominates, which is able to consistently reproduce all data. The solid orange curves again correspond to a parameter set dominated by pure dephasing, but where 40% of the dephasing on-resonance is caused by coupling to phonons.
represents the ideal case in which there is no time jitter). The Purcell enhanced spontaneous-emission rate is
=T1−1= B+2g2
γtot
γ2 tot+2
, (2)
with Bthe background decay rate,gthe QD-cavity coupling strength, andγtot=γ +12(κ+ B) with κ the cavity decay rate. The validity of Eq. (1) relies on the condition γtot , ,g, which is satisfied in all our experiments.
Equation (1) can then be used to derive an expression for the normalized coincidence events in the TPI measurements (for details, see AppendixB 3). The second-order correlation function for the HOM interference measurements is found to read
gHOM(2) (τD)= 1 2
1− ν
−α[ e
−|τD|α−αe−|τD| ]
, (3)
where the detuning dependence enters through [see Eq. (2)], andν=[ /( +2γ)][α/( +α)] is the visibility. We note that while the expression forν has been derived before [28], Eq. (3) is able to describe the full behavior of the HOM dip for nonzero values ofτDincluding time jitter and pure dephasing. This model provides us with simple analytical expressions with which we can fit the experimental TPI data. Crucially, it allows us to explore how a given set of parameters simultaneously affects the HOM dipand the TPI visibility as the QD and cavity are moved off-resonance.
In Fig. 4(a), we show again the HOM dip, while in Fig.4(b), we show the depth of the HOM dip as a function of detuning. We see a pronounced rise of the HOM dip as the QD is brought out of resonance, corresponding to visibilities on- and off-resonance which differ by more than a factor of three. The dashed blue curves in Fig. 4 show a fit to Eq. (3) where only the data in Fig. 4(a) (the HOM dip) are considered. Fitting parametersTα =1/α=21.5 ps and
[image:3.608.314.555.70.168.2] [image:3.608.52.295.73.164.2]γ =1.6 μeV, corresponding to a regime for which pure dephasing dominates. These parameters are shown by the dotted green curves, and much better agreement is found. These two fits show that while both time jitter and pure dephasing affect the shape of the HOM dip in a similar way, the reduction in the visibility seen off-resonance can only be explained by a system in which pure dephasing dominates. As the QD and cavity are moved off-resonance, the Purcell effect weakens (see Fig.1) and =1/T1 decreases. For a source dominated by pure dephasing, the visibility is given by ν≈ /( +2γ), and a reduction in causes a reduction in ν. For a source dominated by time jitter, the visibility instead followsν≈α/( +α), and a reduction in increasesν. We stress that which of the two regimes is relevant for a particular system has important consequences for how experimental modifications will translate to improvements in photon indistinguishabilities. In the present case, since pure dephasing dominates, a complete elimination of time jitters (achieved, for example, via strictly resonant excitation conditions) will lead to only a modest 4% increase in the visibility, while an elimination of sources of pure dephasing will lead to an increase of 20% up toν=95%.
IV. DISCUSSION
The low value of Tα=3.2 ps implies that our quasires-onant excitation scheme leads to a very fast relaxation to the desired single-exciton state. This is also supported by the laser detuning we use (32 meV), which corresponds to the energy of a longitudinal optical phonon, known to relax on this time scale [37]. We attribute pure dephasing in our sample as caused by exciton-phonon coupling and spectral fluctuation of the QD energy levels on a time scale shorter than the pulse separation of 12.2 ns. The constant pure-dephasing rate used in our theory is expected to well approximate the spectral fluctuations, but the influence of phonons is known to give rise to more complicated behavior [28–31]. In particular, differing phonon absorption and emission rates at low temperatures are expected to lead to asymmetries for positive and negative detuning [29]. By including phonons using a time-convolutionless master-equation technique (see, e.g., Ref. [28] or AppendixB 5), we find that these asymmetries can improve our fits. The solid orange curves in Fig.4show the predictions of a parameter set similar to that of the dotted green curve, but where we have included phonons with a strength corresponding to approximately 40% of the total pure-dephasing on-resonance [38], and it can be seen that the phonon contribution improves the fits to the data. We note, however, that when increasing the phonon contribution even further, the fits become worse as the asymmetry becomes too strong. The relatively strong symmetry seen in Fig.4(b)
therefore leads us to conclude that both phonons and additional sources of constant pure dephasing (such as a spectral diffusion) are present in our system.
In conclusion, we have demonstrated the feasibility of our cavity design to enhance the emission of indistinguishable single photons generated in epitactically grown InAs QDs. Using a quasiresonant excitation scheme, we were able to show a TPI visibility as high asν=(83±5)% and a two-photon emission probability as low asg(2)(0)=(0.036±0.005). We
studied the influence of the QD-cavity detuning on both the two-photon probability and the degree of indistinguishability of the emitted photons. The TPI measurements are explained by our theory, which takes the QD-cavity detuning, time jitter, and pure dephasing into account, and which identifies sources of pure dephasing as the ultimate factor limiting the indistinguishably of emitted photons.
ACKNOWLEDGMENTS
The authors would like to thank M. Emmerling and A. Wolf for sample preparation. We acknowledge financial support by the State of Bavaria and the German Ministry of Education and Research (BMBF) within the projects Q.com-H, the Chist-era project SSQN, as well as the Villum Fonden via the NATEC Centre of Excellence. This work was additionally funded by project SIQUTE (Contract No. EXL02) of the European Metrology Research Programme (EMRP). The EMRP is jointly funded by the EMRP participating countries within EURAMET and the European Union. S.H. gratefully acknowledges support by the Royal Society and the Wolfson Foundation.
APPENDIX A: EXPERIMENTAL METHODS 1. Coherence measurements
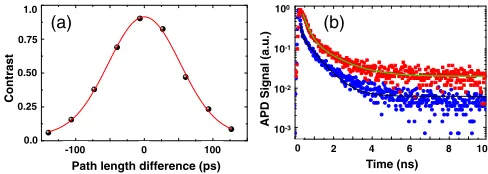
In addition to the Hong-Ou-Mandel (HOM) interference measurements, the coherence of the emitted photons was measured using a free-beam unbalanced Michelson interfer-ometer. One mirror is mounted on a 300-mm-long linear stage, which defines the path-length difference between both optical arms, and, by using an additional implemented piezo crystal at one mirror, the interference fringe contrast from the emitted photons is measured as a function of the path-length difference. The measurements (black data points) are shown in Fig.5(a)for a QD in spectral resonance with the cavity mode. Fitting these data points to a Gaussian function of the form
A+B∗exp[−(π/2)(τ/T2)2], we extract a coherence time of
T2=(93±3) ps. This value in slightly lower than the coher-ence time extracted from the HOM dip in Fig.3, for which
Time (ns)
0 2 4 6 8 10
APD Signal (a.u.)
10 10
10
10
0 100
-100
Contrast
Path length difference (ps) 1.0
0.75
0.50
0.25
0.0
(a) (b)
FIG. 5. (Color online) (a) Coherence length measurement using a free-beam unbalanced Michelson interferometer. Fitting the data points with a Gaussian distribution (red solid curve), we extract a coherence time of T2=(93±3) ps. (b) Time-resolved μ-PL measurements. The blue dotted data points correspond to spectral resonance between the QD and fundamental cavity mode (=0 meV), while the red square points were taken for a detuning of
=0.61 meV. The solid curves correspond to fits to a biexponential function, from which we extractT1=(67±8) ps on-resonance and
[image:4.608.313.557.549.636.2]T2=111 ps. We attribute this slight discrepancy to a long-term spectral jitter which affects the QD emission energy on time scales which are longer than the pulse separation. In the HOM measurement, only subsequently emitted photons separated by 12.2 ns (the laser pulse separation) contribute to the measured indistinguishability, and hence the inferred coherence time of
T2=111 ps. The HOM measurements therefore include an effective time filter. In contrast, the measurements made using the Michelson interferometer are time integrated and, as such, long-term drifts and spectral diffusion result in a deterioration of the extractedT2value [7,9,39].
2. Lifetime measurements
In order to measure the lifetime of the QD emission, we couple the spectrally filtered photons into a single-mode fiber attached to an avalanche photodiode (APD) with resolution
∼40 ps. Figure5(b)shows two representative time-resolved measurements of the QD emission under quasiresonant ex-citation. The blue round data points correspond to spectral resonance between the QD and fundamental cavity mode (=0 meV), while the red square data points correspond to a detuning of=0.61 meV. The measurements (time window 100 ns) each contain six complete decay curves similar to those shown in Fig.5(b), which we fit to a biexponential decay function. The shorter time constant represents the lifetime of the bright exciton, while the longer time originates from a dark exciton effect. For the decay curves in Fig.5(b), we find
T1=(67±8) ps on-resonance and T1=(306±13) ps for
=0.61 meV.
APPENDIX B: TWO-PHOTON INTERFERENCE THEORY Here we provide the necessary background for the theoret-ical analysis of the data presented in the main text.
1. Hanbury Brown and Twiss measurements
We first consider the Hanbury Brown and Twiss (HBT) experimental setup used to measure the two-photon emission probability of our source. Emission from the source is incident upon a 50:50 beam splitter, and two detectors are placed equidistantly on the two output arms. We label t1 the time of the detection event at detector 1, andt2 that of detector 2. The probability of detecting a photon at detector 1 att1, and at detector 2 at t2, is proportional to the second-order field correlation function,
G(2)(t1,t2)= b†1(t1)b2†(t2)b2(t2)b1(t1), (B1)
whereb†1(t) is the creation operator for the mode propagating to detector 1 in the Heisenberg picture, and similarly for
b†2(t). We relate these modes to those on the input arms, described by creation operators a1†anda2†, using the unitary mode transformation [26],
b1†(t)
b2†(t)
= √1
2
1 1
−1 1
a1†(t−τD)
a†2(t)
, (B2)
whereτD is the delay introduced between arrival times at the beam splitter. For the HBT measurement, there is no input in
arm 1, and we simply haveG(2)(t1,t2)→G(2)HBT(t1,t2), with
G(2)HBT(t1,t2)=14a†(t1)a†(t2)a(t2)a(t1), (B3)
where the subscripts on the operators have been dropped since they are all equal.
To measure the two-photon emission probabilityg(2)(0), we integrate Eq. (B3) over allt1 andt2, and divide this area by an adjacent peak. The adjacent peaks correspond to Eq. (B3), but where t1 and t2 differ sufficiently that mode operators at these times are completely uncorrelated. This gives the uncorrelated coincidence probability in the HBT measurement
G(2)HBT,UC(t1,t2)=(1/4)G(2)(t
1,t2), with
G(2)(t
1,t2)= a†(t1)a(t1)a†(t2)a(t2). (B4) The normalized autocorrelation function is then defined as
g(2)(0)=
∞
−∞dt1
∞
−∞dt2G(2)HBT(t1,t2)
∞
−∞dt1
∞
−∞dt2G(2)HBT,UN(t1,t2)
=
∞
−∞dt1
∞
−∞dt2a†(t1)a†(t2)a(t2)a(t1)
∞
−∞dt1
∞
−∞dt2a†(t1)a(t1)a†(t2)a(t2)
, (B5)
which is equal to zero fora†(t1)a†(t2)a(t2)a(t1) =0.
2. Hong-Ou-Mandel experiment
We now consider the Hong-Ou-Mandel (HOM) experi-mental setup used to measure the indistinguishable nature of the emitted photons. Two emission events are incident on a 50:50 beam splitter, with a delay τD introduced into input arm one. The unnormalized probability of a coincidence event is again given by Eq. (B1), and the beam splitter is described by Eq. (B2). Upon combining these equations, we find 16 terms. These can be simplified by assuming that modes 1 and 2 are identical but statistically independent, which allows us to write A1A2 = A1A2, where A1 is any product of mode operators pertaining to mode 1, and similarly for A2. We then find eight terms linear in a1 and a2. For an electromagnetic field state of the form
nan|nn|, with|na Fock state, expectation values linear in the ladder operators are zero, and we neglect these terms. This leaves second- and fourth-order terms. The second-order terms involve expectation values of the forma†(t1)a†(t2), which also give zero for electromagnetic fields, as discussed above. The remaining terms give
G(2)HOM(t1,t2,τD)= G(2)HBT(t1−τD,t2−τD)+G(2)HBT(t1,t2)
+1 4{G
(2)(t
1−τD,t2)+G(2)(t1,t2−τD)
−2Re[G(1)(t1−τD,t2−τD)G(1)(t2,t1)]}, (B6)
where G(1)(t1,t2)= a†(t1)a(t2) is the unnormalized first-order correlation function.
To normalize this quantity, we again consider the scenario in which t1 and t2 are sufficiently separated that mode operators evaluated at these two times are uncorrelated. In doing so, we find the uncorrelated coincidence probability for the HOM setup, G(2)HOM,UC(t1,t2)=14[G(2)(t1,t2)+G(2)(t1−
integrate over all t1 and t2, the appearances of τD can be neglected, i.e., we have
∞
−∞dt1
∞
−∞dt2G
(2)
HOM,UC(t1,t2)=
∞
−∞dt1
∞
−∞dt2G
(2)(t 1,t2)
(B7)
by a simple change of variables. An identical argument can be made for the τD appearing in G(2)HBT(t1−τD,t2−τD) in Eq. (B6). In the HOM setup, we therefore measure the normalized quantity,
g(2)HOM(τD)=
∞
−∞dt1
∞
−∞dt2G(2)HOM(t1,t2,τD)
∞
−∞dt1
∞
−∞dt2G(2)HOM,UN(t1,t2)
= 1
2g (2) HBT(0)+
1
2[1−C(τD)], (B8) where we have defined the strictly two-photon coalescence probability,
C(τD)=
∞
−∞dt1
∞
−∞dt2Re[G(1)(t1−τD,t2−τD)G(1)(t2,t1)]
∞
−∞dt1
∞
−∞dt2G(2)(t1,t2)
,
(B9)
which forτD =0 becomes the visibilityν=C(0).
3. Quantum dot–cavity system
We now develop a master equation which will allow us to derive an analytic expression forgHOM(2) (τD) in the presence of time jitter and pure dephasing. We follow Ref. [28] and model the quantum dot (QD) as a three-level system, with crystal ground state|g, single-exciton state|e, and pump level|p, having energiesωg,ωe, andωp, respectively. The cavity mode is described by creation and annihilation operatorsc†
andc, and has frequencyωc. The system is depicted in Fig.6. In a rotating frame, the QD-cavity system is described by the Jaynes-Cummings Hamiltonian,
HJC=|ee| +g(|eg|c+ |ge|c†), (B10)
|g |e
|
p
|0 |1 Δ
α
κ
g
γ
Adiabatic αcavity elimination
γ
|G |E
|P
Γ
BΓ
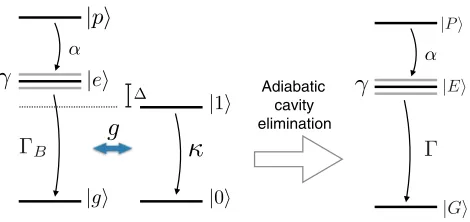
FIG. 6. (Color online) Schematic diagram of the system under consideration; a quantum dot with pump level |p, excited state
|e, and ground state |g couples to a cavity mode with strength
gand detuning. We consider only the zero-photon and one-photon manifolds of the cavity mode, which decays with rateκ. The|p → |etransition has rateα, while the spontaneous-emission process of
|e → |ghas background rate B. The excited state undergoes pure
dephasing with rate γ. Adiabatic cavity elimination results in an effective three-level system with a modified spontaneous-emission rate .
where=(ωe−ωg)−ωcis the detuning of the QD transi-tion from the cavity mode, andg is the QD-cavity coupling strength. Relaxation processes are added using the Lindblad formalism [40], and the master equation describing the QD-cavity degrees of freedomρbecomes
dρ dt = −
i
[HJC,ρ]+[Lκ(c)+L B(|ge|)
+L2γ(|ee|)+Lα(|ep|)]ρ, (B11)
where the Lindblad operators satisfy Lγ(A)ρ=γ(AρA†− 1
2{A†A,ρ}), withαandκthe decay rates of the pump level and cavity, respectively. The background spontaneous-emission rate of the QD is B, and the rateγ describes pure dephasing of the QD excited-state level.
In the limit of weak QD-cavity coupling and/or strong cavity decay, the cavity can be adiabatically eliminated from equations of motion describing our system. Formally, we requireγtot, ,gwithγtot=γ+12(κ+ ), and provided we consider the initial stateρ(0)= |pp| |00|, with|0the vacuum state of the cavity mode, the dynamics can be well approximated by the master equation [28]
dρ dt = −
i
[|EE|,ρ]+[L (|GE|)
+L2γ(|EE|)+Lα(|EP|)]ρ, (B12)
which is Eq. (1) in the main text.
4. Photon indistinguishability for the QD-cavity system We now use Eq. (B12) to calculate the TPI probability, given by Eq. (B8). To proceed, we note that in the far field, we can make the replacementa(t)→σ(t) withσ = |GE|[26] in Eq. (B8). Then, to calculate the second-order cor-relation function G(2)HBT(t1,t2)= 14a†(t1)a†(t2)a(t1)a(t2) → 1
4σ†(t1)σ†(t2)σ(t1)σ(t2), we make use of the quantum re-gression theorem to write [41]
∂ ∂τG
(2)
HBT(t,t+τ)= − G (2)
HBT(t,t+τ). (B13)
Forτ =0, we findG(2)HBT(t,t)=0 sinceσ2=(σ†)2=0, and, as such, G(2)HBT(t,t+τ)=0 and we can set g(2)(0)=0 in Eq. (B8). This reflects that for the theory presented here, we have strictly one (or less) excitations in the system at any time. We now calculate the two-photon coalescence probability expressed in Eq. (B9). To begin, we consider the uncorre-lated probabilityG(2)(t
1,t2)→ σ†(t1)σ(t1)σ†(t2)σ(t2). The quantity σ†(t)σ(t) =Tr[ρ(t)σ†σ] is just the excited-state population at timet, and from Eq. (B12), we have
σ†(t)σ(t) =(t) α
−α(e
−αt−e− t
), (B14)
where the Heavisideθfunction [(t)=0 fort <0 and(t)= 1 fort >0] has been introduced to ensure no excitations are present before emission events. From the quantum regression theorem, the first-order correlation function G(1)(t,t+τ) obeys the equation of motion,
∂ ∂τG
(1)(t,t+τ)= −
γ+1
2 +i
[image:6.608.54.289.521.632.2]
with initial conditionG(1)(t,t)= σ†(t)σ(t), which gives
G(1)(t,t+τ)= σ†(t)σ(t)e−(γ+12 +i)|τ|. (B16)
Finally, performing the integrals in Eq. (B8), we arrive at Eq. (3) in the main text.
5. Exciton-phonon coupling
To explore the influence of phonons seen in our data, a weak exciton-phonon coupling time-convolutionless master-equation technique is used [28]. To second order in the exciton-phonon coupling strength, and within the Born-Markov approximation, the master equation for the complete QD-cavity system (i.e., before adiabatic elimination) becomes
dρ dt = −
i
[HJC,ρ]+[Lκ(c)+L (|ge|)
+L2γ(|ee|)+Lα(|ep|)]ρ+Kph(ρ), (B17) where the phonon-induced dissipator is given by
Kph(ρ)= −
∞
0
dsTrph[HI,[ ˜HI(−s),ρ(t)ρph]], (B18)
where Trph denotes a trace over the phonon modes. The interaction Hamiltonian is written
HI = |ee| k
gk(b†k+bk), (B19)
where bk† is a creation operator for a phonon mode with wave vector k, andgk describes its coupling strength to the QD exciton. The interaction-picture interaction Hamiltonian is defined by ˜H(−s)=e−iH0sH
IeiH0s, whereH0 =HJC+Hph,
with phonon Hamiltonian Hph =
kωkb†kbk and ωk the frequency of modek. Finally, we assume a thermal state for the phonon density operator:ρph=e−βHph/Trph(e−βHph), with
β=/kBT andT the sample temperature.
The strength of the QD-phonon coupling is characterized by the spectral density, defined asJ(ω)=kg2kδ(ω−ωk), and which for excitons in QDs has been shown to be adequately described by the function
J(ω)=η ω3exp[−(ω/ωc)2], (B20) where η captures the overall strength of the interaction determined by material parameters, and ωc is the photon cutoff frequency [42]. The behavior of the phonon dissipa-tor in Eq. (B18) in different parameter regimes has been discussed in detail elsewhere [28–30]. The parameters used to obtain improved fits to the data in the main text (the solid orange curves in Fig. 4) are η=0.032 meV−2 and
ωc=1.3 meV, while the constant pure-dephasing rate was reduced to γ =1 μeV. These parameters correspond to phonons contributing approximately 40% of the dephasing on-resonance. We note that the other parameters in the model were adjusted to 1/ B =730 ps and g=34μeV in order that theT1 times as a function of detuning were well reproduced.
The density operatorρentering Eq. (B17) contains both QD and cavity degrees of freedom. When relating the field operator
a(t) to the QD-cavity system, we have a choice to consider QD emission or cavity emission, making, respectively, the replace-mentsa →cora→ |ge|in the field correlation functions. Our data were better described by cavity emission, which we attribute to the high Purcell factor of our QD-cavity system.
[1] J.-W. Pan, Z.-B. Chen, C.-Y. Lu, H. Weinfurter, A. Zeilinger, and M. ˙Zukowski,Rev. Mod. Phys.84,777(2012).
[2] P. Kok, W. J. Munro, K. Nemoto, T. C. Ralph, J. P. Dowling, and G. J. Milburn,Rev. Mod. Phys.79,135(2007).
[3] J. L. O’Brien,Science318,1567(2007).
[4] J. Nilsson, R. M. Stevenson, K. H. A. Chan, J. Skiba-Szymanska, M. Lucamarini, M. B. Ward, A. J. Bennett, C. L. Salter, I. Farrer, D. A. Ritchieet al.,Nat. Photon.7,311(2013).
[5] W. B. Gao, P. Fallahi, E. Togan, A. Delteil, Y. S. Chin, J. Miguel-Sanchez, and A. Imamoˇglu,Nat. Commun.4,2744(2013). [6] P. Michler, A. Kiraz, C. Becher, W. V. Schoenfeld, P. M. Petroff,
L. Zhang, E. Hu, and A. Imamoglu,Science290,2282(2000). [7] C. Santori, D. Fattal, J. Vuckovic, G. S. Solomon, and
Y. Yamamoto,Nature (London)419,594(2002).
[8] E. B. Flagg, A. Muller, S. V. Polyakov, A. Ling, A. Migdall, and G. S. Solomon,Phys. Rev. Lett.104,137401(2010).
[9] P. Gold, A. Thoma, S. Maier, S. Reitzenstein, C. Schneider, S. H¨ofling, and M. Kamp,Phys. Rev. B89,035313(2014). [10] M. M¨uller, S. Bounouar, K. D. J¨ons, M. Gl¨assl, and P. Michler,
Nat. Photon.8,224(2014).
[11] Z. Yuan, B. E. Kardynal, R. M. Stevenson, A. J. Shields, C. J. Lobo, K. Cooper, N. S. Beattie, D. A. Ritchie, and M. Pepper, Science295,102(2002).
[12] T. Heindel, C. Schneider, M. Lermer, S. H. Kwon, T. Braun, S. Reitzenstein, S. H¨ofling, M. Kamp, and A. Forchel,Appl. Phys. Lett.96,011107(2010).
[13] D. J. P. Ellis, A. J. Bennett, S. J. Dewhurst, C. A. Nicoll, D. A. Ritchie, and A. J. Shields, New J. Phys. 10, 043035 (2008).
[14] P. Yao, V. S. C. M. Rao, and S. Hughes,Laser Photon. Rev.4, 499(2010).
[15] T. B. Hoang, J. Beetz, M. Lermer, L. Midolo, M. Kamp, S. H¨ofling, and A. Fiore,Opt. Express20,21758(2012). [16] S. Reitzenstein and A. Forchel,J. Phys. D: Appl. Phys. 43,
033001(2010).
[17] O. Gazzano, S. Michaelis de Vasconcellos, C. Arnold, A. Nowak, E. Galopin, I. Sagnes, L. Lanco, A. Lematre, and P. Senellart,Nat. Commun.4,1425(2013).
[18] J. M. G´erard, B. Sermage, B. Gayral, B. Legrand, E. Costard, and V. Thierry-Mieg,Phys. Rev. Lett.81,1110(1998). [19] J. Claudon, J. Bleuse, N. S. Malik, M. Bazin, P. Jaffrennou,
N. Gregersen, C. Sauvan, P. Lalanne, and J.-M. Gerard, Nat. Photon.4,174(2010).
[20] M. E. Reimer, G. Bulgarini, N. Akopian, M. Hocevar, M. B. Bavinck, M. A. Verheijen, E. P. Bakkers, L. P. Kouwenhoven, and V. Zwiller,Nat. Commun.3,737(2012).
[21] M. Arcari, I. S¨ollner, A. Javadi, S. Lindskov Hansen, S. Mahmoodian, J. Liu, H. Thyrrestrup, E. H. Lee, J. D. Song, S. Stobbeet al.,Phys. Rev. Lett.113,093603(2014).
[23] A. Naesby, T. Suhr, P. T. Kristensen, and J. Mørk,Phys. Rev. A 78,045802(2008).
[24] A. Auffeves, J.-M. G´erard, and J.-P. Poizat,Phys. Rev. A79, 053838(2009).
[25] S. Varoutsis, S. Laurent, P. Kramper, A. Lemaˆıtre, I. Sagnes, I. Robert-Philip, and I. Abram,Phys. Rev. B72,041303(2005). [26] A. Kiraz, M. Atat¨ure, and A. Imamoglu,Phys. Rev. A69,032305
(2004).
[27] F. Troiani, J. I. Perea, and C. Tejedor,Phys. Rev. B73,035316 (2006).
[28] P. Kaer, N. Gregersen, and J. Mork,New J. Phys.15,035027 (2013).
[29] P. Kaer, P. Lodahl, A.-P. Jauho, and J. Mork,Phys. Rev. B87, 081308(R)(2013).
[30] P. Kaer and J. Mørk,Phys. Rev. B90,035312(2014). [31] D. P. S. McCutcheon and A. Nazir,Phys. Rev. Lett.110,217401
(2013).
[32] Y.-J. Wei, Y. He, Y.-M. He, C.-Y. Lu, J.-W. Pan, C. Schneider, M. Kamp, S. H¨ofling, D. P. S. McCutcheon, and A. Nazir, Phys. Rev. Lett.113,097401(2014).
[33] S. Weiler, A. Ulhaq, S. M. Ulrich, S. Reitzenstein, A. L¨offler, A. Forchel, and P. Michler,Phys. Status Solidi (B)248, 867 (2011).
[34] M. Lermer, N. Gregersen, F. Dunzer, S. Reitzenstein, S. H¨ofling, J. Mørk, L. Worschech, M. Kamp, and A. Forchel,Phys. Rev. Lett.108,057402(2012).
[35] M. Munsch, A. Mosset, A. Auff`eves, S. Seidelin, J. P. Poizat, J.-M. G´erard, A. Lemaˆıtre, I. Sagnes, and P. Senellart, Phys. Rev. B80,115312(2009).
[36] K. Hennessy, A. Badolato, M. Winger, D. Gerace, M. Atature, S. Gulde, S. Falt, E. L. Hu, and A. Imamoglu,Nature (London) 445,896(2007).
[37] T. Grange, R. Ferreira, and G. Bastard, Phys. Rev. B 76, 241304(R)(2007).
[38] We have also adjustedgand γB so that theT1 data are well reproduced off-resonance.
[39] A. V. Kuhlmann, J. Houel, A. Ludwig, L. Greuter, D. Reuter, A. D. Wieck, M. Poggio, and R. J. Warburton,Nat. Phys.9,570 (2013).
[40] H.-P. Breuer and F. Petruccione,The Theory of Open Quantum Systems(Oxford University Press, Oxford, 2002).
[41] H. J. Carmichael, Statistical Methods in Quantum Optics (Springer, New York, 1998).