ISSN Online: 2169-2688 ISSN Print: 2169-267X
DOI: 10.4236/ars.2019.84006 Dec. 19, 2019 89 Advances in Remote Sensing
Estimation of Poverty Based on Remote Sensing
Image and Convolutional Neural Network
Peng Wu, Yumin Tan
School of Transportation Science and Engineering, Beihang University, Beijing, China
Abstract
Poverty has always been one of the topics concerned by governments and re-searchers all over the world, especially in developing countries. Remote sens-ing image is widely used in poverty estimation because of its large area obser-vation, timeliness and periodicity. In this study, we explore the applicability of convolution neural network (CNN) combined with remote sensing image in regional poverty estimation. In the 2016 economic indicators estimation of Guizhou Province, China, the Pearson coefficient of per capita GDP (PCGDP) reached 0.76, which means that the image features extracted by CNN can ex-plain the change of PCGDP of county level economic indicators up to 76%. Compared with other methods, our method still has high precision. Based on these results, we found that convolutional neural network combined with re-mote sensing image can be used in regional poverty estimation.
Keywords
Poverty, Convolution Neural Network, Remote Sensing Image, Economic Indicators, Guizhou, PCGDP
1. Introduction
Poverty as a problem has been perplexing governments all over the world, espe-cially developing countries. It is very important for policy makers and research-ers to analyze the conditions and causes of poverty, which is helpful to reduce poverty. The traditional way of poverty measurement mainly depends on the ground survey data [1]. However, it takes a long time and is expensive to ob-tained data [2]. Some countries have not even collected such data [3].
Because remote sensing data can provide large-scale, multi-temporal and spa-tial resolution surface information, it is widely used in regional poverty estima-tion. As a new kind of remote sensing data, nighttime light remote sensing data
How to cite this paper: Wu, P. and Tan, Y.M. (2019) Estimation of Poverty Based on Remote Sensing Image and Convolu-tional Neural Network. Advances in Re-mote Sensing, 8, 89-98.
https://doi.org/10.4236/ars.2019.84006
Received: October 24, 2019 Accepted: December 16, 2019 Published: December 19, 2019
Copyright © 2019 by author(s) and Scientific Research Publishing Inc. This work is licensed under the Creative Commons Attribution International License (CC BY 4.0).
DOI: 10.4236/ars.2019.84006 90 Advances in Remote Sensing
records the artificial light in human settlements and is widely used in poverty es-timation [4] [5]. Various socio-economic parameters have been estimated by using nighttime light remote sensing data, such as: carbon dioxide (CO2)
emis-sions [6] [7], gross domestic product (GDP) [8] [9], population [10] [11], etc. There are two kinds of widely used nighttime light data, which are the nighttime light composite data obtained by the Defense Meteorological Satellite Pro-gram’s Operational Line scan System (DMSP-OLS) [12] [13] and the new gen-eration nighttime light composite data from the Visible Infrared Imaging Ra-diometer Suite (VIIRS) Day-Night Band (DNB) carried by the Suomi National Polar-orbiting Partnership (NPP) Satellite [14]. DMSP-OLS data have some shortcomings, such as strong light saturation, coarse spatial resolution and so on [15]. NPP-VIRS data is calibrated to DMSP-OLS Data with better quality. In terms of spatial resolution, 15 arc seconds, 500 meters DMSP-OLS data are bet-ter than 30 arc seconds, and 1000 mebet-ters NPP-VIRS data can provide more ar-tificial lighting information at night in human settlements [16] [17]. In the use of DMSP-OLS data, Noor et al.[18] used the data to calculate the Pearson coeffi-cient of household asset index; the best result was 0.64, which confirmed the correlation between DMSP-OLS data and socio-economic indicators. Li et al.
[19] explored the potential of NPP-VIRS night light images for regional eco-nomicmodeling in China. Yu et al. [20] used NPP-VIRS data to estimate pover-ty at the counpover-ty level in China.
In a recent paper [21], the features extracted from remote sensing images trained by convolution neural networks (CNNs) are used to estimate poverty, which explains up to 75% of the changes in local economic and living indicators. All the satellite image data used in this study are open and free, which promotes an important step in using such satellite image data to estimate economic indi-cators without expensive and time-consuming ground statistical surveys. There is no assessment of transfer learning methods to predict changes in economic well-being over time in specific regions. Perez et al.[22] used the Wasserstein generative adversarial networks (WGAN) to construct the semi supervised clas-sification multitask learning to estimate the household asset wealth index (AWI) in Africa. They constructed an end-to-end multitask learning model for a series of classification tasks, including luminous intensity, population density, distance to the nearest road, land cover type and AWI. However, the WAGN model is difficult to train. In the development of convolution neural network, He et al.
proposed the deep residual network (ResNet) [23] in 2014, and solved the prob-lem of gradient disappearance caused by increasing depth in the neural network.
Lin et al. proposed the feature pyramid network (FPN) [24] in 2017, obtained
DOI: 10.4236/ars.2019.84006 91 Advances in Remote Sensing
kinds of remote sensing data, which are nighttime light data that can reflect the artificial light in human settlements, Normalized Vegetation Index (NDVI) [25] [26] data reflecting regional vegetation conditions, Modified Normalized Dif-ference Water Index (MNDWI) [27] effectively distinguishes Water and urban areas, and Normalized Difference Built Index (NDBI) [28] data reflecting urban and non-urban regional conditions. Different from the previous research [21], [22], we choose ResNet-50 and FPN to build a new convolution neural network model to classify and learn different remote sensing data, so that the convolution neural network model can learn more characteristics that can reflect the changes of regional economy. When the model is trained, the features are extracted for the estimation of economic indicators. The details of the experiment are de-scribed in subsequent sections.
2. Materials
2.1. Investigation Area
Guizhou (Figure 1) is a provincial administrative region of the People’s Repub-lic of China. Its capital is Guiyang. It is located in the southwest of China and consists of 88 cities, districts and special zones. The land resources in the study area are mainly mountains and hills, rich in mineral resources, less plains and less cultivated land per capita. Due to historical, geographical, cultural and po-litical factors, the economic level of Guizhou Province has always been at the lowest level in the country. In 2012, the office of the leading group for poverty alleviation and development of the State Council issued a list of 665 key counties for poverty alleviation and development work in China, aiming to lift these counties out of poverty. In 2016, Guizhou Province was composed of nine cities and prefectures: Guiyang, Liupanshui, Zunyi, Anshun, Bijie, Tongren, Qianxi-nan, Qiandongnan and Qiannan. Among them, there are 66 poor counties, the number of which is far more than that of other regions, with a GDP of 1177.673 billion yuan, ranking 24th in 31 provinces, regions and cities in China [29].
2.2. Dataset
In this study, the experimental data include 2016 landsat 8 image, NPP-VIRS nighttime light image and Guizhou annual statistical yearbook data. The landsat 8 image of 88 cities, districts and special zones in Guizhou is generated by Google Earth Engine’s Landsat Simple Composite tool. We divide the image of 88 regions into 256 × 256 pixels size image tiles. Because the vector boundary of each region is irregular, the whole black image will be removed. Spectral index images were obtained from landsat 8 images collected on the Google Earth En-gine, which were similarly divided into image tiles for trained.
DOI: 10.4236/ars.2019.84006 92 Advances in Remote Sensing
Figure 1. Case study area: Guizhou is composed of 88 cities, districts and special zones. The economic development level of each region is quite different, among which the regional economic development level near the provincial capital city is better than other regions far away from the provincial capital.
and some non-light values are removed. Similarly, the nighttime light images of each city, district and special zone are trained in small tiles, just as we did with landsat 8 satellite images. The 2016 statistical yearbook was downloaded from Guizhou bureau of statistics, in which we collected some economic indicators: Per capita gross domestic product (PCGDP), total retail sales of consumer goods (TRSCG) and general public financial budget revenue (GPFBR). Table 1 shows the data used in the experiment.
3. Methods
DOI: 10.4236/ars.2019.84006 93 Advances in Remote Sensing
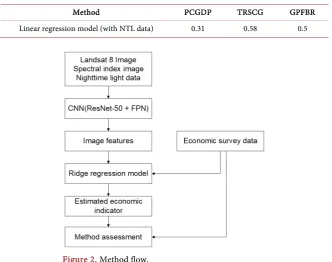
Pearson coefficient (R2) of the actual economic indicator and the estimated eco-nomic indicator is used to evaluate the performance of our method. The overall method flow is shown in Figure 2.
4. Experimental and Results
In Section 3, ResNet-50 and FPN are used for classification tasks. The classifiers after P2 feature layer are used for classification of nighttime light intensity. Si-milarly, the classifiers after P3 to P5 feature layer are used for classification of NDVI, MNDWI and NDBI respectively. The classification categories of four kinds of data are confirmed by Gaussian mixture model. The four data classifi-cation categories are shown in Table 2. The input of convolutional neural net-work is Landsat 8 image and the output is the category of nighttime light inten-sity (NLI), NDVI, MNDWI and NDBI. Table 3 shows the training accuracy and test accuracy of the four classification tasks. After the training of the model, the output of the global average pooling layer in the convolutional neural network is extracted as the feature, and the 256-dimensional featurevectors of the four clas-sification tasks are combined into a 1024-dimensional featurevectorsas the im-age features extracted from the remote sensing imim-age by CNN. Finally, we use the economic indicator data from the statistical yearbook and the corresponding image features extracted from the remote sensing image by CNN to train the ridge regression model to estimate the economic indicator.
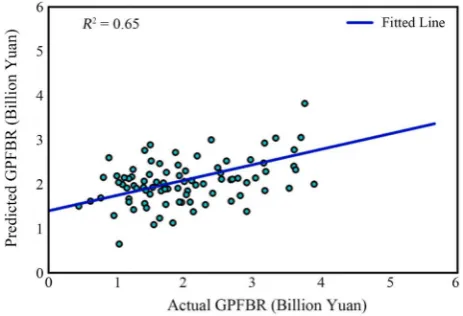
In ridge regression model, we use principal component analysis (PCA) to re-duce the dimension of features to avoid over fitting, in which 1024-dimensional feature vectors are reduced to 100-dimensional feature vectors. The 10-fold cross-validation method was used to estimate the 2016 economic indicators of Guizhou province, and the process was repeated 20 times. Finally, we took the average value of all R2 of 20 times as our final result. In this study, we estimate the three economic indicators of PCGDP, TRSCG and GPFBR. The Pearson coefficients of the three economic indicators are 0.76, 0.72 and 0.65 respectively, as shown in Figure 3, Figure 4 and Figure 5. Compared with the previous expe-rimental results [21] [30], although the estimated economic indicators are dif-ferent, the Pearson coefficient (R2) of economic indicators is also in this range, indicating that our method can be applied to the economic indicators estimation of Guizhou Province, and the estimated economic indicators result is reasonable. In order to test whether our method is better than other methods in the esti-mation of economic indicators, we also calculate the results of estimating eco-nomic indicators directly using the nighttime light (NTL) data. The sum of night light of cities, districts and special zones in Guizhou Province is used to estimate three economic indicators by linear regression model, among which the R2 (Table 4) of PCGDP, TRSCG and GPFBR are 0.31, 0.58 and 0.5 respectively.
5. Conclusions
DOI: 10.4236/ars.2019.84006 94 Advances in Remote Sensing
[image:6.595.210.541.151.229.2]economic indicators, provides a potentially quick and inexpensive method. These features extracted by deep learning can explain up to 76% of the variation in local economic outcomes.
Table 1. Dataset characteristics used in this study.
Dataset Spatial resolution Temporal resolution Time Line
Landsat 8 image 30 m 1 year 2016
Spectral index image 30 m 1 year 2016
Nighttime light data 500 m 1 year 2016
[image:6.595.209.540.260.318.2]Economic survey data City, district and special zone 1 year 2016
Table 2. Classification category interval of four kinds of data.
Class NLI NDVI MNDWI NDBI
[image:6.595.211.540.347.419.2]1 0 - 0.005 −5.62 - 0.25 −0.38 - −0.22 −0.39 - −0.23 2 0.005 - 0.17 0.25 - 0.51 −0.22 - −0.10 −0.23 - −0.10 3 0.17 - 33.45 0.51 - 0.77 −0.10 - 0.06 −0.10 - 0.03
Table 3. Classification category interval of four kinds of data.
Data Training accuracy Testing accuracy
NI 99.84% 90.62%
NDVI 100% 100%
MNDWI 100% 93.75%
NDBI 100% 100%
Table 4. The Pearson coefficient results of the economic indicators estimated by the linear regression model and the actual economic indicators.
Method PCGDP TRSCG GPFBR
[image:6.595.209.542.457.719.2]Linear regression model (with NTL data) 0.31 0.58 0.5
DOI: 10.4236/ars.2019.84006 95 Advances in Remote Sensing
Figure 3. The Pearson coefficient (R2) of the predicted PCGDP and the actual
[image:7.595.266.482.265.413.2]PCGDP, in which the blue line is the best fitting line.
Figure 4. The Pearson coefficient (R2) of the predicted TRSCG and the actual
TRSCG, in which the blue line is the best fitting line.
Figure 5. The Pearson coefficient (R2) of the predicted GPFBR and the actual
GPFBR, in which the blue line is the best fitting line.
[image:7.595.257.489.461.619.2]DOI: 10.4236/ars.2019.84006 96 Advances in Remote Sensing
Acknowledgements
We would like to thank Neal Jean for publishing the code for the feature training ridge regression used to estimated economic indicators. Our work is imple-mented by Tensorflow and Keras API, and the data is collected by Google Earth Engine.
Funding
This work is financially supported by the Project for Follow-Up Work in Three Gorges (12610100000018J107).
Conflicts of Interest
The authors declare no conflicts of interest regarding the publication of this pa-per.
References
[1] Zhao, X., et al. (2019) Estimation of Poverty Using Random Forest Regression with Multi-Source Data: A Case Study in Bangladesh. Remote Sensing, 11, 375.
https://doi.org/10.3390/rs11040375
[2] Engstrom, R., Newhouse, D., Haldavanekar, V., Copenhaver, A. and Hersh, J. (2017) Evaluating the Relationship between Spatial and Spectral Features Derived from High Spatial Resolution Satellite Data and Urban Poverty in Colombo, Sri Lanka. 2017 Joint Urban Remote Sensing Event, Dubai, 6-8 March 2017, 8-11. https://doi.org/10.1109/JURSE.2017.7924590
[3] Ferreira, F.H.G., et al. (2016) A Global Count of the Extreme Poor in 2012: Data Is-sues, Methodology and Initial Results. The Journal of Economic Inequality, 14, 141-172. https://doi.org/10.1007/s10888-016-9326-6
[4] Sutton, P.C. and Costanza, R. (2002) Global Estimates of Market and Non-Market Values Derived from Nighttime Satellite Imagery, Land Cover, and Ecosystem Ser-vice Valuation. Ecological Economics, 41, 509-527.
https://doi.org/10.1016/S0921-8009(02)00097-6
[5] Doll, C.N.H., Muller, J.P. and Morley, J.G. (2006) Mapping Regional Economic Ac-tivity from Night-Time Light Satellite Imagery. Ecological Economics, 57, 75-92. https://doi.org/10.1016/j.ecolecon.2005.03.007
[6] Cui, X., Lei, Y., Zhang, F., Zhang, X. and Wu, F. (2019) Mapping Spatiotemporal Variations of CO2 (Carbon Dioxide) Emissions Using Nighttime Light Data in
Guangdong Province. Physics and Chemistry of the Earth, 110, 89-98. https://doi.org/10.1016/j.pce.2019.01.007
[7] Ou, J., Liu, X., Li, X., Li, M. and Li, W. (2015) Evaluation of NPP-VIIRS Nighttime Light Data for Mapping Global Fossil Fuel Combustion CO2 Emissions: A
Compar-ison with DMSP-OLS Nighttime Light Data. PLoS ONE, 10, e0138310. https://doi.org/10.1371/journal.pone.0138310
[8] Marx, A. and Ziegler Rogers, M. (2017) Analysis of Panamanian DMSP/OLS Night-lights Corroborates Suspicions of Inaccurate Fiscal Data: A Natural Experiment Examining the Accuracy of GDP Data. Remote Sensing Applications: Society and Environment, 8, 99-104, . https://doi.org/10.1016/j.rsase.2017.08.005
DOI: 10.4236/ars.2019.84006 97 Advances in Remote Sensing Estimate the Gross Domestic Product and the Electric Power Consumption of Chi-na at Multiple Scales: A Comparison with DMSP-OLS Data. Remote Sensing, 6, 1705-1724.https://doi.org/10.3390/rs6021705
[10] Zhao, N., Liu, Y., Cao, G., Samson, E.L. and Zhang, J. (2017) Forecasting China’s GDP at the Pixel Level Using Nighttime Lights Time Series and Population Images.
GIScience & Remote Sensing, 54, 407-425.
https://doi.org/10.1080/15481603.2016.1276705
[11] Sutton, P., Roberts, D., Elvidge, C. and Baugh, K. (2001) Census from Heaven: An Estimate of the Global Human Population Using Night-Time Satellite Imagery. In-ternational Journal of Remote Sensing, 22, 3061-3076.
https://doi.org/10.1080/01431160010007015
[12] Li, C., Li, G., Zhu, Y., Ge, Y., Te Kung, H. and Wu, Y. (2017) A Likelihood-Based Spatial Statistical Transformation Model (LBSSTM) of Regional Economic Devel-opment Using DMSP/OLS Time-Series Nighttime Light Imagery. Spatial Statistics, 21, 421-439.https://doi.org/10.1016/j.spasta.2017.03.004
[13] Wu, J., Wang, Z., Li, W. and Peng, J. (2013) Exploring Factors Affecting the Rela-tionship between Light Consumption and GDP Based on DMSP/OLS Nighttime Satellite Imagery. Remote Sensing of Environment, 134, 111-119.
https://doi.org/10.1016/j.rse.2013.03.001
[14] Elvidge, C.D., Zhizhin, M., Hsu, F.C. and Baugh, K.E. (2013) VIIRS Nightfire: Satel-lite Pyrometry at Night. Remote Sensing, 5, 4423-4449.
https://doi.org/10.3390/rs5094423
[15] Yu, B., et al. (2014) Object-Based Spatial Cluster Analysis of Urban Landscape Pat-tern Using Nighttime Light Satellite Images: A Case Study of China. International Journal of Geographical Information Science, 28, 2328-2355.
https://doi.org/10.1080/13658816.2014.922186
[16] Elvidge, C.D., Zhizhin, M., Hsu, F.-C. and Baugh, K. (2013) What Is So Great about Nighttime VIIRS Data for the Detection and Characterization of Combustion Sources?
Proceedings of the Asia-Pacific Advanced Network, 35, 33-48. https://doi.org/10.7125/apan.35.5
[17] Elvidge, C.D., Baugh, K.E., Zhizhin, M. and Hsu, F.-C. (2013) Why VIIRS Data Are Superior to DMSP for Mapping Nighttime Lights. Proceedings of the Asia-Pacific Advanced Network, 35, 62-69.https://doi.org/10.7125/APAN.35.7
[18] Noor, A.M., Alegana, V.A., Gething, P.W., Tatem, A.J. and Snow, R.W. (2008) Us-ing Remotely Sensed Night-Time Light as a Proxy for Poverty in Africa. Population Health Metrics, 6, 5.https://doi.org/10.1186/1478-7954-6-5
[19] Li, X., Xu, H., Chen, X. and Li, C. (2013) Potential of NPP-VIIRS Nighttime Light Imagery for Modeling the Regional Economy of China. Remote Sensing, 5, 3057-3081. https://doi.org/10.3390/rs5063057
[20] Yu, B., Shi, K., Hu, Y., Huang, C., Chen, Z. and Wu, J. (2015) Poverty Evaluation Using NPP-VIIRS Nighttime Light Composite Data at the County Level in China.
IEEE Journal of Selected Topics in Applied Earth Observations and Remote Sens-ing, 8, 1217-1229. https://doi.org/10.1109/JSTARS.2015.2399416
[21] Jean, N., Burke, M., Xie, M., Davis, W.M., Lobell, D.B. and Ermon, S. (2016) Com-bining Satellite Imagery and Machine Learning to Predict Poverty. Science, 353, 790-794.https://doi.org/10.1126/science.aaf7894
DOI: 10.4236/ars.2019.84006 98 Advances in Remote Sensing [23] He, K., Zhang, X., Ren, S. and Sun, J. (2016) Deep Residual Learning for Image
Recognition. 2016 IEEE Conference on Computer Vision and Pattern Recognition, Las Vegas, NV, 27-30 June 2016, 770-778.https://doi.org/10.1109/CVPR.2016.90 [24] Lin, T.Y., Dollár, P., Girshick, R., He, K., Hariharan, B. and Belongie, S. (2017)
Fea-ture Pyramid Networks for Object Detection. 2017 IEEE Conference on Computer Vision and Pattern Recognition, Honolulu, HI, 21-26 July 2017, 936-944.
https://doi.org/10.1109/CVPR.2017.106
[25] Gallo, K.P., Owen, T.W., Gallo, K.P. and Owen, T.W. (1999) Satellite-Based Ad-justments for the Urban Heat Island Temperature Bias. Journal of Applied Meteor-ology, 38, 806-813.
https://doi.org/10.1175/1520-0450(1999)038<0806:SBAFTU>2.0.CO;2
[26] Yuan, F. and Bauer, M.E. (2007) Comparison of Impervious Surface Area and Normalized Difference Vegetation Index as Indicators of Surface Urban Heat Island Effects in Landsat Imagery. Remote Sensing of Environment, 106, 375-386.
https://doi.org/10.1016/j.rse.2006.09.003
[27] Xu, H. (2006) Modification of Normalised Difference Water Index (NDWI) to En-hance Open Water Features in Remotely Sensed Imagery. International Journal of Remote Sensing, 27, 3025-3033.https://doi.org/10.1080/01431160600589179 [28] Zha, Y., Gao, J. and Ni, S. (2003) Use of Normalized Difference Built-up Index in
Automatically Mapping Urban Areas from TM Imagery. International Journal of Remote Sensing, 24, 583-594.https://doi.org/10.1080/01431160304987
[29] Guizhou Provincial Bureau of Statistics.
http://stjj.guizhou.gov.cn/tjsj_35719/sjcx_35720/gztjnj_40112/tjnj2018/