HEALTH BEHAVIOUR IN SCHOOL-AGED CHILDREN:
WORLD HEALTH ORGANIZATION COLLABORATIVE
CROSS-NATIONAL STUDY (HBSC)
HEALTH BEHAVIOUR IN SCHOOL-AGED CHILDREN:
WORLD HEALTH ORGANIZATION COLLABORATIVE
CROSS-NATIONAL STUDY (HBSC)
Findings from the 2010
HBSC Survey in Scotland
Candace Currie
Kate Levin
Jo Kirby
Dorothy Currie
Winfried van der Sluijs
Jo Inchley
MARCH 2011
TH
E H
EA
LTH B
EH
AV
IO
UR I
N S
CH
OO
L-A
GE
D C
HIL
DR
EN
:
W
HO C
OL
LA
BO
RA
TIV
E C
RO
SS-NA
TIO
NA
L S
TU
DY (
HB
SC)
SC
OT
LA
ND N
AT
IO
NA
L R
EP
OR
T 2
010
Tables and Figures iv
Foreword vii
Executive Summary viii
Acknowledgements xi
Chapter 1: Introduction and Methods 1
Chapter 2: Family life 9
Chapter 3: The school environment 17
Chapter 4: Peer relations 23
Chapter 5: Neighbourhood environment 29
Chapter 6: Eating habits 37
Chapter 7: Physical activity and sedentary behaviour 45
Chapter 8: Weight control behaviour 53
Chapter 9: Body image and Body Mass Index 57
Chapter 10: Tooth brushing 63
Chapter 11: Well-being 67
Chapter 12: Substance use 75
Chapter 13: Sexual health 85
Chapter 14: Bullying and fighting 91
Chapter 15: Injuries 97
Appendix 101
iv
TABLES AND FIGURES
TABLES1.1 Response rates by class 5
13.1 Contraception use 89
FIGURES
CHAPTER 2: FAMILY LIFE
2.1 Family structure 11
2.2 Family structure 1990-2010 11
2.3 SES of mothers and fathers 11
2.4 Family SES 11
2.5 Family affluence 11
2.6 Perceived family wealth by age 13
2.7 Perceived family wealth 1998-2010 13
2.8 Easy to talk to father 13
2.9 Easy to talk to mother 13
2.10 Easy to talk to father 1990-2010 15
2.11 Easy to talk to mother 1990-2010 15
CHAPTER 3: THE SCHOOL ENVIRONMENT
3.1 Like school a lot 19
3.2 Like school a lot 1990-2010 19
3.3 Good academic performance at school 19
3.4 Good academic performance at school 1990-2010 19
3.5 Feel pressured by schoolwork 19
3.6 Feel pressured by schoolwork 1994-2010 21
3.7 Classmates kind and helpful 21
3.8 Classmates kind and helpful 2002-2010 21
CHAPTER 4: PEER RELATIONS
4.1 Three or more close friends of same sex 25
4.2 Spend time with friends after school 4+ days/week 25
4.3 Spend time with friends on 4+ evenings/week 25
4.4 Spend time with friends after school 4+ days/week
2002-2010 25
4.5 Spend time with friends on 4+ evenings/week
1994-2010 25
4.6 Easy to talk to best friend 27
4.7 Electronic media contact with friends every day 27
CHAPTER 5: NEIGHBOURHOOD ENVIRONMENT
5.1 Feeling safe in local area 31
5.2 Local area is a good place to live by age 31
5.3 People say hello and stop to talk in the street 31
5.4 Safe for children to play outside 31
5.5 Able to trust people 31
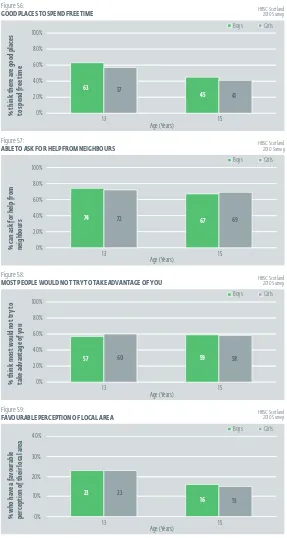
5.6 Good places to spend free time 33
5.7 Able to ask for help from neighbours 33
5.8 Most people would not try to take advantage of you 33
5.9 Favourable perception of local area 33
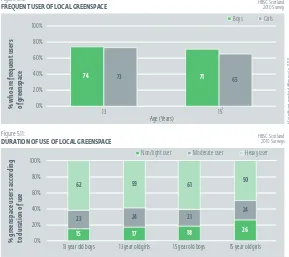
5.10 Frequent user of local greenspace 35
5.11 Duration of use of local greenspace 35
CHAPTER 6: EATING HABITS
6.1 Frequency of family meals by age 39
6.2 Daily family meals 1994-2010 39
6.3 Eat breakfast every morning on school days 39
6.4 Eat breakfast every morning on school days 1990-2010 39
6.5 What pupils do for lunch on school days by age 39
6.6 Daily fruit consumption 41
6.7 Daily fruit consumption 2002-2010 41
6.8 Daily vegetable consumption 41
6.9 Daily vegetable consumption 2002-2010 41
6.10 Daily sweets consumption 41
6.11 Daily sweets consumption 2002-2010 42
6.12 Daily crisps consumption 42
6.13 Daily crisps consumption 2002-2010 43
6.14 Daily chips consumption 43
6.15 Daily chips consumption 2002-2010 43
6.16 Daily consumption of coke/other sugary drinks 43
6.17 Daily consumption of diet soft drinks 43
CHAPTER 7: PHYSICAL ACTIVITY AND SEDENTARY BEHAVIOUR
7.1 Meeting physical activity guidelines 47
7.2 Meeting physical activity guidelines 2002-2010 47
7.3 Frequency of leisure time vigorous exercise
(4 or more times per week) 47
7.4 Duration of leisure time vigorous exercise
(2 or more hours per week) 47
7.5 Frequency of leisure time vigorous exercise 1990-2010 47
7.6 Duration of leisure time vigorous exercise 1990-2010 49
7.7 Mode of travel to school 49
7.8 Mode of travel to school by age 49
TH E H EA LTH B EH AV IO UR I N S CH OO L-A GE D C HIL DR EN : W HO C OL LA BO RA TIV E C RO SS-NA TIO NA L S TU DY ( HB SC) SC OT LA ND N AT IO NA L R EP OR T 2 010 v
7.10 Watching TV for 2 or more hours a day on week days 49
7.11 Watching TV for 2 or more hours a day
on week days 2002-2010 51
7.12 Playing computer games for 2 or more hours a day
on week days 51
7.13 Playing computer games for 2 or more hours a day
at the weekend 51
7.14 Using computers (not games) for 2 or more hours a day
on week days 51
7.15 Using computers (not games) for 2 or more hours a day
at the weekend 51
CHAPTER 8: WEIGHT CONTROL BEHAVIOUR
8.1 Currently trying to lose weight 55
8.2 Currently trying to lose weight 2002-2010 55
CHAPTER 9: BODY IMAGE AND BODY MASS INDEX
9.1 Report body is too fat 59
9.2 Report body is too fat 1990-2010 59
9.3 Report good looks 59
9.4 Report good looks 1990-2010 61
9.5 Weight groups according to BMI: 15-year olds 61
CHAPTER 10: TOOTH BRUSHING
10.1 Brush teeth at least twice a day 65
10.2 Brush teeth at least twice a day 1990-2010 65
CHAPTER 11: WELL-BEING
11.1 Report high life satisfaction 69
11.2 Report high life satisfaction 2002-2010 69
11.3 Feel very happy 69
11.4 Feel very happy 1994-2010 69
11.5 Always feel happy 69
11.6 Always feel confident 71
11.7 Always feel confident 1994-2010 71
11.8 Never feel left out 71
11.9 Never feel left out 1998-2010 71
11.10 Report excellent health 71
11.11 Report excellent health 2002-2010 73
11.12 Health complaints 73
11.13 Multiple health complaints 73
11.14 Multiple health complaints 1994-2010 73
11.15 Medicine use 73
CHAPTER 12: SUBSTANCE USE
12.1 Ever smoked tobacco 77
12.2 Current smoking 77
12.3 Smoke tobacco daily 77
12.4 Ever smoked tobacco: 15-year olds 1990-2010 77
12.5 Current smoking: 15-year olds 1990-2010 77
12.6 Daily smoking: 15-year olds 1990-2010 79
12.7 Drink alcohol weekly 79
12.8 Weekly drinking: 15-year olds 1990-2010 79
12.9 Types of alcohol drunk weekly by 15-year olds 79
12.10 Been drunk 2 or more times 79
12.11 Been drunk 2 or more times: 15-year olds 1990-2010 81
12.12 Ever used cannabis 81
12.13 Used cannabis in past 12 months 81
12.14 Ever used cannabis: 15-year olds 81
12.15 Used cannabis in past 12 months:15-year olds 81
12.16 Cannabis user groups: 15-year olds 83
12.17 Cannabis user groups: 15-year olds 2002-2010 83
CHAPTER 13: SEXUAL HEALTH
13.1 Main source of information about sexual matters 87
13.2 Boys’ main source of information about sexual matters
2002-2010 87
13.3 Girls’ main source of information about sexual matters
2002-2010 87
13.4 Person it is easiest to discuss personal and sexual
matters with 89
13.5 Sexual behaviour: had sexual intercourse 1998-2010 89
CHAPTER 14: BULLYING AND FIGHTING
14.1 Been bullied at least 2-3 times a month in past couple
of months 93
14.2 Been bullied 2-3 times a month in past couple
of months 2002-2010 93
14.3 Bullied others at least 2-3 times a month in past couple
of months 93
14.4 Bullied others at least 2-3 times a month 2002-2010 93
14.5 Involved in a physical fight 3 times or more last year 95
14.6 Involved in a physical fight 3 times or more last year
2002-2010 95
CHAPTER 15: INJURIES
15.1 Injured at least once in past 12 months 99
vii
TH
E H
EA
LTH B
EH
AV
IO
UR I
N S
CH
OO
L-A
GE
D C
HIL
DR
EN
:
W
HO C
OL
LA
BO
RA
TIV
E C
RO
SS-NA
TIO
NA
L S
TU
DY (
HB
SC)
SC
OT
LA
ND N
AT
IO
NA
L R
EP
OR
T 2
010
FOREWORD
Since 1990, children and young people in Scotland aged 11, 13 and 15 years have participated in the Health Behaviour in School-aged Children (HBSC) World Health Organization Collaborative Cross-National Study. This 2010 report is the 6th wave of the survey in Scotland.
HBSC collects data from adolescents in 43 nations in Europe and North America allowing for international comparison and trends over time to be identified. It covers a wide range of topics, from well-being and health behaviours through to contextual factors such as family affluence, peer relations and the school environment. It therefore adds to the scientific knowledge base and informs policy-makers about key trends in health outcomes and inequalities in health for this age group and their determinants.
The Scottish 2010 survey reported here suggests that many things are improving. For example, the proportion of children reporting that they eat sweets daily has declined by a third and the proportion reporting eating chips daily has declined by half since 2002. Cannabis use among adolescents has also declined. Furthermore, the proportion of girls brushing their teeth twice daily has increased to 81% and the proportion of boys to 66%.
Despite these improvements, there remain several worrying findings: only around half of young people always feel safe in their local area; and only a third of young people eat fruit and vegetables daily.
HBSC provides the best tool for investigating why some health-related trends in children and young people are increasing and other trends decreasing by facilitating comparisons internationally. This has recently been recognised by UNICEF who used HBSC to inform their thinking on health inequalities.
NHS Health Scotland is proud to support HBSC and hope that it will continue to generate insights to improve the health of young people in Scotland into the future.
Dr Gerry McCartney
Public Health Consultant and Head of Public Health Observatory Division
viii
This report presents data on adolescent health from the World Health Organization (WHO) collaborative cross-national Health Behaviour in School-aged Children (HBSC) study in Scotland. Prevalence statistics for 2010 and trends across some or all six consecutive surveys in 1990, 1994, 1998, 2002, 2006 and 2010 are included. Over 6700 pupils were sampled in the most recent Scottish survey of 2010. The main findings are summarised below.
FAMILY LIFE
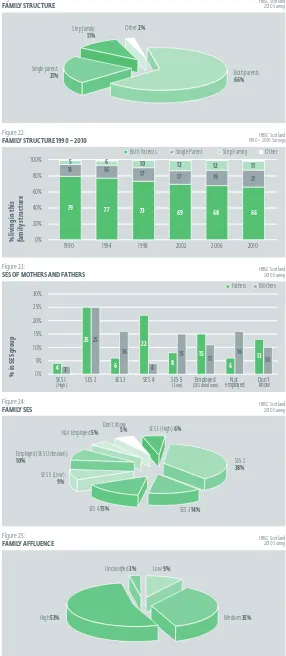
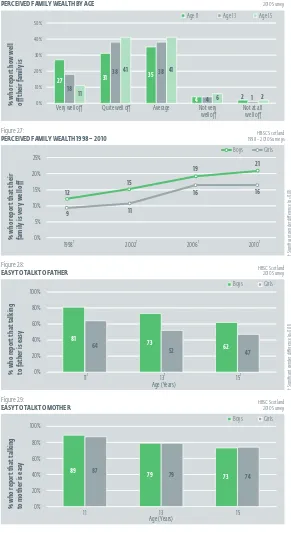
The majority of young people in Scotland (66%) live with both their parents, while 21% live with just one parent (19% with their mother and 2% with their father), 11% live in a step family, and 2% live in a variety of other care arrangements. Most children living with both parents (76%) report that both are in employment, and a further 21% have one parent in employment. Among children from single parent families, 74% report their parent to be in employment. Over half of young people (55%) think their family is quite or very well off, with larger proportions at younger ages. The proportion of young people reporting that their family is very well off has increased between 1998 and 2010. Young people find it easier to talk to their mother (80%) than to their father (63%) and ease of communication with parents (particularly fathers) deteriorates with age. Boys and girls find it equally easy to talk to their mother about things that bother them but boys are more likely than girls to report easy communication with their father.
THE SCHOOL ENVIRONMENT
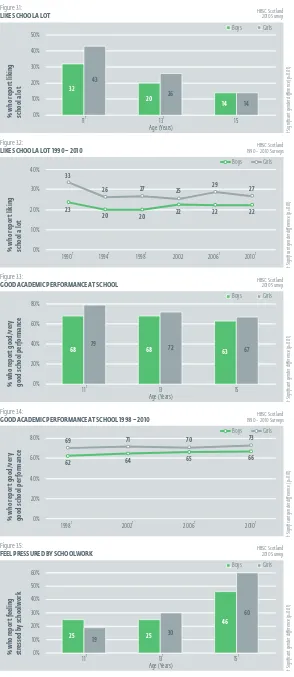
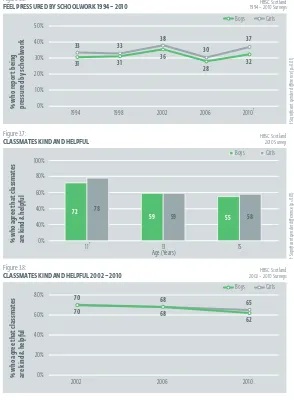
A quarter of young people (25%) like school ‘a lot’ and 64% feel their classmates are kind and helpful, and these proportions are greater among younger adolescents. 69% of pupils rate their school performance highly relative to their classmates and this proportion is greater for younger adolescents. One in five 11-year olds (22%) and over half of 15-year olds (54%) feel pressured by schoolwork. At ages 11 and 13, girls are more likely than boys to report that they like school a lot, but there is no gender difference at age 15. At age 11, girls are more likely than boys to rate their school performance highly relative to their peers and to report that their classmates are kind and helpful, but there are no gender differences at the older ages. At age 11, boys are more likely than girls to report that they are pressured by schoolwork, but at ages 13 and 15 this is more common among girls.
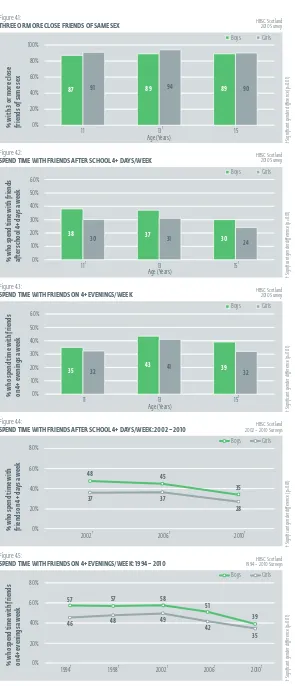
PEER RELATIONS
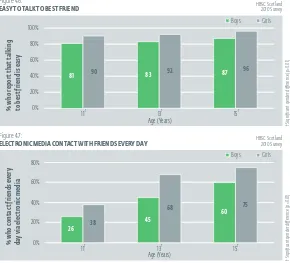
Boys are more likely than girls to spend time with friends immediately after school, and at age 15, boys are more likely than girls to spend time with friends in the evening. Frequent contact with friends after school and in the evening has declined between 2002 and 2010. Most young people (88%) say they find it easy to talk to their best friend about things that really bother them (93% of girls and 84% of boys), with greater proportions of older than younger children. Half of young people (52%) contact their friends daily via phone, text messages and/or the internet. Electronic media contact is more common among girls than boys, and among older rather than younger adolescents.
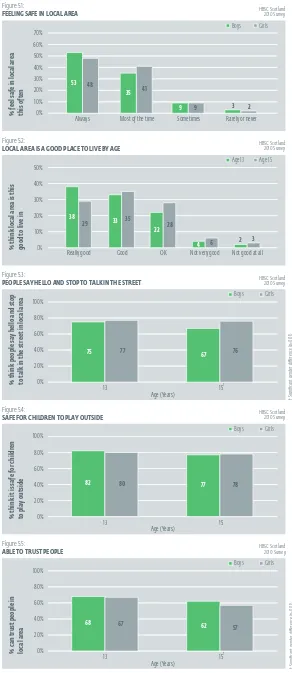
NEIGHBOURHOOD ENVIRONMENT
Half of young people (51%) always feel safe in their local area, (53% of boys and 48% of girls), and a further 38% feel safe most of the time. A third of young people think their local area is a really good place to live, (36% of boys and 31% of girls), with larger proportions at age 13. Half of young people agree that there are good places to go locally and two thirds feel they trust people in their local area, with larger proportions at age 13. At age 15, both boys and girls are less likely to have a favourable perception of their local area. 15-year old girls use green space less frequently and for shorter periods compared with 13-year old girls or boys of either age.
ix
TH
E H
EA
LTH B
EH
AV
IO
UR I
N S
CH
OO
L-A
GE
D C
HIL
DR
EN
:
W
HO C
OL
LA
BO
RA
TIV
E C
RO
SS-NA
TIO
NA
L S
TU
DY (
HB
SC)
SC
OT
LA
ND N
AT
IO
NA
L R
EP
OR
T 2
010
EATING HABITS
Almost three quarters of young people (72%) eat a meal with their family four or more days a week and almost two thirds (63%) eat breakfast every school day. The frequency of family meals and breakfast consumption is greater among younger adolescents. 36% of young people eat fruit daily and 36% eat vegetables daily, with higher proportions of girls eating fruit and vegetables daily than boys. The proportion of young people eating fruit daily is greater among younger adolescents, while there is no age difference in consumption of vegetables. Girls and boys are equally likely to eat sweets (29%), crisps (21%) or chips (8%) daily. Between 2002 and 2010, daily sweet consumption fell by a third while consumption of crisps and chips halved.
PHYSICAL ACTIVITY AND SEDENTARY BEHAVIOUR
19% of boys and 11% of girls meet the Scottish Government guidelines for moderate to vigorous physical activity. Older boys and girls take part in vigorous exercise less often than younger boys and girls. Duration of exercise is greater among older boys, but remains the same among girls across all ages. Approximately half of young people in Scotland walk to school and walking to school is more common among primary than secondary school children. Primary school children watch TV less often during the week than secondary pupils with no gender differences in watching TV at any age. TV viewing on week days has decreased since 2002 but TV viewing at the weekend has remained stable. Boys play computer games more often than girls at all ages. Computer use for purposes other than games is higher among secondary girls than boys during the week and at the weekend.
WEIGHT CONTROL BEHAVIOUR
Girls are twice as likely as boys to be on a diet or doing something else to lose weight (21% and 10% respectively). Older girls are more likely than younger girls to try to control their weight, whilst there is no age difference among boys. There was no change in the proportions of boys and girls on a diet between 2002 and 2010.
BODY IMAGE AND BMI
A quarter of boys and two fifths of girls report that they feel too fat. 37% of boys and 24% of girls consider themselves to be good looking. Young people’s views of their physical appearance and body size are less favourable at ages 13 and 15 than at age 11. The proportion of boys reporting that they are too fat increased between 1990 and 2010. Three quarters of 15-year olds are classified as having a normal weight according to their BMI and 3% are classified as being obese.
TOOTH BRUSHING
Girls are more likely than boys to brush their teeth at least twice a day (81% compared with 66%). There has been a steady increase from 1990 to 2010 in the proportion of boys and girls who brush their teeth two or more times a day. The greatest increases were found among boys and 11-year olds.
WELL-BEING
x
girls’ confidence have decreased, while there has been no change in the proportions never feeling left out or having multiple health complaints.
SUBSTANCE USE
One in five young people have tried smoking, and 9% of girls and 8% of boys report that they smoke at present. At age 15, 59% of current smokers report that they smoke every day. Smoking behaviour among young people increased in the 1990’s but smoking rates have since fallen to those of 1990. The gender gap in smoking that appeared in the late 90s, with girls smoking more than boys is no longer apparent. One in ten 13-year olds and more than one in four 15-year olds drink alcohol at least once a week. Boys are most likely to drink beer, while girls prefer spirits and alcopops. Weekly drinking among young people increased in the 1990’s but weekly drinking rates have since returned to those of 1990. 19% of 15-year olds and 4% of 13-year olds have used cannabis. There was a considerable drop in cannabis use among 15-year olds between 2002 and 2010, observed among former, experimental, regular and heavy users.
SEXUAL HEALTH
Friends and schools rank first and second as primary sources of information on sexual matters for both boys and girls. Compared with 2006, boys are more likely to source information on sexual matters from the internet and less likely to get information from school. Approximately three quarters of 15-year olds report that it is easiest to discuss personal and sexual matters with friends. Almost a third of 15-year olds say that they have had sexual intercourse, with girls (35%) more likely to report sexual intercourse than boys (27%). The proportion of 15-year olds who used a condom during last intercourse increased between 2002 and 2006, from 70% to 79%, but has since dropped to 72% in 2010.
BULLYING AND FIGHTING
9% of young people have been bullied at least two or three times a month at school in the previous two months, although prevalence of bullying is lowest among 15-year olds (6%). 5% of young people report having bullied others in the past couple of months (7% of boys and 2% of girls). The proportion of boys involved in a physical fight three or more times in the previous 12 months decreased between 2002 and 2010, from 23% to 17%. Fighting is more prevalent among younger than older boys.
INJURIES
TH
E H
EA
LTH B
EH
AV
IO
UR I
N S
CH
OO
L-A
GE
D C
HIL
DR
EN
:
W
HO C
OL
LA
BO
RA
TIV
E C
RO
SS-NA
TIO
NA
L S
TU
DY (
HB
SC)
SC
OT
LA
ND N
AT
IO
NA
L R
EP
OR
T 2
010
xi We thank the Regional and Island Authorities for granting permission for their schools to participate in the survey; and
all the young people who completed questionnaires; and the schools and teachers who kindly agreed to administer the survey. Data collection and data entry was carried out by George Street Research.
Acknowledgement is made to all national teams in the international HBSC research network who collaborated on the production of the HBSC international research protocol and the support of the WHO Regional Office for Europe. We are grateful to Gerry McCartney, Head of the Public Health Observatory and his team at Health Scotland for their ongoing support. The HBSC study in Scotland is funded by NHS Health Scotland. Special thanks go to Justine Geyer for her input to the Neighbourhood environment chapter and Emily Healy, Jehane Barbour, Anne Valentine and Paula Grieve for editorial support.
Design work is by Damian Mullan at So… It Begins and illustrations are by Jill Calder.
HBSC National Team:
Candace Currie (Principle Investigator) Dorothy Currie
Jo Inchley Jo Kirby Kate Levin
Winfried van der Sluijs
1
THE HEALTH BEHAVIOUR IN SCHOOL-AGED CHILDREN:WHO COLLABORATIVE CROSS-NATIONAL STUDY (HBSC)
SCOTLAND NATIONAL REPORT 2010
INTRODUCTION
AND METHODS
THE HEALTH BEHAVIOUR IN SCHOOL-AGED CHILDREN: WHO COLLABORATIVE CROSS-NATIONAL STUDY (HBSC) SCOTLAND NATIONAL REPORT 2010
INTRODUCTION AND METHODS
2
INTRODUCTION
Health improvement of young people in Scotland
The improvement of young people’s health in Scotland is a key aim of recent Government policies. National and local targets and programmes concerned with children and adolescents have focused on physical activity, nutrition and their importance in tackling obesity, as well as mental health and sexual health, with an overarching aim to reduce health inequalities. Other areas of concern are smoking, alcohol and drug use, and risks associated with overweight. The strong commitment to young people’s health is evident in recent policy documents, such as Healthy Eating, Active Living: an action plan to improve diet, increase physical activity and tackle obesity (2008-2011) (Scottish Government, 2008) and Towards a Mentally Flourishing Scotland (Scottish Government, 2009). Within the school context, the importance of a health promoting environment for young people is emphasised in The Curriculum for Excellence (Scottish Executive, 2004) which stipulates that mental, emotional, social and physical well-being is essential for successful learning. This is supported by the Schools (Health Promotion and Nutrition) (Scotland) Act 2007 (Scottish Government, 2007) which states that schools have a duty to promote the mental, emotional social and physical health and well-being of all pupils.
The Health Behaviour in School-Aged Children: WHO Collaborative Cross-National Study (HBSC)
The Health Behaviour in School-Aged Children (HBSC) Study in Scotland is a key source of information on child and adolescent health in the country. HBSC takes a broad perspective, gathering information on wide ranging aspects of young people’s health and well-being as well as the social contexts within which they are growing up (Currie et al., 2004; 2008; 2010). The HBSC Cross-National Study initiated in 1983 in three countries, has now grown to include 43 countries in Europe and North America. Scotland became a member country in 1986 and the first national HBSC survey was conducted in 1990. National surveys have been conducted every four years since then in line with the cross-national survey cycle. The study in Scotland is based at the Child and Adolescent Health Research Unit (CAHRU), University of Edinburgh. CAHRU is also the HBSC International Coordinating Centre (ICC). NHS Health Scotland funds the national study and also provides support to the ICC.
The target population of the HBSC study is young people attending school, aged 11, 13 and 15 years. These age groups were selected because it is during these years that important stages of development occur (i.e., the onset of adolescence, the challenge of physical and emotional changes and the middle teenage years when important life and career decisions are being made). The school-based survey is administered to a nationally representative sample of approximately 1500 pupils from each age group in each participating country. Pupils complete questionnaires in the classroom during one school period.
HBSC is conducted in collaboration with the World Health Organization Regional Office for Europe and this partnership supports the wide dissemination of research findings to inform and influence health promotion and health education policy and practice at national and international levels. The Scottish HBSC team has produced a range of papers, reports and briefing papers to inform policy makers, practitioners, and academics on findings from the study. These are available on the CAHRU website1. A full list of international publications is presented on the HBSC website2.
The report
1
TH
E H
EA
LTH B
EH
AV
IO
UR I
N S
CH
OO
L-A
GE
D C
HIL
DR
EN
:
W
HO C
OL
LA
BO
RA
TIV
E C
RO
SS-NA
TIO
NA
L S
TU
DY (
HB
SC)
SC
OT
LA
ND N
AT
IO
NA
L R
EP
OR
T 2
010
3 commonly reported issues are also examined; examples include how young people feel about their bodies, their efforts
at weight control, their experience of bullying and fighting, how they get along with friends and family, their perception of their neighbourhood environment and relationships at school. HBSC places young people’s health in social and economic context and gathers data on family structure and socioeconomic circumstances. The report therefore also shows how the social context of young people’s lives have changed over recent years. Analyses assessing the role that contextual factors play in explaining young people’s health and well-being in Scotland are reported in briefing papers and journal publications listed on the CAHRU website1.
STUDY METHODOLOGY
Questionnaire design
The Scottish HBSC questionnaire follows the international HBSC survey protocol, developed by the HBSC international network of researchers from member countries. The questionnaire is designed by network members working in focus groups according to area of expertise in various aspects of adolescent health. The study methods are outlined briefly below, with a more comprehensive description available elsewhere (Currie et al., 2010; Roberts et al., 2004; 2007). For each survey round a full research protocol is developed which includes the scientific rationales for topic areas included in the international standard questionnaire. While some items remain from each survey year to the next, others may change and others still may be dropped entirely according to national and international priorities and methodological developments. Items are subject to validation procedures in several countries before final versions are submitted for inclusion in the international questionnaire (eg. Andersen, 2008; Boyce, et al., 2006; Elgar et al., 2005; Haugland and Wold, 2001; Vereecken and Maes, 2003). In 2010 there were 54 questions (with 125 items) that were considered ‘core’ to the international study. These questions are mandatory for all member countries of the network, including Scotland, to ensure that international comparisons can be made on a number of key social, health and behaviour measures. In addition to the mandatory questions required by the HBSC network, optional thematic packages validated internationally are made available. The Scottish HBSC questionnaire also includes items that are of specific interest to the health of Scottish adolescents.
The Scottish national questionnaire was piloted in the autumn term of 2009 before the final version was submitted for documentation to the international HBSC data management centre in Bergen. The sample was re-surveyed 4 weeks later to allow for the calculation of reliability statistics for each item.
The questionnaire is designed to take approximately 40 minutes to complete.
Sample design
The HBSC 2010 sample was designed to be nationally representative and produce robust prevalence estimates describing the social context, health and health behaviour of 11, 13 and 15-year olds in Scotland. The survey was conducted in schools, using the class as the sampling unit, with all the pupils in selected classes being asked to complete the confidential questionnaire anonymously.
THE HEALTH BEHAVIOUR IN SCHOOL-AGED CHILDREN: WHO COLLABORATIVE CROSS-NATIONAL STUDY (HBSC) SCOTLAND NATIONAL REPORT 2010
INTRODUCTION AND METHODS
4
local authority-funded and independent sector schools were included in the sample frame, with the exception of schools for children with special educational needs.
The sample was proportionally stratified by school funding (state-funded or independent) and education authority for state funded schools, with implicit stratification for socio-economic status, taking the proportion of children with free school meals as a proxy. Samples were selected separately for each school year group.
Within each strata, schools were selected with probability proportional to the number of classes in the required year group. This meant that larger schools had a higher probability of inclusion in the sample of schools. For each age group, one class from each selected school was included in the sample, so that within those schools selected, individual pupils had a higher probability of inclusion into the sample if they attended smaller schools. This ensured that each Scottish pupil in the age groups described had the same probability of inclusion in the sample.
Sample size and precision of estimates
The sample size aimed for within each of the three age groups was set at around 2000 students, to allow more scope in subgroup analyses. A booster rural sample was also surveyed that will be reported on in future publications. The sample was selected using cluster sampling by school class, rather than simple random sampling. If cluster sampling methods are not accounted for in analysis, this can result in underestimation of standard errors. The design factor is the amount by which the sample size computed for a simple random sample should be multiplied to account for cluster sampling, ie sampling classes rather than children. For example, the proportion of 13-year olds who have ever smoked is 19%. The standard error under the assumption of random sampling is 0.8%.The true complex standard error for this proportion, which takes account of the sample design, is 1.2%, resulting in 95% confidence intervals of 16.4%-21.0%. This compares with a confidence interval of 17.0%-20.3% under the assumption of random sampling. The design factor in this example is 1.2/0.8=1.5. The sample size is adjusted upwards so that despite clustering the required levels of precision (+/- 3%) are maintained.
Response rates
1
TH
E H
EA
LTH B
EH
AV
IO
UR I
N S
CH
OO
L-A
GE
D C
HIL
DR
EN
:
W
HO C
OL
LA
BO
RA
TIV
E C
RO
SS-NA
TIO
NA
L S
TU
DY (
HB
SC)
SC
OT
LA
ND N
AT
IO
NA
L R
EP
OR
T 2
010
5
Table 1.1
RESPONSE RATES BY CLASS
RESPONSE RATES IN 2010 PERCENTAGE ACHIEVED SAMPLES
Primary 7
Class response 71%
Pupil response 93%
Total response 66% 2074
Secondary 2
Class response 75%
Pupil response 89%
Total response 66% 2131
Secondary 4
Class response 72%
Pupil response 87%
Total response 63% 2566
Whole sample response 65% 6771
Administration of survey instrument
Questionnaires were administered in schools between January and March 2010. The administration of the questionnaire in schools was conducted by school teachers who were given precise instructions on how to carry this out. Teachers were also given a class return form to complete which detailed how many pupils completed the questionnaire, how many were absent and reasons for absence. On completion, each pupil placed the questionnaire in an envelope and sealed it. The completed questionnaires were then returned by all schools. Coding of responses and data entry was conducted according to protocol guidelines. The national dataset was then submitted with complete documentation of the procedures adopted, as well as any deviations in the wording of questions or choice of responses, to the international data management centre in Bergen. The Norwegian Social Science Data Service (NSD) performed cleaning and data quality checks under the supervision of the HBSC data manager, and produced the full international dataset, available for use by members of the research network.
Ethical approval and consent
THE HEALTH BEHAVIOUR IN SCHOOL-AGED CHILDREN: WHO COLLABORATIVE CROSS-NATIONAL STUDY (HBSC) SCOTLAND NATIONAL REPORT 2010
INTRODUCTION AND METHODS
6
RESULTS
Presentation of findings
The Report is made up of 15 chapters, including this first one which gives a broad introduction and background to the study. Chapters 2 to 5 give a descriptive summary of social factors which are known to be associated with the health behaviour of young people: family life, the school environment, peer relations and neighbourhood environment. The remainder of the report describes prevalence of various health indicators and behaviours, broken down by age and gender and where possible, over time. Most of the findings presented in this report are based on collapsing response options to questionnaire items.
Data analyses
For the most part, comparisons were drawn between genders and age groups in the prevalence of health outcomes described by proportions. Design adjusted chi-square tests were carried out to assess statistical significance of differences between genders and age groups. All differences or changes reported are significant unless otherwise stated. In this report a 99% level of significance was used in the comparison of proportions. This more conservative measure was used in preference to 95% as many tests of proportions were carried out. The only exception was in comparisons of contraceptive use (Chapter 13) where a 95% level of significance was used as numbers were very small. Analyses for age and gender took account of the effect of the survey design – stratification, clustering and weighting – on the precision of the estimates presented. The statistical package STATA 10 (Stata Corporation, 2007) was used for all design-adjusted analyses.
Many of the items were collected over a number of surveys in Scotland and trends are reported for these. Where, for example, differences ‘between 1990 and 2010’ are described, the statistical test carried out was between the proportion in 1990 and the proportion in 2010. In some cases comparisons were drawn between intervening years and these are highlighted in the text.
1
TH
E H
EA
LTH B
EH
AV
IO
UR I
N S
CH
OO
L-A
GE
D C
HIL
DR
EN
:
W
HO C
OL
LA
BO
RA
TIV
E C
RO
SS-NA
TIO
NA
L S
TU
DY (
HB
SC)
SC
OT
LA
ND N
AT
IO
NA
L R
EP
OR
T 2
010
7
REFERENCES
Andersen, A., Krolner, R., Currie, C., Dallago, L., Due, P., Richter, M., Oeknyi, A., and Holstein, B.E. (2008) High agreement on family affluence between
children’s and parents’ reports: international study of 11-year old children. Journal of Epidemiology and Community Health, 62: 1092-1094.
Boyce, W., Torsheim, T., Currie, C. and Zambon, A. (2006) The Family Affluence Scale as a Measure of National Wealth: Validation of an Adolescent
Self-report Measure. Social Indicators Research, 78 (3): 473-487.
Currie, C., Grieber, R., Inchley, J., Theunissen, A., Molcho, M., Samdal, O. and Dür, W. (eds.) (2010) Health Behaviour in School-aged Children (HBSC) Study
Protocol: Background, Methodology and Mandatory Items for the 2009/10 Survey. Edinburgh: CAHRU & Vienna: LBIHPR. Found at: http://www.hbsc.org
Currie, C., Nic Gabhainn, S., Godeau, E., Roberts, C., Smith, R., Currie, D., Pickett, W., Richter, M., Morgan, A. and Barnekow, V. (Eds.) (2008) Inequalities in
young people’s health: Health Behaviour in School-aged Children International Report from the 2005/2006 Survey. Health Policy for Children and Adolescents No. 5. Copenhagen: WHO Regional Office for Europe.
Currie, C., Roberts, C., Morgan, A., Smith, R., Settertobulte,W., Samdal, O. and Barnekow Rasmussen, V. (2004) Young People’s Health in Context: Health
Behaviour in School-aged Children Study. International Report from the 2001/2002 Survey. Health Policy for Children and Adolescents No.4. Copenhagen, Denmark: WHO Regional Office for Europe.
Elgar, F.J., Roberts, C., Tudor-Smith, C. and Moore, L. (2005) Validity of self-reported height and weight and predictors of bias in adolescents. Journal of
Adolescent Health, 37 (5): 371-375.
Haugland, S. and Wold, B. (2001) Subjective health complaints in adolescence – Reliability and validity of survey methods. Journal of Adolescence,
24(5): 611-624.
Roberts, C., Currie, C., Samdal, O., Currie, D., Smith, R. and Maes, L. (2007) Measuring the health and health behaviours of adolescents through
cross-national survey research: recent developments in the Health Behaviour in School-aged Children (HBSC) study. Journal of Public Health, 15 (3), 179-186.
Roberts, C., Tynjala, J., Currie, D. and King, M. (2004) Methods. In Currie C. et al (eds.) Young People’s Health in Context: international report from the HBSC
2001/02 survey. WHO Policy Series: Health policy for children and adolescents Issue 4, WHO Regional Office for Europe, Copenhagen.
Scottish Executive (2004) A Curriculum for Excellence. Edinburgh: Scottish Executive.
Scottish Executive (2007) Schools (Health Promotion and Nutrition) (Scotland) Act 2007. Edinburgh: The Stationery Office.
Scottish Government (2008) Healthy Eating, Active Living: an action plan to improve diet, increase physical activity and tackle obesity (2008-2011). Edinburgh:
Scottish Government.
Scottish Government (2009) Towards a Mentally Flourishing Scotland: Policy and Action Plan 2009-2011. Edinburgh: Scottish Government.
Stata Corporation, 2007. Stata Statistical Software: Release 10. College Station, TX: StataCorp LP.
Vereecken, C.A., Maes , L. (2003) A Belgian study on the reliability and relative validity of the Health Behaviour in School-Aged Children food frequency questionnaire. Public Health Nutrition, 6, 581-588.
NOTES:
2
• In Scotland, 66% of young people live with both parents, 21% with a single parent (19% with mother and
2% with father) and 11% in a step family. The remaining 2% live in a variety of other care arrangements
• Of those children living with ‘both parents’, 76% have both parents in employment, and a further 21% have one
parent in employment. Among children from single parent families, 74% report that their parent is employed
• Of the 66% of fathers who have been assigned socio-economic status (SES), most fall into the
‘managerial/technical’ (SES 2) and ‘skilled manual’ (SES 4) categories. Among the 63% of mothers
with an assigned SES, the most common category is ‘managerial/technical’ (SES 2)
• 55% of young people think their family is quite or very well off. 11-year olds are more likely to
describe their family as very well off than 13-year olds and 13-year olds more likely than 15-year olds
• The proportion of young people reporting that their family is well off has increased between 1998 and 2010
• In general, young people find it easier to talk to their mother (80%) than to their father (63%) and ease
of communication with parents (particularly fathers) deteriorates with age for both boys and girls
• Boys and girls find it equally easy to talk to their mother about things that bother them but boys
are more likely than girls to report easy communication with their father
THE HEALTH BEHAVIOUR IN SCHOOL-AGED CHILDREN: WHO COLLABORATIVE CROSS-NATIONAL STUDY (HBSC)
SCOTLAND NATIONAL REPORT 2010
FAMILY LIFE
10
THE HEALTH BEHAVIOUR IN SCHOOL-AGED CHILDREN: WHO COLLABORATIVE CROSS-NATIONAL STUDY (HBSC) SCOTLAND NATIONAL REPORT 2010
FAMILY LIFE
INTRODUCTION
Family life is an important part of adolescence, allowing for fundamental development during this stage of life (Noller, 1994). There is a large body of research on the influence of the family on outcomes for adolescents, and their health has been linked to such elements as family structure, family affluence, cohesion and communication (Currie et al., 2004; Currie et al., 2008a; Levin and Currie, 2010a; Levin and Currie, 2010b). The recent Scottish action framework Delivering a Healthy Future
(Scottish Executive, 2007) acknowledges the importance of the family and family life in many aspects of young people’s health.
The composition of the family (e.g. biological parents, step families or single parents) has undergone significant change over recent decades. Young people are growing up in increasingly diverse living arrangements, and single parent families have become more prominent over recent years (Murphy, 2000). In Scotland, the proportion of young people living with both parents has gradually declined since 1990 while the proportion living in single parent and step parent families has increased. Similar patterns of change have been identified in many European countries (Iacovou, 2004). As such, the way in which family structure may impact risk behaviours and health outcomes has received increasing attention e.g. (Blum et al., 2000). Although two-parent families have previously been associated with more favourable health outcomes, it is also well established that different social and cultural norms may lead to variations in the association between family structure and health (Sweeting and West, 1995). Family structure is associated with a wide range of health behaviours, for example, tooth brushing (Levin and Currie, 2010b) smoking (Griesbach et al., 2003) and substance use (McArdle et al., 2002).
As well as family structure, aspects of family functioning may also impact on adolescent health. A poor relationship and conflict with parents may result in lower self-esteem and poorer psychological well-being among adolescents (Sweeting and West, 1995). Attachment to parents has been identified as having a strong influence on emotional well-being and emotional problems (Garnefski and Diekstra, 1997). Having good communication with parents is associated with fewer psychological complaints (e.g. feeling low, difficulties in sleeping) (Moreno et al., 2009) and with higher life satisfaction (Levin and Currie, 2010a).
As young people go through adolescence, they typically spend less time with the family, and increasing time is spent with peers (Myers, 2000). Indeed, joint family activities have been shown to decline during adolescence (Zaborskis et al., 2007). Previous research has suggested that a strong family bond can be reflected in a young person’s adoption of parental and societal norms and values, thereby offering protection against engagement in certain risk behaviours (Bell et al., 2000). Spending time with family, for example, has been shown to limit adolescent excessive drinking (Kuendig and Kuntsche, 2006), and increase diet quality (Gillman et al., 2000; Verzeletti et al., 2010). Eating together as a family during childhood may also lead to multiple health benefits in later years, and has been associated with increased family cohesion and emotion-focused coping (Franko et al., 2008).
11
2
TH E H EA LTH B EH AV IO UR I N S CH OO L-A GE D C HIL DR EN : W HO C OL LA BO RA TIV E C RO SS-NA TIO NA L S TU DY ( HB SC) SC OT LA ND N AT IO NA L R EP OR T 2 010 FA M ILY L IFE Figure 2.1:FAMILY STRUCTURE HBSC Scotland2010 Survey
Single parent 21%
Step family
11% Other 2%
Both parents 66% 0% 20% 40% 60% 100% 80% Figure 2.2:
FAMILY STRUCTURE 1990 – 2010
Step Family Other
Both Parents Single Parent
% l iv in g i n t hi s fa m ily st ru ct ur e HBSC Scotland 1990 – 2010 Surveys
1998
1990 1994 2002 2006 2010
73 17 10 79 145 77 166 69 17 12 66 11 21 68 12 19 0% 5% 10% 15% 30% 20% 25% Figure 2.3:
SES OF MOTHERS AND FATHERS
Fathers Mothers
% in SES group
SES 1
(High) SES 2 SES 3 SES 4 SES 5 (Low) (SES unknown)Employed employedNot Don’t know
25 22
8 25
16 15
11 13 10
15 16
3
4 6 4 6
HBSC Scotland 2010 Survey
Figure 2.4:
FAMILY SES HBSC Scotland2010 Survey
SES 1 (High) 6%
Don’t Know
5%
Not Employed 5%
Employed (SES Unknown)
10%
SES 5 (Low)
9%
SES 4 15% SES 3 14%
SES 2
38%
Figure 2.5:
FAMILY AFFLUENCE HBSC Scotland2010 Survey
Unclassified 3% Low 9%
Medium 35%
[image:23.567.135.421.77.733.2]12
THE HEALTH BEHAVIOUR IN SCHOOL-AGED CHILDREN: WHO COLLABORATIVE CROSS-NATIONAL STUDY (HBSC) SCOTLAND NATIONAL REPORT 2010
FAMILY LIFE
HBSC FINDINGS
Various dimensions of family life are measured within the HBSC study, including family structure, parental employment and occupation, family affluence, perceived wealth and parent-child communication. Family structure and communication with parents have been recorded since 1990 allowing for examination of 20 years of trend data, with perceived wealth having been recorded since 1998.
FAMILY STRUCTURE
Young people were asked who they live with1. In 2010, 66% of young people in Scotland lived with both their parents, 21%
with a single parent (19% with mother and 2% with father) and 11% in a step family. A further 2% reported living in another home environment, such as a foster home, children’s home or with members of their extended family (Figure 2.1). These figures are very similar to those reported by the Office for National Statistics (ONS, 2009).
The proportion of young people living with both parents has gradually declined since 1990, while the proportions living in single parent and step family households have increased (Figure 2.2). This trend is found in many other European countries (Berthoud and Iacovou, 2005).
PARENTAL EMPLOYMENT AND FAMILY SOCIOECONOMIC STATUS
Among children defined as living with ‘both parents’, 76% have parents who are both employed, 21% have one parent in employment and 3% have parents who are not working. Seventy four percent (74%) of children who live with just their mother have working mothers and 73% of those living with only their father have working fathers.
Young people were asked the occupation of their parent(s) and from this information a socio-economic status (SES) between 1 (high) to 5 (low) was assigned to each parent, using the Registrar General’s social class classification. Two thirds of parents could be assigned a socio-economic status (63% of mothers and 66% of fathers). The remainder fall into one of three categories: ‘employed and SES unknown’, ‘not employed’ or ‘don’t know’. Where the job description is impossible to classify (15% of fathers and 11% of mothers), parents are described as ‘employed — SES unknown’. Parents who do not work because they are sick, retired, studying, unemployed or caring for others are described as ‘not employed’. Where no information is provided, occupational status is classified as ‘don’t know’.
The occupational status of children’s parents is presented in Figure 2.3. Of the 66% of fathers who have been assigned socio-economic status, most fall into the ‘managerial/technical’ (SES 2) and ‘skilled manual’ (SES 4) categories. Among the 63% of mothers with an assigned SES, the most common category is ‘managerial/technical’ (SES 2), followed by ‘skilled non-manual’ (SES 3) and ‘unskilled’ (SES 5). Sixty percent (60%) of mothers who are not employed are ‘taking care of others’ or ‘full time in the home’, compared with 16% of fathers who are not working.
13
2
TH E H EA LTH B EH AV IO UR I N S CH OO L-A GE D C HIL DR EN : W HO C OL LA BO RA TIV E C RO SS-NA TIO NA L S TU DY ( HB SC) SC OT LA ND N AT IO NA L R EP OR T 2 010 FA M ILY L IFE 0% 10% 20% 30% 50% 40% HBSC Scotland 2010 Survey Figure 2.6:PERCEIVED FAMILY WEALTH BY AGE
Age 13
Age 11 Age 15
% who report how well off their family is
Quite well off
Very well off Average Not very
well off Not at all well off
27 18
11
4 4 6
31 38 41
2 1 2 35 38 41
0% 10% 5% 15% 20% 25% Figure 2.7:
PERCEIVED FAMILY WEALTH 1998 – 2010
Boys Girls % w ho r ep or t t ha t t he ir fa m ily is ve ry w el l o ff HBSC Scotland 1998 – 2010 Surveys
† S ign ific an t g en de r d iff er en ce ( p< 0.0 1) 15 11 2002† 21 16 2010† 19 16 2006† 9 12 1998† 0% 20% 40% 60% 100% 80% Figure 2.8:
EASY TO TALK TO FATHER
Boys Girls
% who report that talking to father is easy
11† 13† 15† Age (Years) 81 64 73
52 62 47
HBSC Scotland 2010 Survey † S ign ific an t g en de r d iff er en ce ( p< 0.0 1) 0% 20% 40% 60% 100% 80% Figure 2.9:
EASY TO TALK TO MOTHER
Boys Girls
% who report that talking to mother is easy
11 13 15
Age (Years)
89 87 79 79
73 74
[image:25.567.136.427.79.612.2]THE HEALTH BEHAVIOUR IN SCHOOL-AGED CHILDREN: WHO COLLABORATIVE CROSS-NATIONAL STUDY (HBSC) SCOTLAND NATIONAL REPORT 2010
FAMILY LIFE
FAMILY AFFLUENCE
As illustrated above, children and young people are often unable to give sufficient information about their parents’ occupational status and therefore it is difficult to assign an SES score. As an alternative, family affluence can be used as a proxy measure of socio-economic status. To assess family affluence, young people were asked to report (a) the number of cars in their family, (b) the number of computers at home, (c) the number of family holidays taken in the previous 12 months and (d) if they have their own bedroom. The Family Affluence Score (FAS) is a validated measure derived from these items and children are classified as having low, medium or high affluence (Currie et al., 1997; 2008a). Fewer children are unclassifiable using FAS than SES (19% of children were unclassifiable according to parental occupation, whereas only 3% could not be given a Family Affluence Score).
In 2010, 53% of young people were classified as having high affluence families, 35% medium affluence and 9% low affluence (Figure 2.5). This classification is based on cut-offs devised for international comparisons, where the UK is relatively affluent. High, medium and low tertiles of the FAS distribution are often used for within-country analyses.
PERCEIVED WEALTH
A subjective measure of family wealth was obtained by asking young people ‘How well off do you think your family is?’. As shown in Figure 2.6, 38% of young people responded ‘average’, 37% ‘quite well off’ and 19% ‘very well off’. Just 6% of young people thought that their family was not well off, although perception of wealth changes with age. 11-year olds are more likely to describe their family as very well off than 13-year olds, and 13-year olds more likely than 15-year olds. The family affluence score, on the other hand, is similar across all three age groups.
Young people were asked to report perceived wealth in three previous surveys in Scotland (1998, 2002 and 2006) and trend analysis shows an increase in the proportion describing their family as very well off between 1998 and 2010. The data show increases from 9% to 16% among girls (with no change between 2006 and 2010) and 12% to 21% among boys (Figure 2.7).
COMMUNICATION BETWEEN PARENTS AND ADOLESCENTS
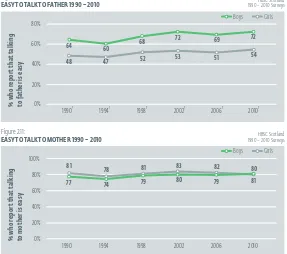
Young people are more likely to find it easy to talk to their mother (80%) than to their father (63%) about things that really bother them. Easy communication with parents becomes less likely with age for both boys and girls (Figure 2.8). Seventy two percent (72%) of 11-year olds, 62% of 13-year olds and 54% of 15-year olds find it easy to talk to their father. Boys and girls find it equally easy to communicate with their mother, but boys find it easier than girls to talk to their father at all three ages (Figures 2.8 and 2.9).
Between 1990 and 2010 there was an increase in easy communication with fathers for boys but not for girls and very little change in easy communication with mothers for either boys or girls (Figures 2.10 and 2.11). The data also show a persistent gender difference in ease of communication with fathers but not mothers.
TH E H EA LTH B EH AV IO UR I N S CH OO L-A GE D C HIL DR EN : W HO C OL LA BO RA TIV E C RO SS-NA TIO NA L S TU DY ( HB SC) SC OT LA ND N AT IO NA L R EP OR T 2 010 FA M ILY L IFE
2
15 0% 40% 20% 60% 80% Figure 2.10:EASY TO TALK TO FATHER 1990 – 2010
Boys Girls % w ho r ep or t t ha t t al ki ng to fa th er is ea sy HBSC Scotland 1990 – 2010 Surveys
† S ign ific an t g en de r d iff er en ce ( p< 0.0 1) 52 68 1998† 47 60 1994† 48 64 1990† 53 72 2002† 54 72 2010† 51 69 2006† 0% 40% 20% 60% 100% 80% Figure 2.11:
EASY TO TALK TO MOTHER 1990 – 2010
Boys Girls % w ho r ep or t t ha t t al ki ng to m ot he r i s e as y HBSC Scotland 1990 – 2010 Surveys
THE HEALTH BEHAVIOUR IN SCHOOL-AGED CHILDREN: WHO COLLABORATIVE CROSS-NATIONAL STUDY (HBSC) SCOTLAND NATIONAL REPORT 2010
FAMILY LIFE
REFERENCES
Bell, N.J., Forthun, L.F. and Sun, S-W. (2000) Attachment, adolescent competencies, and substance use: developmental considerations in the study of risk
behaviors. Substance Use and Misuse, 35: 1177-1206.
Berthoud, R. and Iacovou, M. (2005) Diverse Europe: Mapping patters of social change across the EU. London: Institute for Social and Economic Research.
Blum, R.W., Beuhring, T., Shew, M.L., Bearinger, L.H., Sieving, R.E. and Resnick, M.D. (2000) The effects of race/ethnicity, income, and family structure on
adolescent risk behaviors, American Journal of Public Health, 90: 1879-1884.
Currie, C.E., Elton, R.A., Todd, J. and Platt, S. (1997) Indicators of socioeconomic status for adolescents: the WHO Health Behaviour in School-aged Children
Survey. Health Education Research, 12: 385-397.
Currie, C., Roberts, C., Morgan, A., Smith, R., Settertobulte, W., Samdal, O. and Barnekow Rasmussen, V. (Eds.) (2004) Young People’s Health in Context, Health
Behaviour in School-aged Children study: International Report from the 2001/2002 Survey. Health Policy for Children and Adolescents No.4. Copenhagen: WHO Regional Office for Europe.
Currie, C., Molcho, M., Boyce, W., Holstein, B., Torsheim, T. and Richter, M. (2008a) Researching health inequalities in adolescents: the development of the
Health Behaviour in School-aged Children (HBSC) Family Affluence Scale. Social Science & Medicine, 66: 1429-1436.
Currie, C., Nic Gabhainn, S., Godeau, E., Roberts, C., Smith, R., Currie, D., Pickett, W., Richter, M., Morgan, A. and Barnekow, V. (Eds.) (2008b) Inequalities in
young people’s health: Health Behaviour in School-aged Children International Report from the 2005/2006 Survey. Health Policy for Children and Adolescents No. 5. Copenhagen: WHO Regional Office for Europe.
Franko, D.L., Thompson, D., Affenito, S.G., Barton, B.A. and Striegel-Moore, R.H. (2008) What mediates the relationship between family meals and adolescent
health issues? Health Psychology, 27: S109-S117.
Garnefski, N. and Diekstra, R.F. (1997) Adolescents from one parent, step parent and intact families: emotional problems and suicide attempts. Journal of
Adolescence, 20: 201-208.
Gillman, M.W., Rifas-Shiman, S.L., Frazier, A.L., Rockett, H.R.H., Camargo, C.A., Field, A.E., Berkey, C.S. and Colditz, G.A. (2000) Family dinner and diet quality
among older children and adolescents. Archives of Family Medicine, 9: 235-240.
Griesbach D, Amos A, and Currie C (2003) Adolescent smoking and family structure in Europe. Social Science & Medicine, 56: 41-52.
Iacovou, M. (2004) Patterns of family living. In: R. Berthoud and M. Iacovou (Eds). Social Europe: Living Standards and Welfare States. Cheltenham, UK: Edward
Elgar, pp. 21-45.
Kuendig, H. and Kuntsche, E. (2006) Family bonding and adolescent alcohol use: moderating effect of living with excessive drinking parents. Alcohol and
Alcoholism, 41: 464-471.
Levin, K.A. and Currie, C. (2010a) Family structure, mother-child communication, father-child communication, and adolescent life satisfaction: A cross-sectional multilevel analysis. Health Education, 110(3): 152-168.
Levin, K.A. and Currie, C. (2010b) Adolescent toothbrushing and the home environment: Sociodemographic factors, family relationships and mealtime
routines and disorganisation. Community Dentistry and Oral Epidemiology. 38: 10-18.
McArdle, P., Wiegersma, A., Gilvarry, E., Kolte, B., McCarthy, S., Fitzgerald, M., Brinkley, A., Blom, M., Stoeckel, I., Pierolini, A., Michels, I., Johnson, R. and
Quensel, S. (2002) European adolescent substance use: the roles of family structure, function and gender. Addiction, 97: 329-336.
Moreno, C., Sanchez-Queija, I., Munoz-Tinoco, V., de Matos, M.G., Dallago, L., Ter Bogt, T., Camacho, I., and Rivera, F. (2009) Cross-national associations
between parent and peer communication and phychological complaints. International Journal of Public Health, 54:235-242.
Murphy, M. (2000) The evolution of cohabitation in Britain, 1960-95. Population Studies, 54: 43-56.
Myers, D.G. (2000) Psychology 7th Edition. New York: Worth Publisher.
Noller, P. (1994) Relationships with parents in adolescence: process and outcome. In: R. Montemayor, G.R. Adams and T.P. Gullotta (Eds). Personal relationships
during adolescence. Thousand Oak, CA, USA: Sage, pp. 37-77.
Office for National Statistics (2009) Social Trends, No. 39. Hampshire: Palgrave Macmillan.
Richter, M., Vereecken, C.A., Boyce, W., Maes, L., Nic Gabhainn, S. and Currie, C. (2009) Parental occupation, family affluence and adolescent health behaviour
in 28 countries. International Journal of Public Health, 54: 203-212.
Scottish Executive (2007) Delivering a Healthy Future: An Action Framework for Children and Young People’s Health in Scotland. Edinburgh: Scottish Executive.
Sweeting, H. and West, P. (1995) Family life and health in adolescence: a role for culture in the health inequalities debate. Social Science & Medicine, 40: 163-175.
Verzeletti, C., Maes, L., Santinello, M., Baldassari, D. and Vereecken, C.A. (2010) Food-related family lifestyle associated with fruit and vegetable consumption among young adolescents in Belgium Flanders and the Veneto Region of Italy. Appetite, 54: 394-397.
Zaborskis, A., Zemaitiene, N., Borup, I., Kuntsche, E. and Moreno, C. (2007) Family joint activities in a cross-national perspective. BMC Public Health, 7: 94.
NOTES
1 Children were asked about where they live all or most of the time (their main home) and, if applicable, a second home (where they live some of the time). Results described in this report refer to their main or only home.
3
• One in four pupils (25%) like school a lot and 64% of pupils feel their classmates are kind and helpful,
but these proportions vary by age and are greatest among 11-year olds
• 69% of pupils rate their school performance highly relative to their classmates, 74% of 11-year olds,
70% of 13-year olds and 65% of 15-year olds
• Pupils of all ages are affected by schoolwork pressure, from one in five 11–year olds (22%) to over
half of all 15-year olds (54%)
• At ages 11 and 13 girls are more likely than boys to report that they like school a lot, but there is no gender
difference at age 15
• At age 11 girls are more likely than boys to rate their school performance highly relative to their peers and
to report that their classmates are kind and helpful, but there are no gender differences in secondary school
• At age 11 boys are more likely than girls to report that they are pressured by schoolwork,
but at age 13 and 15 girls are more likely to report feeling the pressures of schoolwork
THE HEALTH BEHAVIOUR IN SCHOOL-AGED CHILDREN: WHO COLLABORATIVE CROSS-NATIONAL STUDY (HBSC)
SCOTLAND NATIONAL REPORT 2010
THE SCHOOL ENVIRONMENT
THE HEALTH BEHAVIOUR IN SCHOOL-AGED CHILDREN: WHO COLLABORATIVE CROSS-NATIONAL STUDY (HBSC) SCOTLAND NATIONAL REPORT 2010
THE SCHOOL ENVIRONMENT
18
INTRODUCTION
Adolescents spend a large proportion of their time within the school environment. The way in which they perceive their school environment may, therefore, influence not only their academic achievement (Freeman et al., 2009), but also their physical and mental health (Roeser et al., 1996). Positive perceptions of the school social climate have previously been associated with fewer emotional and behavioural problems (Kuperminc et al., 1997).
Scotland’s action framework for children and young people’s health, Delivering a Healthy Future (Scottish Executive, 2007) identifies the school as having a unique opportunity to impact positively on young people’s physical, mental and emotional health. This may present itself through education and training, the modelling of good examples, and the provision of supportive environments and opportunities. Furthermore, the Curriculum for Excellence (Scottish Executive, 2004) stipulates that mental, emotional, social and physical well-being is essential for successful learning. As such, it aims to promote a learning environment in which young people are able to develop the knowledge and understanding, as well as the skills and capabilities required for well-being, both within their school career and for their future. Teachers are encouraged to foster a safe, caring, supportive and purposeful environment that enables the development of relationships based on mutual respect.
An important element of school life is the degree to which young people feel a sense of belonging (Osterman, 2000). Relationships with peers, friends and teachers all contribute to this feeling. Previous findings confirm that the school environment and its disciplinary climate can predict student health and well-being outcomes (Saab and Klinger, 2010). Young people who hold positive perceptions of their school environment, perceive their teachers as supportive, and have a supportive peer network are more likely to engage in health promoting behaviours (McLellan et al., 1999). Positive school perceptions have also been associated with high academic achievement, low truancy, high teacher and peer support, as well as more positive emotional health and lower incidence of bullying (Freeman et al., 2009). Likewise, positive classroom management climates, participation in extracurricular activities, tolerant disciplinary policies and small school size have all been positively associated with higher school connectedness (McNeely et al., 2002). The school environment has been shown to affect girls’ general perceived health and life satisfaction more than that of boys (Raven-Sieberer et al., 2009).
HBSC FINDINGS
The HBSC survey contains a number of questions that relate closely to the school environment: how much pupils enjoy school (data collected since 1990), perceived academic performance (data collected since 1998), pressure from schoolwork (data collected since 1994) and support from classmates (data collected since 2002).
ENJOYMENT OF SCHOOL
One in four young people (25%) report that they like school a lot. However, this decreases with age group as shown in Figure 3.1; 37% of 11-year olds, 23% of 13-year olds and 14% of 15-year olds say they like school a lot. Boys are less likely than girls to report liking school a lot at ages 11 and 13, although there is no gender difference at age 15.
Figure 3.2 also shows the consistent differences over time between boys and girls in liking school a lot (except in 2002). There has been little change since 1994 in the proportion of boys or girls who report they like school a lot.
PERFORMANCE AT SCHOOL
3
TH E H EA LTH B EH AV IO UR I N S CH OO L-A GE D C HIL DR EN : W HO C OL LA BO RA TIV E C RO SS-NA TIO NA L S TU DY ( HB SC) SC OT LA ND N AT IO NA L R EP OR T 2 010 TH E S CH OO L E NV IRO NM EN T 19 0% 10% 20% 50% 40% 30% Figure 3.1:LIKE SCHOOL A LOT
Boys Girls
% who report liking school a lot
11† 13† 15 Age (Years) 32 43 20 26 14 14 HBSC Scotland 2010 Survey † S ign ific an t g en de r d iff er en ce ( p< 0.0 1) 0% 20% 10% 30% 40% Figure 3.2:
LIKE SCHOOL A LOT 1990 – 2010
Boys Girls % w ho r ep or t l ik in g sc ho ol a l ot HBSC Scotland 1990 – 2010 Surveys
† S ign ific an t g en de r d iff er en ce ( p< 0.0 1) 20 27 1998† 23 33 1990† 20 26 1994† 22 25 2002 22 27 2010† 22 29 2006† 0% 20% 40% 80% 60% Figure 3.3:
GOOD ACADEMIC PERFORMANCE AT SCHOOL
Boys Girls
% who report good/very good school performance
11†
13 15
Age (Years)
68 68 63
HBSC Scotland 2010 Survey 79 72 67 † S ign ific an t g en de r d iff er en ce ( p< 0.0 1) 0% 40% 20% 60% 80% Figure 3.4:
GOOD ACADEMIC PERFORMANCE AT SCHOOL 1998 – 2010
Boys Girls % w ho r ep or t g oo d/ ve ry go od s ch oo l p er fo rm an ce HBSC Scotland 1990 – 2010 Surveys
† S ign ific an t g en de r d iff er en ce ( p< 0.0 1) 62 69 1998† 64 71 2002† 66 73 2010† 65 70 2006† 0% 10% 20% 60% 50% 40% 30% Figure 3.5:
FEEL PRESSURED BY SCHOOLWORK
Boys Girls
% who report feeling stressed by schoolwork
11† 13† 15†
Age (Years)
25 19 25 30
[image:31.567.137.431.67.744.2]