OF THE
TAMBO RIVER, EASTERN VICTORIA
ALBERT GOEDE, B.Sc. (Hons)
A thesis submitted in fulfilment
of the requirements for the
degree of
Master of Science
UNIVERSITY OF TASMANIA
DEPARTMENT OF GEOGRAPHY
Except as stated herein, this thesis contains no material which has been accepted for the award of any other degree or diploma in any university.
To the best of my knowledge and belief this thesis contains no copy or paraphrase of material previously published or written by another person, except when due reference is made in the text.
Signed,
Vertical aerial view of Tambo River at Swifts Creek.
Photo: Royal Australian Air Force
List of Figures
List of Plates
List of Tables
List of Symbols
Acknowledgements
• ABSTRACT
INTRODUCTION
CHAPTER I ENVIRONMENT 6
Climate • 6
Vegetation and Soils 8
• Geology 11
Regional Geomorphology 19
CHAPTER II • PARAMETRIC DESCRIPTION AND SAMPLING PROCEDURE 30
•
Choice of Parameters 30
Measures of Shape • 30
Measuresof Roundness 35
Factor Analysis • • 39
Methods of Sampling 49
CHAPTER III ANALYSIS OF THE DATA 56
Lithological Composition • 56
Sphericity and Roundness within Samples
Sphericity Variations between Samples
Roundness Variations between Samples
Processes affecting Roundness
Abrasion and Breakage Indices
81
85
94
102
106
CHAPTER IV RELATIONSHIPS BETWEEN VARIABLES 110
Between Sample Correlations for Sandstone 110
Highly Significant Correlations 110
Significant Correlations 111
Probably Significant Correlations 111
Between Sample Correlations for Rhyodacite 113
• Highly Significant and Significant
Correlations 113
Probably Significant Correlations 116
Correlation of Sample Parameters between
Lithologies 118
CHAPTER V MULTIPLE CORRELATION REGRESSION • 121
Abrasion and Breakage Indices 124
Factors affecting Form and Sphericity 126
Form and Sphericity - Rhyodacite 127
Form and Sphericity - Sandstone ' 129
Results of Analysis 131
Roundness Variations 146
CHAPTER VI CONCLUSION 147
APPENDIX 153
No. Page
1 Location map of Tambo River basin 2
2 Lithological map of Tambo River basin 12 3 Change with time of elevation of low water surface
of Tamto River at Bruthen 26
4 Longitudinal profile of Tambo River 28
5 Form diagram .33
PLATES
No. Page
Vertical aerial view of Tambo River at
Swifts Creek Frontispiece •
Accelerated erosion of granite colluvium
at Bindi 10
Channel morphology of Tambo River at
Bruthen 25
TABLES
No. Page
Factor analysis of size, shape and roundness
parameters for rhyodacite sample 7 41
II
Factor analysis of size, shape and roundnessparameters for sandstone sample 7 44
III
Relationships between lithology of samplesand outcrops 59,60
IV Values of Al
r and Dir for samples of rhyodacite 66 V Values of AQt and Apo for rhyodacite, sandstone
and granite 69
VI Between sample changes in form composition 71 VII Form changes in relation to changes in outcrop 79 VIII Within sample linear correlation - roundness and
sphericity parameters 83
IX Comparison of some observed cumulative sphericity frequencies, with values expected for
normal distributions 92
X Comparison of some ,observed cumulative roundness frequencies with values expected for
normal distributions 99
XI Abrasion and breakage indices for sandstone and
No. Page XII Sandstones - between sample linear correlation
of parameters 112
XIII Rhyodacites - between sample linear correlation
of parameters 115
XIV Linear correlation of sample parameters
between lithologies 119
XV Reductions of the sums of squares of rhyodacite
form 133
XVI Reductions of the sums of squares of rhyodacite
Maximum Projection sphericity 134 XVII Reductions of the sums of squares of rhyodacite
Wadell sphericity 135
XVIII Reductions of the sums of squares of sandstone
form 140
XIX Reductions of the sums of squares of sandstone
Maximum Projection sphericity 141 XX Reductions of the sums of squares of sandstone
LIST OF SYMBOLS
A area of outcrop above a station (km2)
Al mean altitude of outcrops at a sample station (metres) number of bladed pebbles in a sample
mean Cailleux roundness of sample
distance downstream from station 1 (km)
Di mean distance from outcrops at a sample station (km) number of elongated pebbles
A F - magnitude of form change between adjacent stations (chi-square)
- mean length of intermediate axis of a sample (mm) Ka mean Kaiser roundness of sample
Ku - mean Kuenen roundness of sample Ku25 - Kuenen breakage index
Ku75 - Kuenen abrasion index
L - mean length of long axis of a sample (mm) - mean Maximum Projection sphericity of a sample - number of platy pebbles in a sample
Q -
the ratio Ck/Q 0- percentage content of a particular lithology in a sample of 200 pebbles
ra radius of curvature of sharpest corner of pebble in the • maximum projection plane
- mean length of short axis of a sample (mm) - mean pebble weight of a sample (grams)
• mean Wadell sphericity of a sample
The following additional symbols are used in conjunction with some of the above variables:
X* - actual value for an individual pebble
mean value for a particular lithology from all sample
• stations •
X
r indicates value for rhyodacite X
s - indicates value for sandstone IXI indicates modulus of value
•A X
- change in value between two adjacent stationsThe completion of this study has been made possible only by the assistance, cooperation and encouragement of many people.
The early stages of research into the bedload characteristics of the Tambo River took place while the writer was a research
scholar at the Australian National University in 1964-65 and much credit for guiding the initial ideas is due to my supervisor at the time, Dr. J.N. Jennings. Unfortunately this work could not be completed at that time due to ill health.
Subsequently some aspects of the earlier research done in the Tambo Valley were selected and further developed as
a
thesis topic for the degree of Master of Science at the University of Tasmania. The writer is very grateful for the encouragement and helpful advise given by his supervisor, Professor J.L. Davies, and, in the final stages of preparation of the thesis by Dr. E.A. Colhoun, who took over the task of supervision following the appointment of Professor Davies to a chair at Macquarie University, Sydney.Special thanks are due to Mr. N.K. Chick who was
numerous discussions concerning problems involved in the application of statistical methods;
The cooperation of several government departments of the state of Victoria is much appreciated: the Lands Department for the supply of maps, aerial photographs and survey data, the Rivers and Water Supply Commission for gauging records of the Tambo River and the Department of Mines for unpublished geological information and the providing of facilities for its transcription. I am
particularly grateful to Dr. J.A. Talent for his generous assistance in making available his specialist knowledge of the stratigraphy and geological history of the study area.
The maps and diagrams were drawn by Mr. G. van der Geer ' and Miss K. Draper and the writer also wishes to thank the former
for his advice on cartographic presentation. Acknowledgement should be made of the assistance received from the University Library
and the Photographic Department.
In the field the writer has been ably assisted by his wife who spent many hours helping with the sampling and recording of large amounts of numerical data derived from the measurement of large numbers of pebbles. The owners of the Bruthen Inn will be gratefully remembered for providing not only accommodation but also a very pleasant environment during the later stages of
ABSTRACT
The study is concerned with the parametric description of a selected size class of the gravel bedload, collected from a number of sample points, of the Tambo River in Eastern Victoria. Lithological composition of the samples is investigated and related to the lithological nature of the basin. Measurements of form, sphericity and roundness are made for samples of the two most abundant lithological types - rhyodacite and sandstone. Changes in mean values of these parameters between stations are related to operative processes, some of which can be characterized by the physical and lithological characteristics of the basin.
kdetailed description is presented of the physical environment of the catchment. Consideration is given to sampling procedures and, the selection of suitable parameters to describe • pebble morphometry. It can be shown that Wadell and Maximum
Projection sphericity are partial expressions of form. R-mode factor analysis is used to compare the relative merits of four measures of roundness, on the basis of which the Kuenen and Kaiser measures.are used for further work. Subsequently the Kuenen
nature of the basin and the composition of gravel samples are investigated using methods of analysis first introduced by Tricart in France in 1959 but apparently not previously applied in the English speaking world.
The description of the mean form of a sample requires two parameters but values of chi-square can be used as a single
parameter measuring the magnitude of change in form between two sampling stations. Changes in form, sphericity and roundness can be related to four basic processes: abrasion, shape sorting, dilution and breakage. In the case of form and sphericity it is shown that all four can be expressed in quantitative form.
,Changes in mean roundness of sandstone pebbles show a marked trend with respect to distance downstream, but no such tendency can be observed in the case of Thyodacite particles. Mean Kuenen roundness of samples can be replaced, with very little loss of information, by abrasion and breakage indices devised by the writer.
Matrices of correlation coefficients are used to
investigate relationships between variables both within and between samples and in the latter case also between the two dominant
Finally, a multiple correlation and regression model is
employed to assess quantitatively the relative importance of
different processes in producing change in form and sphericity
between samples. In the case of rhyodacite highly significant
multiple correlations are obtained and it is found that nearly all
change can be explained in terms of processes and variations in
mean sample size. In the case of sandstone the technique is
less successful but even here changes in form at least have a
significant multiple correlation with parameters representing
The Tambo River is located in East Gippsland, Victoria and at Bruthen where it emerges from the highlands, it has -a catchment area of some 1700 square kilometres (Figure 1). A few kilometres south-west of Swan Reach the river flows into Lake King which forms part of the Gippsland Lakes - a system of coastal lagoons enclosed by a series of dune barriers. The river drains part of the southern slopes of the Victorian Alps. Almost the entire basin upstream from Bruthen is characterized by very steep
slopes with, local relief, particularly in the headwaters, in many cases exceeding 600 metres. The highest peaks in
the
northern part of the basin reach heights inexcess
of 1500 metres. Flat land is virtually absent except for discontinuous stretches of floodplain and riverterraces
developed where the river passes through more erodible rocks. These stretches are interrupted by *long reaches of steep sided valley, which become gorge-like in .places-. The only other land of low relief is a restricted area ofFIGURE 1
Location map of the
Tambo River basin
N‘Gi •ZNIT.os
ow)
,§s ML Lit* Tomboy 1.10GREPJ-:'—"Tal9
The Slams,— I,,BOWert or- Crook
37'07-
Iti.°""" A
,
...
ML Gttnitm Muni4/7 •
Mt Elizoboth
/
■Ensoy North
... \
...
Mt 8oldhood •C
KKRY Emmy 'South
Mikado' imuss'—..."‘-..-N Hill ".•■
Sr,
4
Tombo Crossing
:
...Swan Rood+
• liRih.:4›.)
KILOMETRES W
Lake King
3.
exception of this small area of basalt, the basin upstream from Bruthen has developed in Palaeozoic rocks, the dominant lithologies being granites, sandstones, rhyodacites and schists. The Tambo River carries a heavy bedload and in the floodplain stretches a wide shallow lannel has developed. Rapid bank erosion and a tendency towards braiding are characteristic of this channel.
The Tambo River was originally selected for study because of its prominent bedload characteristics, the presence of well
preserved terraces in the floodplain reaches, the availability of contoured maps for at least part of the catchment and the near absence of large tributaries. Also the Tambo is parallelled for much of its length by the Omeo Highway, facilitating access. State benchmarks along this road provide convenient starting points for spot height determinations used in the construction of a longitudinal
profile of the river bed. The river has a narrow elongated basin, the only major tributary being the Tithbarra River. The only other two tributaries of any significance are the Little River and the , Haunted Stream.
quadrangles at a scale of 1:100,000 with a contour interval of 40 metres and selected 20 metre auxiliary contours. When the
thesis was nearing completion preliminary compilation became available for the Murrindal and Orbost quadrangles providing for the first
time topographic information for a narrow strip along the eastern margin of the catchment including most of the area drained by the Timbarra River. The plans are at a scale of 1:50,000 with a contour interval of 20 metres.
• The purpose of the study is to give a parametric
description of a selected size class (long axis between 32 and 64 mm) of the gravel bedload of the Tambo River by sampling at points
selected at intervals along the course of the stream. The two rock types selected for the study were rhyodacites and sandstones. The parameters obtained in this way are then related to channel
morphology and other environmental conditions. Sampling for this
purpose was combined with an assessment of the lithological composition of the gravels in the same size class at each sampling point.
Preparation of a lithological map of the basin enabled a
comparison to be made between the •ithological composition of the sample and the catchment at each sampling station using a method first proposed by Tricart (1959).
CHAPTER I
THE ENVIRONMENT
Climate
It is difficult to obtain a balanced assessment of the climatic conditions of the Tambo River drainage basin as there is a considerable contrast between the higher portions of the catchment which extend into the cool sub-alpine zone and the enclosed basins and narrow valley floors found along the course of the main stream. • Settlement and the location of climatic stations are restricted to
the latter situation. Even if this were not so the extreme relief would make generalization difficult as it introduces strong local variations depending on site and aspect. The only stations within the. basin for which long term records are available are Bindi, Ensay, • •• Tambo Crossing and Bruthen. The rainshadow effect of the mountainous
country to the west is reflected in the mean annual rainfalls of these stations which vary between 63 and 74 ans with Bindi having the
7.
There are few stations at higher elevations in the East Gippsland region and none within the Tambo drainage basin. The nearest is Omeo at an elevation of 640 metres with a mean annual precipitation of only 66 cms. Temperature and precipitation characteristics of this station are quite atypical of the
surrounding region as the Omeo Valley experiences marked foehn and rainshadow effects.. Two other stations in the vicinity of
Benambra (730 metres) and Hinno Munjie are even drier with mean annual precipitations of only 58 and 63.5 ems respectively. Mean annual precipitation at higher elevations can be approximated by accepting the estimates of Morland (1958) for the Murray River' basin that precipitation increases by about 25 cms for every 300 metres rise in altitude in the basin. • This means that mean annual 'total's of 150 to 175 cms can be expected to occur in the highest parts
of the Victorian Alps. At low elevations precipitation shows a remarkably even distribution throughout the year but with increasing altitude a
trend
towards a winter rainfall maximum becomes apparent.The mean annual temperature near sealevel is approximately 14°C while Hotham Heights (1860 metres) in the Upper Murray Region has a mean annual temperature of only 5°C indicating a normal
efficiency with altitude and this in turn is reflected in the altitudinal zonation of natural vegetation.
Snowfall also increases with altitude. Snow in the lowlands near sealevel is extremely rare. At Omeo (640 metres) snow occurs annually and has been recorded as often as 10 times in a year while over the highlands snow may occur during any month of the year and in winter Most of the precipitation is in this form. Severe blizzard conditions can occur over the exposed Alps. Most of the information on climate has been obtained from Anon. (1954) and Linforth (1969).
Vegetation and Soils
Most of the Tambo River catchment remains under forest • vegetation. Land clearing for agriculture has been restricted to
9.
Swifts Creek. The bulk of the vegetation of the area is sclerophyll forest dominated by species of Eucalyptus. At elevations of less than 500 metres the relatively low precipitation and skeletal
soils give rise to dry sclerophyll forest, the dominant species being E. globoidea. Undergrowth is often scarce due to the high frequency of fires and consists mainly of shrubs belonging to the genera Acacia, Banksia and Hakea.
At higher elevations up to 1400 metres wet sclerophyll forest is common and is dominated by the eucalypt species
E. obliqua and E. delegatensis with pockets of E. regnans on the Nunniong-Nunnett Plains where better soils and low angle slopes favour the development of a distinct vegetation. Undergrowth at higher elevations is much denser, consisting of shrubs
belonging to the genera Pomaderris, Bedfordia and others together with abundant ferns. In rainshadow areas a more open forest dominated by Callitris sp. and Eucalyptus albens is found.
Above 1400 metres sub-alpine woodland is found with Eucalyptus pauciflora, snow grass (Poa australis) and a variety of alpine shrubs. No truly alpine vegetation is to be found within the catchment under study.
PLATE 2
Accelerated erosion of granite
The combination of sandy soils and relatively steep slopes has encouraged soil erosion where land clearing has taken place.
Gully erosion is particularly severe at Tongio Gap, near Bindi and to the east of Swifts Creek (Plate 2). Except on one property
near Bindi, little or no effort has been made to control accelerated erosion.
Geology
The geology of the catchment area of the Tambo River has not. been mapped systematically with the exception of a small area around the mouth of the Tambo.which is included in the Bairnsdale geological sheet (1:63,360) published in 1960. To compile a lithological map of the area (figure 2) one has to rely on
FIGURE 2
Lithological map of the
Tambo River basin
GRANITE
RHYODACITE
BASALT
SCHIST AND SLATE
OUARTZITE AND SANDSTONE
CONGLOMERATE
LIMESTONE
SILTSTONE
QUARTZ GRAM
ALLUVIUM
DRAINAGE DIVIDE
KILOMETRES 0 5 10
13.
in 1963. Some information was also obtained from unpublished theses in the Geology Department of the University of Melbourne. The most important study was by W. Williams which included some detailed mapping of the granite complex in the Brookville - Swifts Creek -
Ensay area.
An excellent summary of the geology of East Gippsland is given by Talent (1969). While dealing mainly with the
stratigraphio sequence and geological history it also includes .small sections on landforms and geological structure. A briefer
..account of the physiography,. geology and mineral resources of the .'East Gippslnd region is given by Thomas 09549 while some
information on the geological structure of the area is found in ThoMa5. (1958). •Determination of potassium-argon ages of some of the
East-GipOsland granites by Evernden and Richards (1962) has helped to elucidate the geological history. A brief account of the
geological history of the area will be given., based largely on Talent .(1969). •
• The oldest rocks that crop out in the catchment area
occur as great thicknesses of uniform rhythmically bedded sandstones with minor slates. They are strongly folded and faulted and are • characterized by a paucity of fossils. Such fossils as have been
by graded beds, small scale cross bedding, and flute casts. Their deposition was followed by the Benambran Orogeny with the intrusion of granitic rocks in a belt extending south-east from Albury up the Kiewa River valley and from there into the study area
as
far as Ensay. Associated with this line of intrusions is an extensive belt of metamorphic rocks - mainly schists and gneisses which are considered to' equivalent in age to the unmetamorphosed Ordovician sandstones and slates.The Ordovician sediments are overlain unconformably by rocks of Silurian age. The oldest unit is the Mitta Mitta Volcanics consisting of a sequence of ignimbrites, rhyodacites, rhyolites and tuffs. This unit is difficult to distinguish from the later Snowy River Volcanics of •Devonian age except on stratigraphic grounds. All outcrops of acid and intermediate volcanic rocks in the Tambo basin have been assigned to the Snowy River Volcanics but more detailed mapping may well show that some at least represent the Mitta Mitta Volcanics. These volcanics are overlain by the Wombat Creek Group - a sequence of conglomerates interbedded with minor limestones and fine-grained terrigenous sediments. The unit has a minimum thickness of 3000 metres. Within the Tambo catchment it crops out in a series of fault slices between Bindi and the
15.
in this area where they are mapped as the Mount Waterton formation. Deposition of the Silurian sediments is followed by another orogenic phase - the Bowning Orogeny - associated with further folding and intrusion of granites. Granites south-east of Ensay, near Tambo — Crossing appear to have been intruded during this phase as well as a large area of granodiorite (Mt. Stewart Granite) in the middle and upper reaches of the Timbarra River (Evernden and Richards, 1962).
The granite is overlain uncomformably by the lower Devonian Timbarra Formation consisting of a thick sequence of non-marine conglomerates, sandstone and siltstones with a minimum
thickness of 1500 metres. The formation is found east of Buchan and extends into the drainage basin of the Timbarra River. In turn this formation is overlain by the Snowy River Volcanics consisting of more than 3000 metres of rhyodacites and tuffs. Although most extensive in the Snowy River area they occupy 7.5% of the Tambo catchment north of Bruthen and make a very significant contribution to the bedload of this river. According to Talent (1969) the next period of deposition represented by the Buchan Group was preceded by .a period of epeirogenic block faulting with planation which affected the Snowy River Volcanics and the underlying Cowombat Group.
similar sequence can be found at Bindi where it has been mapped by Talent (pers. comm.). The Buchan Group has been divided into three formations. The lowest is the Buchan Caves Limestone
consisting of grey to dark coloured fossiliferous limestones with a measured thickness at Buchan of between 260 and 280 metres. The
formation is well developed at Bindi (Gaskin, 1943) where it has an average dip of 300 to the WSW with a prominent cuesta scarp marking the eastern boundary of the outcrop. Next is the
Taravale Formation which reaches a maximum thickness of 580 metres at Buchan and consists of mudstones, shales and impure limestones. This formation also outcrops extensively at Bindi where it forms an area of subdued relief. The third formation recognized at Buchan is the Murrindal Limestone with a maximum thickness of 295 metres. It is interpreted by Teichert and Talent (1958) as a facies change stratigraphically equivalent to the upper part of the Taravale Formation. It has not been recognized in the Bindi area. On the basis of fossil content the whole of the Buchan Group is placed in the lower half of the Middle Devonian.
Deposition was terminated by the Tabberabberan Orogeny which led to deformation of the older rocks accompanied by further intrusions of granites. This tectonic phase occurred from late Middle Devonian to early Upper Devonian times.
17.
the deposition of the Mount Tambo Group containing shales and sandstones interbedded with conglomerates up to 12 metres thick. The thickness of the group is in excess of 3000 metres. It crops out in a belt extending from Mount Tambo to Mount Shanahan near Bindi. The group represents the youngest pre-Cainozoic sediments known to crop out in the Tambo River basin.
Triassic syenites and granite porphyries crop out east of Benambra and a small portion of this extends into the.Tambo River 'catchment at Mount Little Tambo, There is no further evidence for
igneous activity until sometime during the Tertiary when basalts were.extruded at a number of scattered localities. The only
significant outcrop of basalt -within the study area is a belt 16 kms long and up to.5 kms wide underlying the Nunniong - Nunnett plains. The exact age of this basalt is uncertain but what evidence there is tends to favour a mid-Tertiary age (Talent, 1969; Beavis 1962).
Deposition of alternating marine'and terrigenous deposits probably extends into the Pleistocene. The Cainozoic succession is
summarized by Talent (1969) but is not discussed in detail here because no sampling of gravel bedload was carried out south of Bruthen.
An exception must be made for the Plio-Pleistocene quartz gravels extending north-eastward from Bruthen parallel to the present course of the Tambo River. They appear to be the "torrent gravels" referred to by Talent (1969) and others and have been correlated with similar gravels (Haunted Hills Gravels) covering much of the surface of the Gippsland Basin including the area between Bruthen and the mouth of the Tambo River. The gravels to the north-east of Bruthen are clearly fluviatile in origin but are found one hundred metres and more above the present day river. The presenceof torrent gravels has been explained either as due to rapid uplift of the highlands to the north (Jenkin, 1968) or as a result of
climatic change (Talent, 1969). Talent suggested that deposition of the gravels took place across extensive piedmont areas by streams with greatly augmented flow during the Pleistocene. Whatever their origin, the Tambo is now entrenched at least 100 metres below this level. This entrenchment extends upstream almost as far as Tambo Crossing and may reflect marginal
19.
during the Pleistocene.
• Another controversial aspect of the geology of the region is the age of the Kosciusko Uplift - the main period of upward movement responsible for the extensive area of highlands in eastern Victoria and New South Wales. The age of this movement has been placed as recently as late Pliocene and even Pleistocene by some
(Jaeger and Browne, 1958; Crohn, 1950) while others (e.g. Beavis, 1962) place the beginning of the uplift as far back as early Tertiary
times with intermittent later movements.
Regional Geomorphology
In his description of the geology of East Gippsland, Talent (1969) gives a broad classification of five landform types of which three are represented in the area of study.
• (1) Mountainous tracts are defined as areas of strong relief with deeply incised valleys with accordant ridge tops common over distances of many miles. Occasional prominent
(2) Tablelands are undulating surfaces with broad valleys and low divides bevelling the high parts of the topography more or less regardless of rock type. Areas of Tertiary basalt
(e.g. the Nunniong - Nunnett tablelands) have been included in this type.
( ) Intermontane basins comprise small areas of low relief that are due to differential erosion of more easily eroded rocks. Examples from within the Tambo catchment given by Talent include the Bindi and Ensay - Swifts Creek areas.
A large proportion of the Tambo River catchment can properly be described as mountainous tract. As indicated in the introduction it is characterized by extreme local relief and very steep slopes. Talent claims the common occurrence of accordant summits over considerable distances and to test his claim all
summits for the area covered by the Bairnsdale, Bruthen and Stirling topographic sheets were plotted on an overlay, including a
considerable area to the west of the Tambo catchment drained mainly by the Nicholson River. Contouring of summits shows a gradual increase in summit heights towards the north but summit accordance is not
striking enough to suggest that they may represent portions of old dissected erosion surfaces. Another argument that can be brought • to bear against the prevailing opinion that summits represent
21.
of flat summits within the area examined. Outside this area only the Nunniong - Nunnett Plains show marked accordance of flat summits (Talent 1965) but they are more readily explained as modified
remnants of the surface of the uppermost member of the sequence of basalt flows which underlies this area.
Of considerable importance in relation to this study is the occurrence of periglacial and possibly glacial landforms and deposits in the Victorian Alps as it must be considered highly likely that much of the gravel bedload of the present day Tambo River was made available by the prevalence of mechanical weathering by
freeze and thaw, particularly at higher elevations during the cold stages of the Pleistocene.
Evidence for Pleistocene glaciation in the Victorian Alps has been brought forward by Carr and Costin (1955) who have claimed that the presence of ground moraine, asymmetrical hills, U-shaped valleys, truncated spurs and hanging tributary valleys is evidence of cirque and valley glaciation on the Bogong High Plains, Mount Bogong, Mount Hotham and Mount Feathertop. Beavis (1959) has since made a critical re-examination on the Bogong High Plains of the evidence presented by Carr and Costin and contends that their evidence is not substantiated by detailed field
on the Bogong High Plains". More recently the evidence for
glaciation of the Victorian Alps has been re-examined by Peterson (unpublished thesis, 1969) in a number of areas and his findings are essentially in agreement with those of Beavis in that no unequivocal evidence of glaciation has been found. None of the localities where the presence of glacial features has been
suggested falls within the area drained by the Tambo River and on present evidence glaciation cannot be considered as a process contributing to the gravel bedload of the river during glacial periods.
On the contrary, evidence of periglacial landforms appears to be widespread at higher elevations although little work has been done to assess their extent. Carr and Costin
(1955) briefly mention the occurrence of boulder runs (?), stone polygons and stripes from several localities particularly in association with basalt. The only detailed study of periglacial landforms is by Talent (1965) who has described blockstreams of rhyodacite boulders from Mt. Wombargo, Big Hill and the Cobberas extending down to altitudes of about 1200 metres as well as the occurrence of stone banked terraces composed of the same rock
23.
outcrop extensively at higher elevations in the headwaters of the Tambo River and pebbles derived from them form a substantial'
proportion of the gravel load of the Tambo in the size range studied.
In the Victorian Alps little information is available on the lower limit to which periglacial processes were active but on the highlands of southern New South Wales this limit is thought to be at least 1000 metres and possibly 700 metres (Galloway, 1965) while in Tasmania the limit was down to 300 metres or even lower
(Davies, 1965, 1967). Using these figures as a guide, the general level of the lower limit of periglacial processes in the past must have lain somewhere between 500 and 1000 metres. Davies (1969, pages 12-13) has stressed however that this limit may vary depending on lithology and states that "different rock types react differently to frost weathering and frost-induced mass movement - they vary in their readiness to be mobilised by frost. Because of this,
periglacial conditions may appear to have extended nearer to sea level on some rock types than on others". Much of the bedload transported by the Tambo River at present is probably derived by the reworking of colluvial aprons, fan deposits and older alluvial terraces built up under periglacial conditions. Remnants of massive gravel terraces and alluvial fans are particularly well preserved near Swifts Creek between Tongio and Doctors Flat.
accelerated by anthropogenic factors of which mining has been the most important. The late 19th century saw an upsurge of mining in the area, mainly of deposits of gold and cassiterite occurring in the form of alluvial deposits as well as some reefs and veins. Mining appears to have caused a sudden increase in the bedload of the Tambo River leading to marked aggradation in the lower reaches of the stream particularly near Bruthen where the river enters the piedmont downs (Plate 3). Daily records of gauge heights for the Tambo River at Bruthen have been kept by the
Victorian State Rivers and Water Supply Commission since September 1885 with a break in the record from 1932 to 1937. Figure 3
shows fluctuations in low water level due to aggradation from 1885 to 1961 and indicates very rapid aggradation between 1890 and 1898 causing an elevation of low water level by 3.5 metres. This period coincides with the mining boom in East Gippsland. Slow aggradation continued until the early 1920's. A photograph of a braided stretch of the Tambo River upstream from Bruthen
PLATE 3
Channel morphology of Tambo
River at Bruthen
FIGURE 3
Change with time of elevation of low
26.
_
4-
3-
0
.
c, .—
''
-
2-
-
0
27.
from hard rock mining operations - the vein quartz found in the gravel samples is probably derived from this source. The increase in load was undoubtedly further augmented by the resulting
undercutting of alluvial banks adding still further to the supply of sand and gravel bedload of the stream. The greater abundance of sand in the recent past may also have resulted in effects of abrasion different from those prevailing at present.
I
n order to determine the effect - if au,- ofvariations in gradient on the morphometry of the gravels, a long profile of the stream was constructed by using a self-reducing tacheometer to measure differences in height between a series of more or less regularly spaced bench marks along the Omeo Highway and low water level of the river. Ideally a continuous traverse should have been carried out but this was precluded by the length of channel involved (148 kms) and the difficulties of access and terrain. The long profile is shown in figure 4 where each height determination is indicated by an open circle. Tributary profiles were constructed from contour information only and must be
regarded as very approximate. The Tambo profile is almost
straight from sample station 1 down to 48 kilometres from its mouth with an average gradient of 3.2 metres per kilometre and it is only
FIGURE 4•
Longitudinal profile of
VE.= 211-2
Intalon Rd. Swan Two, 0,109* 9 teach
330—
300
230
100 .
8
6
,
7
tio 40
material becomes much more abundant below station 7 and no significant amounts of gravel bed material have been observed downstream from the Bruthen Road bridge. The gradient from here to the coast averages only 0.54 metres per kilometre. Between Tongio and Doctors Flat near the upstream end of the surveyed
reach there is a •tendency for the profile to become concave upwards once more - a characteristic which appears to be related to the
obvious reduction in size of bed material in the downstream direction in this section as observed in the field.
CHAPTER II
PARAMETRIC DESCRIPTION AND SAMPLING PROCEDURE
Choice of Parameters
The parametric description of pebble morphology in this study involves the use of two distinct groups of parameters: shape and roundness. A very extensive literature is available and some of the earlier work is referred to in Pettijohn (1956). Important contributions to the description of shape not mentioned by Pettijohn were made by Folk (1955) and Sneed and Folk (1958). Similarly
significant advances in the measurement of roundness were made by Cailleux (1945) and Kuenen (1956).
Measures of shape:
Early classifications of shape were descriptive and used such terms as prismoidal, pyramidal, wedge-shaped, etc. as approximations to regular geometrical bodies. However, it was soon realized that a numerical measure of shape was required to enable theuse of statistical methods in the comparison of samples from different populations. Provided that the particles are not too irregular in shape they can be assumed to approximate to a
triaxial ellipsoid whose three axes can be measured with vernier calipers using the method suggested by Krumbein (1941). The terminology of Sneed and Folk (1958) is followed and the longest axis of a pebble is designed L , the intermediate axis I and the shortest axis S . The intermediate axis in defined as the longest dimension at right angles to L . The plane in which both L and I lie is known as the maximum projection plane of the particle. The short axis S* is defined as the greatest dimension at right angles to the maximum projection plane and the plane in which I and S * lie is termed the minimum projection plane. All three axes are mutually perpendicular but need not pass through the same point.
32.
as a parameter. Yet the types of low sphericity shapes present • and their relative abundance can be important indicators of the processes operating in moulding particle shapes. For example it • has frequently been claimed that pebbles subjected to wave action
*tend to become discoid in shape while current action tends to produce blade- and rod-like shapes (Williams, 1965). It is not possible to describe shape adequately with one parameter. A shape parameter proposed by Williams (1965) has the advantage of
distinguishing between disc and rod-like shapes but fails to separate blades from spheroids.
An adequate description of the shape of a pebble
approximating to a triaxial ellipsoid requires two parameters. One of the earliest attempts to do this was made by Zingg (1935) who
* *
devised a classification of pebble shapes in which I /L is plotted * *
against . The possible range of values of both ratios is between.0 and 1. The diagram was subdivided to distinguish four Classes: discs, spheroids, blades and rollers. A more elaborate classification of shape was proposed by Sneed and Folk (1958) who
introduced the term "form" for a two parameter description of shape. The form of each pebble is plotted on a triangular diagram (Figure 5)
* * * * * *•
FIGURE 5
Form diagram after Sneed and
C — Compact
P — Platy
B — Bladed
E — Elongated — Very
L — Long Diameter I — Intermediate Diameter S — Short Diameter
M — Maximum Projection Sphericity
0 Platy
.67 .33
Bladed
1—I
.20
and disc. Pebbles approaching these end points are referred to respectively as compact, elongated and platy by Sneed and Folk. The authors divide the field of variation into ten classes which gives a much more equal quantitative division of pebble frequencies than the Zingg classification as well as being more suitable for detailed work.
In this study it was decided to use two measures of sphericity. Wadell sphericity (W * ) was first introduced by Wadell (1934) and modified by Krumbein (1941) for use with calipers. It has been widely used particularly in the United States. Its formula is
Maximum projection sphericity (M ) was developed by R.L. Folk in 1946 but its first introduction in the literature was in Folk
3J.
This sphericity parameter was advocated (Sneed and Folk, 1958) as a more natural measure of sphericity than the Wadell index since it had been designed to take into account the hydraulic behaviour of the particles according to Stokes' Law. Experiments by Sneed and Folk (1958) indicated that values of maximum projection sphericity
correlated much more closely with both settling velocity and rolling velocity than is the case with Wadell sphericity. In order to test the relative merits of the two parameters under field conditions it was decided to make use of both. In addition to the two sphericity measures it was decided to use Sneed and Folk's form classification to group pebbles in each sample into ten form classes (Figure 6).
Measures of roundness: Roundness is concerned with the sharpness of the edges and corners of a particle and is a parameter which should. be independent of size and shape within samples. Sedimentary
particles especially the more angular ones - may have many corners. Computation of some early'indices of roundness requires the
measurement of the radii of..curvature of all corners of the particle -- usually in a particular plane - which are then summed and averaged to give the overall roundness. Since an adequate sample must contain a large number of pebbles such a method is far too laborious. for practical use. Other methods such as the one
FIGURE
Form diagram with rhyodacite
Compact
A
A
I
L
• formof
individualpebble
AI
lik
0 Mean form for sample
Adillik
.33 .67
Platy Bladed
L-I
Elongated
L-S
Although this method allows rapid measurement of roundness an element of subjectivity is introduced. Folk (1955) studied operator error in the determination of roundness using Powers' roundness images as a standard and found it to be considerable.
An improved index was proposed by Cailleux (1945) who suggested measuring only the sharpest corner in the maximum projection plane. To determine the radius of curvature of this corner he placed the particle on a chart on which a series of
concentric rings were drawn with the radii indicated in millimeters. The particle was placed with the maximum projection plane parallel to the chart and moved across until the sharpest corner fitted one of the curves. The radius of curvature (ra) was then read
directly from the chart ("Cible morphoscopique"). The Cailleux roundness is calculated using the formula
- 2ra
38.
of the Cailleux index. Rod-like shapes tend to roll with the L-axis horizontal and at right angles to the current direction. Under these conditions continued abrasion can be expected to cause a progressive decrease in the Cailleux index. Therefore the
index is likely to be least satisfactory where particles are highly rounded and where the proportion of rod-like particles in the
sample population is high. To remedy these shortcomings Kuenen suggested a new roundness index which is calculated using the formula
Ku = 2ra
At an early stage in the present study it was decided to Use both indices. to,test their relative merits. Subsequently, however the writer became aware of another index proposed by Kaiser (1956) in an obscure publication but referred to by Blenk (1960) . who gives the formula
Ka = 4ra L +I
It was thought that factor analysis would be a useful tool to assess the relative merits of the three indices proposed. The ideal
completely independent of both size and shape within a sample
because roundness variations between samples can then be considered solely as a function of environmental factors and sampling error.
Factor Analysis: Factor analysis is a generic term for a variety of techniques that attempt to describe complex relationships among many variables in terms of simpler relationships among fewer variables (Spencer 1966) and can be carried out by two distinct but related procedures known as R-mode (factor) and Q-mode (factor) analysis. The procedure relevant to our problem is R-mode which attempts to describe a large number of variables in terms of a smaller number of independent variables or factors explaining between them nearly all the observed variation. In other words a large number of variables which are in part measuring the same thing is reduced to the smallest possible number of independent sources of variation. The technique is discussed in detail in Rummel (1967), Harman (1960) ; Cole and King (1968) and Krumbein and Graybill (1965).
Briefly the procedure has as its starting point a data matrix of n x N spaces where N is the number of individuals and n the number of variables. From sample location 7, a sample of 150 pebbles within the size range (32 mm < L < 64 mm) was
40.
rhyodacites and sandstones and the following eight variables were recorded for each pebble: weight, long axis, intermediate axis, short axis, radius of curvature of sharpest corner in maximum projection plane and the three roundness indices of Cailleux,
Kuenen and Kaiser. This gave a data matrix of 8 x 150 for each of the two rock types considered. Factor analysis was then applied using an existing programme written by Dr. Christopher Gee formerly of the Geology Department at the University of Tasmania.
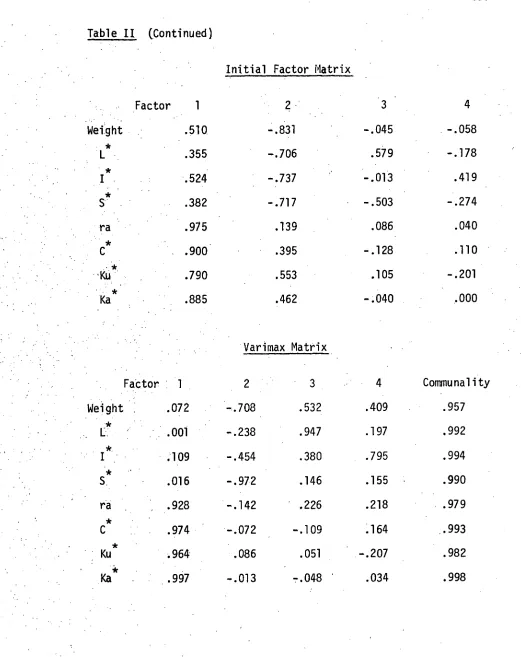
The first step in factor analysis is the conversion of the data matrix to standard form to make the total variance of the matrix equal to n. It is then converted to a correlation matrix of n x n spaces (tables I and II). For any variable in standard form we can write the linear expression Zj = ail F, + ai2F2 + ...
ajmFm + a.U. where the coefficients aJ J l ,a2,...,aj are known as factor loadings. The factors involved in more than one
Table I - Factor analysis of size, shape and roundness parameters for rhyodacite sample 7. (Values rounded off to three decimal places.)
•Weight
ra
•Ku Ka
Weight L* .771 Correlation Matrix C* .240 .056 .345' .917 Ku* .127 .098 .100 .062 .854 •.909 Ka* .204 .076 .262 .141 .915 .987 .962 I* .833 .680 S* .827 .521 .620 ra .511 .342
Average correlation coefficient .598. Number of samples 150. Significant factor loading .049.
Table of Eigenvalues
Factor Eigenvalue % Explanation Cumulative %
1 4.476 55.945 • 55.945
2 • 2.559 • 31.988 • 87.933
• 3 .512 6.398 • 94.331
4 .350 4.369 98.701
-.646 - -..664 -.619 .510 .604 ' Weight * Ka." *
C .969 ti. 091 .071
Ku .980 .003 .098 .994 -.061 .007
Table Continued)
Initial Factor Matrix
Varimax Matrix
3 -.709 -.513 .045 -.310 -.919 .179 ,-.421 -.391
•
.071 -.961 -.193 • ra .891 -.188 -.277
Factor,
42.
3 4
.075 • -.035
-.468 -.250
-.083 .425
.508 -.193
-.099 .038
.092 .127
-.052 -.224
.041 -.004
4 Communal ity
.407 .950
.224 .993
.794 .993
.151 • .988
.283 .987
.204 .995
-.145 .992
Variance from Varimax Matrix
% Explanation
46.77
21.83
17.36
12.73
.Factor
,(Continued
Cumulative %
46.77
68.60
85.97
44.
_Table II• Factor analysis of size, shape and roundness parameters
for sandstone sample 7. (Values rounded off to
three decimal places.)
Correlation Matrix
C*
.849 .809 .367 .125
.626 ..408 .293 -.048
.625- .226
.224
.925
Ku* -Ka*
-.037 .070
-.020 -.034
..073 .125
-.098 .027
.835 .919'
.886 .985
.951 I*
s*
ra:Average ,correlation coefficient .551. Number of samples. 150.
Significant, factor loading .056.
Table of Eigenvalues
factor Eigenvalue % Explanation Cumulative %
3.976 49.695 49.695
2 2.942 36.769 86.464
. 3 .627 7.843 94.307
4 .340 4.250 98.557
Table II
(Continued)Initial Factor Matrix
Factor 1 2 3 4
Weight .510 -.831 -.045 -.058
*
L .355 -.706 .579 -.178
*
I •.524 -.737 -.013 .419
*
S .382 -.717 -.503 -.274
ra .975 .139 .086 .040
*
C .900 0 .395 -.128 .110
Ku* .790 .553 .105 -.201
*
Ka .885 .462 -.040 .000
Varimax Matrix
Factor 1 2 3 4 Communality
Weight .072 -.708 .532 .409 .957
*
L .001 -.238 .947 .197 .992
*
I .109 -.454 .380 .795 .994
*
S .016 -.972 .146 .155 .990
ra .928 -.142 .226 .218 .979
*
C .974 -.072 -.109 .164 .993
*
Ku .964 .086 .051 -.207 .982
*
% Explanation
Cumulative %
46.89 • 46.89
21.76 68.64
17.66 86.30
12.26 98.56
[image:72.542.9.533.33.699.2]Factor
1 2 3Table II
Continued46.
The process of extraction of factors is best understood in terms of a geometric model (Rummel, 1967) in which individuals are presented as axes at right angles to one another forming a framework within which each parameter can be represented as a vector. The space used in the analysis of factors relating to more than three individuals is multi-dimensional space, also known as hyperspace or vector space.
The correlation matrix factor analysis produces first of all the unrotated or initial factor matrix where projection of the vectors on each of the axes gives factor loadings for each factor for each variable. In this matrix the first factor defines the largest pattern of relationships in the data, the second the next largest pattern and so on. A disadvantage of the initial factor matrix is that it groups unrelated clusters. This matrix can be used to compute a table of eigenvalues for each factor with the percentage and cumulative percentage of the variance explained by each factor. The eigenvalue of a factor is the amount of the variance in standard form explained by that factor.
48.
particularly well suited to the problem as it is specifically designed to isolate uncorrelated cluster patterns. Thus from a suitably arranged data matrix containing information on the size, shape and roundness characteristics of a sample of pebbles,
orthogonal rotation should, after varimax rotation, extract a roundness factor which is independent of both size and shape. This factor can be identified from the varimax matrices (tables I and II) which represent the factor loadings for each factor in
respect of each variable. The loadings measure which variables are involved in which factor pattern and to what degree and can be
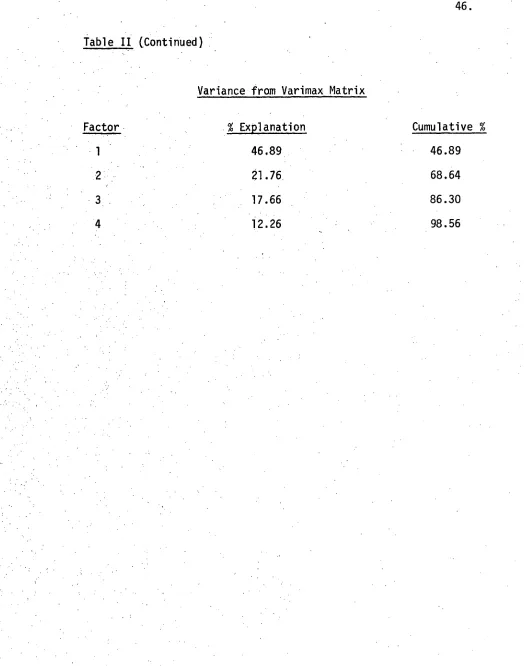
interpreted like correlation coefficients (Rummel, 1967). It follows that the roundness factor can be identified as factor 1 in the tables by its high loadings on roundness indices and low loadings on
variables measuring size and shape. The higher the loading for a particular index the less dependent it is on other factors.
Cailleux and Kuenen Indices are intermediate with 93.99 and 96.08% explanation respectively. The sandstone sample shows a similar pattern. As a result of the assessment of roundness measures using factor analysis further work was limited to the use of the Kaiser and Kuenen Indices shown to be the least dependent on both size and shape.
Methods of sampling
The sampling procedures had to satisfy a number of requirements. As the study was originally designed to enable comparison to be made between present bed material and fossil• gravels in river terraces the methods used had to be as nearly similar as possible to those that could be used to sample fossil outcrops in road cuttings, gravel quarries and river banks.
The characteristics of the bedload gravels selected for investigation were:
Lithological composition. The method selected basically followed the pioneer study in this field by Tricart (1959) which despite its original approach seems to have made
50.
(ii) Form. (or shape) was investigated using the form classif- ication first proposed by Sneed and Folk (1958).
(iii) Sphericity. The two parameters selected for use were Wadell sphericity (Wadell, 1934) and Maximum Projection Sphericity (Sneed and Folk, 1958).
Roundness. The original selection of roundness parameters for the study consisted of the Cailleux and Kuenen indices. However, at
a
later stagethe
writer became aware of the existence of the Kaiser index and of the possibility of using factor analysis to assess the extent to which roundness indices were influenced by factors related to size and shape. Following factor analysis the Cailleux index was replaced by the Kaiser index.Since parameters measuring all four characteristics listed above may in part be a function of particle size, sampling ought
to be restricted to as narrow a size range as possible but in practice
class used by Sneed and Folk (1958) in their study of pebbles in the Colorado River. It must be pointed out that even in this narrow range Sneed and Folk found that particle size had
a
great effect on sphericity and form. However, practical considerations require the use of the same size class. In any case the Tambo River may well behave in an entirely different way to the Colorado.It may also be argued that weight is a more satisfactory criterion of size than long axis measurements and that size
selection on the basis of weight will be more satisfactory. While •this is probably true it creates practical problems when collecting
in the field. However the correlation matrices produced for
samples of rhyodacites and sandstones from station 7 (tables I and II) show that the intermediate axis correlates more highly with the weight of a pebble than either the long or the short axis and some slight advantage may be gained in future studies by the use of a size class based on measurements of the intermediate axis.
PLATE 4
Gravel point bar with slip face
52.
53.
driven in and a circle one metre in diameter set out. Working from the centre outwards two hundred pebbles within the required size limits were collected and identification of lithological content was made on the spot. Only in one case (sample 1) was it found necessary to go outside the sample circle for a sufficient number of pebbles.
The rock types selected for measurement of form, sphericity and roundness had to be sufficiently abundant at all sample sites to enable collection of a large sample in a reasonable time and only two - rhyodacites and sandstones - met this requirement. Ideally the selected lithologies should be unaffected by chemical weathering in the study area and both were satisfactory in this respect.
Slight weathering out of quartz and feldspar phenocrysts was observed in some rhyodacite pebbles at stations 8 and 9 but this was not
sufficiently marked to affect their morphometry. A desirable
characteristic of any rock type selected for measurement would also be that it is as isotropic as possible, i.e. it should not show preferred orientation of weaknesses which tend to control form and , sphericity to such an extent that the influences of the
The rhyodacite and sandstone pebbles obtained in the lithological sample were added to until 150 pebbles of each
lithology were obtained. This sample size was considered sufficiently large for the purpose of this study following extensive reading of the literature dealing with aspects of particle morphometry. In
* *
the case of each pebble the three axes (L , I and S ) and the radius of curvature (ra) of the sharpest corner in the maximum projection plane were measured. Axial measurements were made to the nearest 0.1 mm using a pair of calipers with vernier scale. As mentioned earlier Cailleux's "cible morphoscdpique" was used to measure ra. All sphericity and roundness indices were multiplied by 1000 to facilitate computation and representation of -
information. This conforms with common practice by European
workers and enables easy comparison to be made with their results.
The original plan included sampling of the larger tributaries of the Tambo but, with one exception, this did not prove practical because not sufficient bedload material in the selected size class could be found. The Timbarra River for example has had its gradient steepened above its junction with the Tambo and for several miles upstream it flows in a narrow deeply incised bedrock channel containing little or no bed material. The
55.
composition was determined and measurements made on a sample of sandstone pebbles.
In order to process the 11,400 items of numerical information obtained in this way a computer programme was written with the
assistance of Mr. N. Chick. This produced for each sample the distribution of the pebbles in the ten form classes. For the
Kaiser and Kuenen roundness indices, as well as the Wadell and Maximum Projection sphericities, the mean, standard deviation, skewness, kurtosis and frequency distribution of twenty classes are calculated. Finally the programme also computed correlation coefficients and regression lines between all possible combinations of the four parameters of roundness and sphericity within each sample (Appendix). The computer processed information forms the . *basis for the later discussion of relationships both within and
CHAPTER III
ANALYSIS OF THE DATA
Lithological composition.
The iithological composition of each of the nine samples collected along the Tambo River is illustrated in figure 7. It can readily be seen that the composition of the bedload within the size range studied is dominated by two lithologies: rhyodacites and sandstones. Others form only a minor component including granites which nevertheless crop out over large areas. The deficiency in granite content appears to be due to the observed rapid granular disintegration of granite pebbles present in the bed material. The percentage of rhyodacite pebbles •decreases markedly downstream from the Timbarra. River junction (between
stations 6 and 7) and reflects the more.limited extent of outcrops of this rock in the Timbarra catchment.
FIGURE 7
57.
80 -
EN 1 1
1
16
/'
1=1
11
1111
t
.4 60U 40 -
a.
P4 V
1111111110
20 -
Sandstone
Vein quartz Miscellaneous Granite
Rhyodacite
10 20 30 40 50 60 70 80
90 100 110 120 130 140 150 160
58.
samples to outcrop patterns a lithological map of the whole of the Tambo catchment was compiled (figure 2.) and all information
available up to 1968 included. Unfortunately the patchy nature and variable quality of geological mapping in the area, as outlined in Chapter I renders the investigation of relationships between areas of outcrop and gravel composition less rewarding than might otherwise have been the case.
The approach used is similar to that used by Tricart (1959) for a number of rivers in France. For each rock type within each sample, Q , - the percentage content in a particular
sample - has been calculated. Similarly at each sample point and for each lithology, Q 0 - the percentage area of the catchment over which a particular lithology crops out - was also computed. Q is the ratio Cy% and is a parameter first suggested by
Cailleux as giving an indication of the yield of material from a particular lithology, within the size.class examined, in relation to other rock types. A value greater than 1 indicates.an above average yield, a value of less than one a below average yield
Table III
Relationships between lithology of samples and outcrops
Sample No.
Granites Rhyodacites Sandstones, quartzites
Limestones
Q
Q
Q R,
Qo
Q
QR, Q0.Q
1. 9.5 25.75 0.37 22.5 20.56 1.10 52.5 27.02 1.94 - 2.05 - 2 7.0 27.32 0.25 38.5 11.63 3.31 40.0 27.19 1.47 - 1.15 - 3 ' 12.5 32.28 0.39 38.0 8.72 4.36 36.0 25.76 1.40 - 0.87 _ 4 20.0 33.29 0.61 30.0 7.55 3.97 36.5 28.39 1.29 - 0.73 - 5 7.0 28.02 0.25 39.5 8.07 4.90 44.5 40.00 1.11 - 0.62 - 6 8.5 27.45 0.31 38.5 8.14 4.74 46.5 41.40 1.12 - 0.59 - 7 4.5 29.95 0.15 23.0 8.07 2.86 62.5 41.75 1.50 - 0.44 - 8 3.0 29.20 0.13 24.5 7.87 3.11 60.0 43.30 1.39 - 0.43 - 9 4.0 29.34 0.14 20.5 7.49 2.74 64.0 44.40 1.44 - 0.41 -
Table III (Continued)
Relationships between lithology of samples and outcrops
Sample No.
Basalts Vein quartz
Schists, slates
Siltstones
Q
ZQ
0 QQ.
Q
oQ
iQ
0Q
Q
0Q
1 - 0.80 - 8.5 C' • - 7.0 8.61 0.81 - 15.21 - 2 1.0 0.45 2.22 8.0 C, •- 5.5 23.66 0.23 - 8.60 - 3 1.0 0.34 2.94 7.5 - 5.0 25.58 0.20 - 6.45 - 4 - 0.31 - 6.5 Cs-
• - 7.0 23.75 0.29 - 5.93 -
5 - 0.24 - 7.0 C.- • - 2.0 18.46 0.11 - 4.58 -
6 0.23 - 5.0 C, • - 1.5 17.74 0.08 - 4.40 -
7 3.5 1.49 2.35 3.0 - 3.5 14.13 0.25 - 4.21 - 8 2.5 1.45 1.72 7.0 -3.0 13.80 0.22 - 4.10 9 - 1.38 - 8.0 - 3.5 13.12 0.27 3.90 -
Q 2.31 - 0.26
[image:88.540.20.487.65.699.2]Values of
Q
can not be determined for limestones and siltstones because no pebbles from any of the samples can beidentified as belonging to either of these lithologies. Therefore no values can be calculated for Q. For basalts Qt can not be determined for five samples because no basalt pebbles are present and the value of
Q
represents the mean of the values of Q of the four remaining samples. The first reason for the absence ofpebbles belonging to these rock types appears to be the relatively small areas of outcrop within the basin, particularly of limestones and basalts. The second reason is that Pebbles of limestones and siltstones are rapidly removed during transport - the latter are prone to rapid disintegration and the former are attacked by solution processes and are also subject to rapid abrasion on account of
their. low hardness.
In the case of vein quartz it is not practicable to determine areas of outcrop and this problem has been discussed at length by Tricart (1959). Vein quartz is probably most
common in the granitic rocks but also occurs in other rock types. Even if areas of outcrop could be calculated the value of