Can we improve the statistical analysis of stroke trials? Statistical re-analysis
of functional outcomes in stroke trials.
The Optimising Analysis of Stroke Trials (OAST) Collaboration
Division of Stroke Medicine, University of Nottingham, Nottingham, UK; Medical
Statistics Unit, London School of Hygiene and Tropical Medicine, London, UK
Correspondence and requests for reprints to:
Professor Philip Bath
Division of Stroke Medicine
University of Nottingham
D Floor, South Block
Queen’s Medical Centre
Nottingham NG7 2UH UK
Tel: +44 115 8231023
Fax: +44 115 8231022
ACKNOWLEDGEMENTS
Secretariat and writing committee: Philip MW Bath (chief investigator, Nottingham,
UK); Laura J Gray (lead statistician, Nottingham, UK); Timothy Collier (statistical
advisor, London, UK); Stuart Pocock (statistical advisor, London, UK). We declare no
conflicts of interest.
Statistical advisor: James Carpenter (Medical Statistics Unit, London School of
Hygiene and Tropical Medicine, London, UK)
The following contributors provided individual patient data from their trial, and
commented on the draft manuscript:
Abciximab: H Adams (USA), K Dougherty (USA); W Hacke (Germany),
ASK: G Donnan (Australia)
ASSIST 07 & 10: S Davis (Australia)
ATLANTIS A & B: G Albers, S Hamilton (USA)
BEST Pilot & Main: D Barer (UK)
Citicoline 1, 7, 10, 18: A Davalos (Spain)
Corr: S Corr (UK)
Dover Stroke Unit: P Langhorne (UK)
DCLHb: P Koudstaal, R Saxena (Netherlands)
Ebselen: T Yamaguchi (Japan)
ECASS II: W Hacke, E Bluhmki (Germany)
Factor VII: S Mayer (USA), K Begtrup (Denmark)
FISS: R Kay (Hong Kong)
FOOD 3: M Dennis (UK)
Gilbertson: L Gilbertson (UK)
IST: P Sandercock (UK)
Kuopio Stroke Unit: J Sivenius (Finland)
Logan: P Logan (UK)
MAST-I: L Candelise (Italy), J Wardlaw (UK)
Newcastle Stroke Unit: H Rodgers (UK)
NINDS: J Marler (USA)
Parker: C Parker (UK)
Nottingham Stroke Unit: N Lincoln, P Berman (UK)
RANNTAS I & II, STIPAS, TESS I & II: P Bath (UK), B Musch (USA)
Walker 1 & 2: M Walker (UK)
Young: J Young, A Forster (UK)
We thank the patients who took part in these studies, and the trialists who shared
their data. The study was conceived, initiated, managed, analysed, and interpreted
independently of any pharmaceutical company. Each collaborator listed above
commented on the draft manuscript.
FUNDING
LJG is funded, in part, by BUPA Foundation and The Stroke Association (UK). PB is
Stroke Association Professor of Stroke Medicine. The funding sources had no
TITLE PAGE
Full title: Can we improve the statistical analysis of stroke trials?
Cover title: Can we improve the statistical analysis of stroke trials?
Table 1: Comparison of rank scores for 16 statistical tests
Figure 1: Distribution in Modified Rankin Scale in the ECASS II trial showing the
primary and post hoc analyses
Figure 2: Identification of included trials
Figure 3: Percentage of trials significant at the 5% level with each statistical test
Keywords: stroke; randomised controlled trial; statistical analysis
ABSTRACT
Background
Most large acute stroke trials have been neutral. Functional outcome is usually
analysed using a yes or no answer, e.g. death or dependency vs. independence. We
assessed which statistical approaches are most efficient in analysing outcomes from
stroke trials.
Methods
Individual patient data from acute, rehabilitation and stroke unit trials studying the
effects of interventions which alter functional outcome were assessed. Outcomes
included modified Rankin Scale, Barthel Index, and ‘3 questions’. Data were analysed
using a variety of approaches which compare two treatment groups. The results for
each statistical test for each trial were then compared.
Results
Data from 55 datasets were obtained (47 trials, 54,173 patients). The test results
differed substantially so that approaches which use the ordered nature of functional
outcome data (ordinal logistic regression, t-test, robust ranks test, bootstrapping the
difference in mean rank) were more efficient statistically than those which collapse
the data into 2 groups (chi square) (ANOVA p<0.001). The findings were consistent
across different types and sizes of trial and for the different measures of functional
Conclusions
When analysing functional outcome from stroke trials, statistical tests which use the
original ordered data are more efficient and more likely to yield reliable results.
BACKGROUND
The management of patients with acute or recent stroke has benefited significantly
from the results of randomised controlled trials and meta-analyses of these. For
example, functional outcome is improved with alteplase, aspirin, management in a
Stroke Unit, and community occupational therapy.
1-7In contrast, some studies were
overtly negative finding that treatment worsened outcome, e.g. DCLHb, enlimomab,
selfotel, or tirilazad.
8-11However, the majority of acute stroke trials were neutral in
spite of positive preclinical findings. The failure of these latter studies can be
attributed to multiple causes, including the relevance of laboratory findings to clinical
stroke,
12inadequate sample size,
13choice of primary outcome, and its statistical
analysis.
Measures of functional outcome such as the modified Rankin Scale (mRS)
14, Barthel
Index (BI)
15and ‘3-questions’’
16are ordinal in nature, that is, they consist of 3 or
more categories which have a natural ordering, e.g. the mRS has 7 categories ranging
from no symptoms to dead. It might then be expected that statistical analysis would
preserve and utilise the data in this ordinal form. However, most published trials have
used a ‘yes/no’ (dichotomised) analysis of functional outcome, e.g. combining
categories within the mRS into two groups, such as ‘dead or dependent’ (e.g. mRS
3-6) and ‘independent’ (mRS 0-2), and then comparing these between the treatment
groups. Unfortunately, there is little agreement where mRS data should be divided:
i.e. 0,1 vs. 2-6,
10-2 vs. 3-6,
17or 0-3 vs. 4-6,
18and whether this matters.
19Further,
collapsing data in this way generally lowers statistical power and therefore reduces
the chance of finding a significant treatment effect since information from many
mRS of 3 rather than 4 or 0 rather than 1 are not detected in a analysis comparing
mRS 0-2 with 3-6.
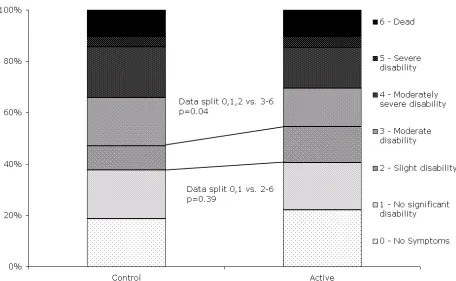
Inadequacies in the statistical analysis of trials in acute stroke are apparent in two
examples. First, the ECASS II trial of alteplase showed no treatment effect for its
primary outcome (when comparing mRS 0,1 with mRS 2-6) but was positive when
re-analysed using the data collapsed in a different place (mRS 0-2 vs. 3-6)
20or when
analysed using a ‘bootstrapping’ technique (figure 1).
21Second, five trials of tirilazad
individually showed no treatment effect when analysed using dichotomous outcomes
22-24
although a meta-analysis found that the intervention was associated with a worse
outcome;
25post hoc analysis then suggested that one of these trials was negative
24(not neutral) when analysed using a method which preserved the original ordered
data (P Bath, unpublished data).
We aimed to identify which statistical methods might optimise the analysis of data
METHODS
Identification of trials
We sought individual patient data from randomised controlled trials assessing
functional outcome after stroke for interventions which were either positive or
negative according to the trial publication, or were included in a meta analysis
showing benefit or harm; neutral trials in a neutral meta-analysis were excluded.
Published studies (full paper or abstract) fulfilling these criteria were identified from
electronic searches of the Cochrane Library (to end of 2005). In each case, we invited
the chief investigator to join the collaboration and share their data. In some cases
where individual data could not be obtained it was possible to extract it from the
original publication.
Trial data
Demographic (age, gender), trial (setting, intervention, length of follow up, result),
patient severity, and functional outcome (BI, mRS, ‘3 question’ scale [3Q, a derivative
of mRS], or another measure) data were collected for each trial. In factorial trials or
those having more than two treatment groups, data were analysed for each
comparison of active therapy versus control. Where outcome data were scored at
several time points (e.g. 1, 3 and 6 months) the time point used for the primary
outcome was included.
Statistical tests
We compared different statistical tests for assessing treatment effect. Some of these
required the data to be collapsed into groups (such as the chi square test) while
data in different places, e.g. mRS 0,1 vs. 2-6, 0-2 vs. 3-6 and 0-5 vs. 6. A description
of the statistical tests used is given in
http://www.nottingham.ac.uk/stroke-medicine/oast/oastappendix1.doc.
Comparison of statistical tests
Each data set was analysed using each statistical test. These results were then
ordered within each trial and given a rank, with the lowest rank given to the test
which produced the most significant result, i.e. the largest z score, within that trial. A
two-way analysis of variance test was then used to see on average which statistical
test had produced the lowest ranks. We were then able to order the statistical tests in
terms of their efficiency in identifying treatment effects. We also assessed how many
statistically significant (at 5%) results each test found.
To assess the validity and reliability of the results, a number of supplementary
analyses were carried out. First, the comparison of statistical tests was repeated
within sub-groups of trials sharing similar characteristics; second, the statistical
assumptions of the tests were assessed; and last, the sensitivity of the tests was
explored to make sure treatment effects were only detected when they truly existed
(the type one error rate). Technical details of these supplementary analyses can be
found in http://www.nottingham.ac.uk/stroke-medicine/oast/oastappendix2.doc.
Analyses were carried out in SAS (version 8.2) and Stata (version 7) and significance
RESULTS
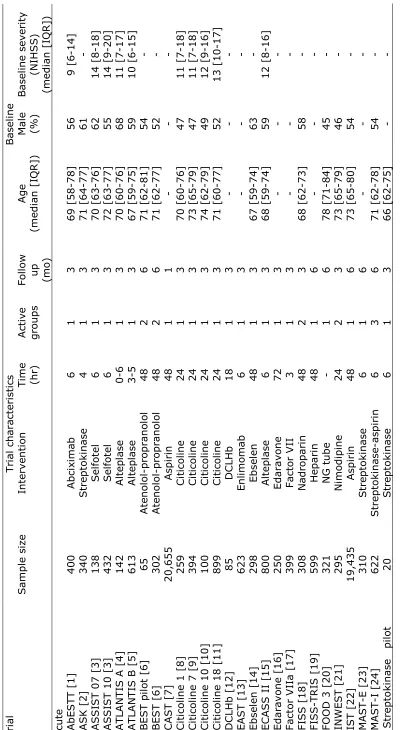
Trials characteristics
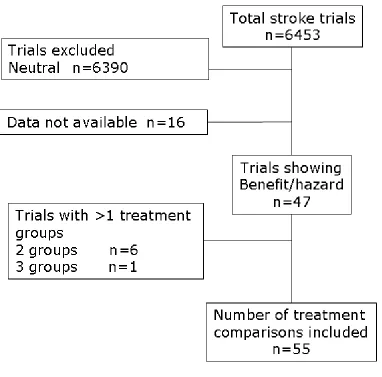
A total of 55 comparisons of active versus control treatment (54,173 patients) were
included, these comprising individual patient data from 38 trials and summary data
extracted from the publications of a further 9 studies; six trials had two active
treatment groups, and one had three active groups so a further 8 comparisons were
available (figure 2). The data related to 34 acute stroke trials, 7 trials of rehabilitation
(1,164 patients) and 6 trials of stroke units (1,399 patients). BI was used to measure
functional outcome in 22 trials, 18 used the mRS, 3 used the 3Q scale, 1 used the
Rivermead scale, 2 related trials used the Nottingham ADL scale, and 1 trial used its
own ordinal measure.
26Included trials studied the following interventions: abciximab
(AbESTT); alteplase (ATLANTIS A & B, ECASS II, NINDS); aspirin (CAST, IST);
atenolol (BEST); citicoline; DCLHb; ebselen; edaravone; enlimomab (EAST); factor
VIIa; feeding (FOOD 3); nadroparin (FISS, FISS-TRIS); nimodipine (INWEST);
occupational therapy (Corr, Gilbertson, Logan, TOTAL, Walker); physiotherapy
(Young); pro-urokinase (PROACT II); selfotel (ASSIST); streptokinase (ASK, MAST-E,
MAST-I); stroke unit (Dover, Helsinki, Kuopio, Nottingham, Orpington, Newcastle);
and tirilazad (RANTTAS I & II, STIPAS, TESS I & II). Data relating to 16 trials or
interventions which fulfilled the inclusion criteria were not made available.
The method of analysing functional outcome used in the original trial publication
varied considerably, see
http://www.nottingham.ac.uk/stroke-medicine/oast/oastappendix3.doc. 23 (48.9%) trials assessed the treatment effect
using a method which required the data to be collapsed into groups, e.g. chi-square
which compared means; the remaining trials were unpublished so the method of
analysis is not known.
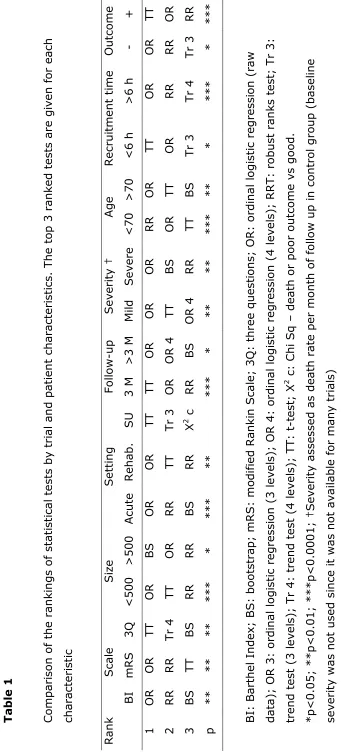
Comparison of statistical tests
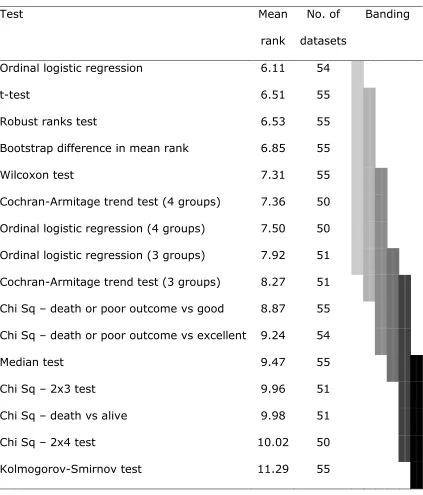
The statistical tests assessed differed significantly in the results they gave for each
trial (2 way ANOVA p<0.0001). The ordering of the tests showed that those which
analyse the original ordinal data generally perform better than those which collapse
the data into 2 or more groups. The most efficient tests included ordinal logistic
regression, t-test, robust rank test and bootstrapping the difference in mean rank
(table 1). The sub group analysis showed the same ordering of tests irrespective of
type of intervention (acute, rehabilitation, stroke unit), trial size, time between
randomisation and onset, patient age, baseline severity, outcome measure, length of
follow up, and trial result
(http://www.nottingham.ac.uk/stroke-medicine/oast/oastappendix4.doc).
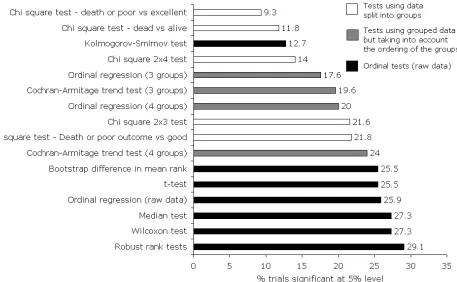
When assessed by how many trials were statistically significant, those tests which did
not collapse the data into groups again out-performed the other approaches; for
example, ordinal logistic regression (using raw data) gave a statistically significant
result in 25.9% of trials whereas the 2x2 chi-square test comparing death or poor
outcome to an excellent outcome only gave a significant result in 9.3% of the trials
(figure 3).
Test assumptions and sensitivity
The statistical assumptions of the t-test were not met for the majority of trials and the
assumptions of the ordinal logistic regression analysis failed for 8 out of the 55 data
sets; in contrast, the assumptions for the other tests were maintained. The sensitivity
statistically significant treatment effects were only found where they truly existed; see
http://www.nottingham.ac.uk/stroke-medicine/oast/oastappendix5.doc for detailed
DISCUSSION
These results show that statistical approaches which analyse the original ordinal data
for functional outcome are more efficient than those which work on pre-processed
data which has been collapsed into 2 or more groups. Interestingly, this point was
originally demonstrated mathematically by Shannon in 1948
27. In particular, ordinal
logistic regression, t-test, robust ranks test, and bootstrapping (the difference in
mean rank) performed well and appear to be useful irrespective of the type of stroke
trial, patient or intervention. Although individual tests based on dichotomised data
using Chi-square analysis (e.g. ‘dead/dependent’ versus ‘independent’) were effective
for some data sets, they performed poorly in many and therefore cannot be
recommended as general solutions for analysing stroke trials. From an historical
perspective, it is quite possible that trials which collapsed mRS or BI in two groups
may have used a sub-optimal analysis, and this may have contributed to false neutral
findings in some cases in the past. For example, MAST-E
28and STIPAS
24were
neutral as reported using dichotomous analysis but negative when assessed with
ordinal approaches.
Several comments can be made about this study. First, it aimed to include data from
all stroke trials assessing a beneficial or harmful intervention. Unfortunately, data
were not made available for all identified trials; where possible, we created individual
data from publications which provided patient numbers by outcome score. Data were
missing for a variety of trial types (acute/rehabilitation/stroke unit) and sizes, and
functional outcome measure (mRS/BI), so it is unlikely that a systematic bias was
introduced into the findings; however, the precision of the results may have been
attenuated by the missing trials. Second, we did not exhaustively search for all
instead, we focussed on those approaches which are available in standard statistical
textbooks and computer packages. Additionally, we could not include some tests used
in recent trials, e.g. patient specific outcomes
29and Cochran Mantel Haenszel test
30since these require access to individual data for both baseline and outcome variables,
and these data were not available uniformly. Third, some of the statistical
assumptions underlying the more efficient tests were not met in all trials; for
example, the t test assumes data are normally distributed while ordinal logistic
regression assumes that any treatment effect is similar across outcome levels
(‘proportionality of odds’, i.e. the odds of moving a treated patient from mRS 2 to 1 is
similar to that for moving them from 5 to 4). Nevertheless, the robustness of these
tests to deviations from their underlying assumptions means that they remain
relevant for analysing functional outcome data from stroke trials.
If alternative approaches to analysing functional outcome data are to be used in the
future, it is pertinent to ask how sample size should be calculated at the trial design
stage. Historically, most calculations assumed that functional outcome would be
dichotomised and analysed using a Chi-square test approach.
13Although future trials
could continue to calculate sample size in the same way (and then gain extra power
by analysing their data using an ordinal approach), specific sample size calculations
are available when data are to be analysed using ordinal logistic regression
31or the
t-test. Ideally, the extra power gained by using an ordinal statistical approach should
not be used to reduce sample size; stroke trials have been too small in the past, as
shown in a recent meta analysis,
13and this may also have contributed to the failure of
some of them.
results of dichotomous tests may be summarised easily as the proportion of patients
who benefit (or suffer) with a treatment, i.e. alteplase reduced absolute death or
dependency (mRS>1) by 13% in the NINDS part 2 trial.
1In contrast, ordinal tests will
need to be presented as the average absolute improvement in outcome, e.g. alteplase
improved the mRS by 1 (of 7) point and BI by 22.5 (of 100) points. Alternatively, the
combined odds ratio and its confidence intervals would be reported if ordinal logistic
regression was used. In this respect, health consumers will need to decide what
differences in mRS and BI are worthwhile, both clinically and in terms of health
economics. In reality, it is reasonable to present the effect on functional outcome
using both absolute percentage change and mean or median change in functional
outcome score, and show this data graphically (as in figure 1).
In summary, we suggest that ongoing and future trials should consider using
statistical approaches which utilise the original ordered categorical data in the primary
analysis of functional outcome measures. Such ordinal tests include ordinal logistic
regression, and the robust ranks test; the t-test may also be used although its
REFERENCES
1.
The National Institute of Neurological Disorders and Stroke rt-PA Stroke Study Group.
Tissue plasminogen activator for acute stroke.
New England Journal of Medicine
.
1995;333:1581-1587
2.
CAST (Chinese Acute Stroke Trial) Collaborative Group. Cast: Randomised
placebo-controlled trial of early aspirin use in 20,000 patients with acute ischaemic stroke.
Lancet
.
1997;349:1641-1649
3.
Walker M, Gladman J, Lincoln N, Siemonsma P, Whiteley T, 1996. Occupational therapy
for stroke patients not admitted to hospital: A randomised controlled trial.
The Lancet
.
1999;354:278-280
4.
Chen ZM, Sandercock P, Pan HC, Counsell C, Collins R, Liu LS, Xie JX, Warlow C, Peto
R, On behalf of the CAST and IST Collaborative Groups. Indications for early aspirin use in
acute ischemic stroke - a combined analysis of 40 000 randomized patients from the chinese
acute stroke trial and the international stroke trial.
Stroke
. 2000;31:1240-1249
5.
Stroke Unit Trialists' Collaboration. Organised inpatient (stroke unit) care for stroke.
The
cochrane library
. Oxford: Update Software; 2002.
6.
The ATLANTIS ECASS and NINDS rt-PA Study Group Investigators. Association of
outcome with early stroke treatment: Pooled analysis of atlantis, ecass, and ninds rt-pa
stroke trials.
The Lancet
. 2004;363:768-813
7.
Walker MF, Leonardi-Bee J, Bath P, Langhorne P, Corr S, Drummond A, Gilbertson L,
Gladman JRF, Jongbloed L, Parker C. An individual patient data meta-analysis of
randomised controlled trials of community occupational therapy for stroke patients.
Stroke
.
2004;35:2226-2232
8.
Saxena R, Wijnhoud AD, Carton H, Hacke W, Kaste M, Przybelski RJ, Stern KN,
Koudstaal PJ. Controlled safety study of a hemoglobin-based oxygen carrier, dclhb, in acute
ischemic stroke.
Stroke
. 1999;30:993-996
9.
Davis SM, Lees KR, Albers GW, Diener HC, Markabi S, Karlsson G, Norris J, for the
ASSIST Investigators. Selfotel in acute ischemic stroke. Possible neurotoxic effects of an
nmda antagonist.
Stroke
. 2000;31:347-354
10.
Enlimomab acute stroke trial investigators. Use of anti-icam-1 therapy in ischemic stroke:
Results of the enlimomab acute stroke trial.
Neurology
. 2001;57:1428-1434
11.
Bath PMW, Blecic S, Bogousslavsky J, Boysen G, Davis S, Diez-Tejedor E, Ferro JM,
Gommans J, Hacke W, Indredavik B, Norrving B, Orgogozo JM, Ringelstein EB, Sacchetti
ML, Idddenden R, Bath FJ, Musch BC, Brosse DM, Naberhuis-Stehouwer SA. Tirilazad
mesylate in acute ischemic stroke - a systematic review.
Stroke
. 2000;31:2257-2265
12.
Grotta J. Why do all drugs work in animals but none in stroke patients? 2 neuroprotective
therapy.
Journal of Internal Medicine
. 1995;237:89-94
13.
Weaver CS, Leonardi-Bee J, Bath-Hexall FJ, Bath PMW. Sample size calculations in acute
stroke trials: A systematic review of their reporting, characteristics, and relationship with
outcome.
Stroke
. 2004;35:1216-1224
14.
Rankin J. Cerebral vascular accidents in patients over the age of 60. 2. Prognosis.
Scottish
Medical Journal
. 1957;2:200-215
15.
Mahoney FI, Barthel DW. Functional evaluation: The barthel index.
Maryland State
Medical Journal
. 1965:61-65
16.
Lindley RI, Waddell F, Livingstone M, Sandercock P, Dennis MS, Slattery J, Smith B,
Warlow C. Can simple questions assess outcome after stroke?
Cerebrovascular Diseases
.
1994;4:314-324
17.
Bath P, Lindenstrom E, Boysen G, De Deyn P, Friis P, Leys D, Marttila R, Olsson J-E,
18.
Horn J, deHaan R, Vermeulen M, Limburg M. Very early nimodipine use in stroke (venus).
A randomised, double-blind, placebo-controlled trial.
Stroke
. 2001;32:461-465
19.
Wardlaw J, Sandercock P, Warlow C, Lindley RI. Trials of thrombolysis in acute ischemic
stroke. Does the choice of primary outcome measure really matter?
Stroke
.
2000;31:1133-1135
20.
Hacke W, Markku K, Fieschi C, von Kummer R, Davalos A, Meier D, Larrue V, Bluhmki
E, Davis S, Donnan G, Schneider D, Diez-Tejedor E, Trouillas P. Randomised double-blind
placebo-controlled trial of thrombolytic therapy with intravenous alteplase in acute
ischaemic stroke (ecass ii).
Lancet
. 1998;352:1245-1251
21.
Stingele R, Bluhmki E, Hacke W. Bootstrap statistics of ecass ii data: Just another post hoc
analysis of a negative stroke trial?
Cerebrovascular Diseases
. 2001;11:30-33
22.
Haley EC. High-dose tirilazad for acute stroke (ranttas ii).
Stroke
. 1998;29:1256-1257
23.
The RANTTAS Investigators. A randomized trial of tirilazad mesylate in patients with acute
stroke (ranttas).
Stroke
. 1996;27:1453-1458
24.
The STIPAS Investigators. Safety study of tirilazad mesylate in patients with acute ischemic
stroke (stipas).
Stroke
. 1994;25:418-423
25.
The Tirilazad International Steering Committee. Tirilazad for acute ischaemic stroke
(cochrane review). Oxford: Update Software; 2002.
26.
Barer DH, Cruickshank JM, Ebrahim SB, Mitchell JR. Low dose beta blockade in acute
stroke ("Best" Trial): An evaluation.
British Medical Journal
. 1988;296:737-741
27.
Shannon CE. A mathematical therory of communication.
The Bell System Technical
Journal.
1948; 27:379-423.
28.
The Multicenter Acute Stroke Trial - Europe Study Group. Thrombolytic therapy with
Streptokinase in acute ischemic stroke.
The New England Journal of Medicine.
1996;
335(3): 145-149.
29.
Adams HP, Leclerc JR, Bluhmki E, Clarke WR, Hansen MD, Hacke W. Measuring
outcomes as a function of baseline severity of ischemic stroke.
Cerebrovascular Diseases
.
2004;18:124-129
30.
Lees KR, Zivin JA, Ashwood T, Davalos A, Davis SM, Diener H-C, Grotta J, Lyden P,
Shuaib A, Hardernark H-G, Wasiewski WW, For the Stroke-Acute Ischemic NXY
Treatment (SAINT I) Trial Investigators. Nxy-059 for acute ischemic stroke.
New England
Journal of Medicine
. 2006;354:588-600
31.
Whitehead J. Sample-size calculations for ordered categorical-data
Statistics in Medicine
.
[image:19.595.57.480.184.679.2]
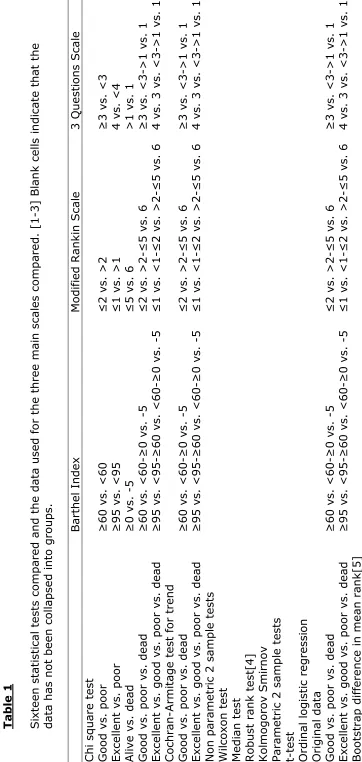
(20)Table 1. Comparison of rank scores for 16 statistical tests; lower ranks imply the test
is more efficient. Analysis by two-way ANOVA and Duncan’s multiple comparison
procedure; tests joined by the same band are not significantly different from each
other at p<0.05.
Test
Mean
rank
No. of
datasets
Banding
Ordinal logistic regression
6.11
54
t-test
6.51
55
Robust ranks test
6.53
55
Bootstrap difference in mean rank
6.85
55
Wilcoxon test
7.31
55
Cochran-Armitage trend test (4 groups)
7.36
50
Ordinal logistic regression (4 groups)
7.50
50
Ordinal logistic regression (3 groups)
7.92
51
Cochran-Armitage trend test (3 groups)
8.27
51
Chi Sq – death or poor outcome vs good
8.87
55
Chi Sq – death or poor outcome vs excellent 9.24
54
Median test
9.47
55
Chi Sq – 2x3 test
9.96
51
Chi Sq – death vs alive
9.98
51
Chi Sq – 2x4 test
10.02
50
FIGURE LEGENDS
Figure 1
Distribution in Modified Rankin Scale in the ECASS II trial showing the
primary and post hoc analyses
20Figure 2
Identification of included trials
Figure 3
[image:21.595.110.566.183.464.2]
(22)Figure 1
Distribution in Modified Rankin Scale in the ECASS II trial showing the
[image:22.595.110.492.169.546.2]
(23)Figure 2
[image:23.595.111.568.156.438.2]
(24)Figure 3
APPENDICES
OAST Appendix 1
Statistical tests compared
OAST Appendix 2
Supplementary analyses
OAST Appendix 3:
Trial data
OAST Appendix 4
Results
OAST Appendix 1: Statistical tests compared
Included tests
Univariate statistical approaches for analysing dichotomous and ordinal
data comprised tests based on Chi-square, ordinal, and bootstrap
approaches.[1-3] Sixteen statistical approaches were assessed: (i)
Chi-square 2x2 test - death or poor outcome vs. good outcome (BI <60 vs.
60-100, mRS 3-6 vs. 0-2, 3Q 1/2 vs. 3/4); (ii) Chi-square 2x2 test -
death or poor outcome vs. excellent outcome (BI <95 vs. 95/100, mRS
2-6 vs. 0/1, 3Q 1-3 vs. 4); (iii) Chi-square 2x2 test - death vs. alive; (iv)
Chi-square 2x3 test (unordered data) - death vs. poor vs. good outcome;
(v) Chi-square 2x4 test (unordered data) - death vs. poor outcome vs.
good outcome vs. excellent outcome; (vi) Cochran-Armitage trend test
(ordered data with 3 levels) - death vs. poor vs. good outcome); (vii)
Cochran-Armitage trend test (ordered data with 4 levels) - death vs. poor
vs. good vs. excellent outcome); (viii) ordinal logistic regression (raw
data); (ix) ordinal logistic regression (3 levels) (x) ordinal logistic
regression (4 levels); (xi) median test; (xii) Wilcoxon/Mann-Whitney U
test (adjusted for ties); (xiii) robust ranks test (RRT [4]); (xiv)
Kolmogorov-Smirnov test; (xv) t-test (unpooled variances); (xvi)
bootstrap of difference in mean rank (with 3x3000 cycles [5, 6]).
Chi-square tests were performed without continuity correction since most
trials enrolled more than 100 patients.
Excluded tests
Three non-parametric tests were excluded: Wald-Wolfowitz runs test;
Siegel-Tukey test; and the Cramer-von Mises two-sample test, on
Statistical detail for non-standard tests
Robust rank test
The Robust rank test is an alternative to the Wilcoxon test, it tests
whether the median of one group is equal to another, but unlike the
Wilcoxon test it does not assume that the distributions of the two groups
are equal, i.e. it makes no assumptions about the variance of the two
groups. [3, 4]
Bootstrapping
Bootstrapping is a computationally intensive method which involves
resampling data from a given sample. The main advantage of
bootstrapping over more traditional methods is that it does not make
assumptions about the distribution of the data. In this report we bootstrap
the difference in mean rank; the procedure for doing this is outlined
below: [5]
1.
Take a dataset, which contains N observations
2.
Draw a sample with replacement of size N (using replacement
means that some of the original observations may appear in the
new sample more than once and some not at all)
3.
Estimate the parameter of interest (here the difference in mean
rank) and store the result
4.
Repeat 2 and 3 many times, here we use 3 sets of 3,000 as used in
the ECASS II trial [6]
5.
Compare the distribution of the stored results to the actual point
Ordinal logistic regression
Ordinal logistic regression can be used when the dependent variable is
ordered categorical. It is similar to logistic regression but it simultaneously
estimates multiple endpoints instead of just one. The number of endpoints
it estimates is equivalent to the number of ordered categories minus one.
For example if the mRS was the dependent variable of interest it would
compare the following j categories:
0
vs.
1,2,3,4,5,6
0,1
vs.
2,3,4,5,6
0,1,2
vs.
3,4,5,6
0,1,2,3
vs.
4,5,6
0,1,2,3,4
vs.
5,6
0,1,2,3,4,5
vs.
6
Ordinal logistic regression provides one overall estimate for each covariate
in the model and not one for each cut point. This assumes that the overall
odds ratio is constant no matter which cut is taken. So, for example the
odds ratio for the treatment effect would be interpreted as the odds of
being in category j or above for all choices of j comparing treatment 1 to
2
4
S
u
p
p
le
m
e
n
ta
r
y
t
a
b
le
s
T
a
b
le
1
S
ix
te
e
n
s
ta
ti
s
ti
c
a
l
te
s
ts
c
o
m
p
a
re
d
a
n
d
t
h
e
d
a
ta
u
s
e
d
f
o
r
th
e
t
h
re
e
m
a
in
s
c
a
le
s
c
o
m
p
a
re
d
.
[1
-3
]
B
la
n
k
c
e
ll
s
i
n
d
ic
a
te
t
h
a
t
th
e
d
a
ta
h
a
s
n
o
t
b
e
e
n
c
o
ll
a
p
s
e
d
i
n
to
g
ro
u
p
s
.
B
a
rt
h
e
l
In
d
e
x
M
o
d
if
ie
d
R
a
n
k
in
S
c
a
le
3
Q
u
e
s
ti
o
n
s
S
c
a
le
q
u
a
re
t
e
s
t
d
v
s
.
p
o
o
r
≥
6
0
v
s
.
<
6
0
≤
2
v
s
.
>
2
≥
3
v
s
.
<
3
ll
e
n
t
v
s
.
p
o
o
r
≥
9
5
v
s
.
<
9
5
≤
1
v
s
.
>
1
4
v
s
.
<
4
v
s
.
d
e
a
d
≥
0
v
s
.
-5
≤
5
v
s
.
6
>
1
v
s
.
1
d
v
s
.
p
o
o
r
v
s
.
d
e
a
d
≥
6
0
v
s
.
<
6
0
-≥
0
v
s
.
-5
≤
2
v
s
.
>
2
-≤
5
v
s
.
6
≥
3
v
s
.
<
3
->
1
v
s
.
1
ll
e
n
t
v
s
.
g
o
o
d
v
s
.
p
o
o
r
v
s
.
d
e
a
d
≥
9
5
v
s
.
<
9
5
-≥
6
0
v
s
.
<
6
0
-≥
0
v
s
.
-5
≤
1
v
s
.
<
1
-≤
2
v
s
.
>
2
-≤
5
v
s
.
6
4
v
s
.
3
v
s
.
<
3
->
1
v
s
.
1
ra
n
-A
rm
it
a
g
e
t
e
s
t
fo
r
tr
e
n
d
d
v
s
.
p
o
o
r
v
s
.
d
e
a
d
≥
6
0
v
s
.
<
6
0
-≥
0
v
s
.
-5
≤
2
v
s
.
>
2
-≤
5
v
s
.
6
≥
3
v
s
.
<
3
->
1
v
s
.
1
ll
e
n
t
v
s
.
g
o
o
d
v
s
.
p
o
o
r
v
s
.
d
e
a
d
≥
9
5
v
s
.
<
9
5
-≥
6
0
v
s
.
<
6
0
-≥
0
v
s
.
-5
≤
1
v
s
.
<
1
-≤
2
v
s
.
>
2
-≤
5
v
s
.
6
4
v
s
.
3
v
s
.
<
3
->
1
v
s
.
1
p
a
ra
m
e
tr
ic
2
s
a
m
p
le
t
e
s
ts
o
x
o
n
t
e
s
t
ia
n
t
e
s
t
s
t
ra
n
k
t
e
s
t[
4
]
o
g
o
ro
v
S
m
ir
n
o
v
m
e
tr
ic
2
s
a
m
p
le
t
e
s
ts
t
a
l
[image:28.595.116.478.41.803.2]References
1.
Altman, D.G., Practical statistics for medical research. 1991, London: Chapman
& Hall.
2.
Conover, W.J., Practical nonparametric statistics. 2nd ed. 1971, New York: John
Wiley & Sons.
3.
Siegel, S. and N.J. Castellan, Nonparametric statistics for the behavioral
sciences. 2 ed. 1988, Singapore: McGraw-Hill. 1-399.
4.
Fligner, M.A. and G.E. Policello, Robust Rank procedures for the Behrens-Fisher
problem. Journal of the American Statistics Association, 1981. 76: p. 162-168.
5.
Efron, B. and R.J. Tibshirani, An introduction to the Bootstrap. 1 ed.
Monographs on Statistics and Applied Probability, ed. D.R. Cox, et al. Vol. 57.
1993, New York: Chapman & Hall. 1-436.
6.
Stingele, R., E. Bluhmki, and W. Hacke, Bootstrap statistics of ECASS II data:
just another post hoc analysis of a negative stroke trial? Cerebrovascular
Diseases, 2001. 11: p. 30-33.
7.
Agresti, A., Modelling ordered categorical data: Recent advances and future
OAST Appendix 2: Supplementary analyses
Supplementary analyses
Sub group analysis
Sub group analyses were performed by assessing the efficiency of the different tests
for differing trial characteristics: type of intervention (acute drug treatment,
rehabilitation, stroke unit); trial size (<500, >500 participants); time between
randomisation and stroke onset (<6, >6 hours); patient age (median <70, >70
years); baseline severity (control group death rate adjusted for length of follow up,
<median (0.05) ,>median); outcome measure (BI, mRS, 3Q); length of follow up (<3
months, >3 months); and trial result (positive, negative).
Statistical assumptions
The principal statistical assumptions underlying the tests which performed well were
assessed to ensure that their use was appropriate for stroke trial data. Assumptions
included: ordinal logistic regression - proportionality of odds across response
categories (i.e. the magnitude of improvement or hazard, with a treatment, would be
similar irrespective of baseline severity, age etc); t-test – normal distribution of
outcome scores (the use of the unpooled t-test means that homogeneity of variances
between the treatment groups was not a necessary assumption); robust ranks test –
independence of treatment groups.[1, 2]
Type 1 error rate
It is conceivable that an overly sensitive statistical test might find significance in a
trial when no real difference existed, a type 1 error. We assessed the type I error rate
for the three most efficient statistical tests, using data from three representative trials
including one of the three measures of functional outcome (BI: RANTTAS,[3] mRS:
NINDS,[4] 3Q: IST [5]). From these we generated 1000 data sets, using random
sampling with replacement, in which any treatment difference could have occurred
only by chance. Tests maintaining adherence to the nominal type I error rate would
expect to see a significant result in around 50 of the 1000 data sets.
References
1.
Altman, D.G., Practical statistics for medical research. 1991, London: Chapman
2.
Siegel, S. and N.J. Castellan, Nonparametric statistics for the behavioral
sciences. 2 ed. 1988, Singapore: McGraw-Hill. 1-399.
3.
The RANTTAS Investigators, A randomized trial of tirilazad mesylate in patients
with acute stroke (RANTTAS). Stroke, 1996. 27: p. 1453-1458.
4.
The National Institute of Neurological Disorders and Stroke rt-PA Stroke Study
Group, Tissue plasminogen activator for acute stroke. New England Journal of
Medicine, 1995. 333: p. 1581-1587.
5.
International Stroke Trial Collaborative Group, The International Stroke Trial
[image:32.595.141.544.48.778.2]
(33)(34)(35)(36)3
2
9
5
]
tr
o
k
e
u
n
it
D
o
v
e
r
-
4
[
2
-6
]
-
1
4
.3
m
R
S
C
C
o
m
p
a
ri
s
o
n
o
f
a
v
e
ra
g
e
s
c
o
re
0
H
e
ls
in
k
i
-
2
[
1
-5
]
1
.8
m
R
S
O
M
a
n
n
W
h
it
n
e
y
U
t
e
s
t
+
K
u
o
p
io
-
-
-
1
.6
T
ri
a
l
s
p
e
c
if
ic
A
D
L
C
A
N
C
O
V
A
+
N
o
tt
in
g
h
a
m
7
5
[
4
5
-9
0
]
-
-
2
.9
B
I
O
W
il
c
o
x
o
n
t
e
s
t
+
O
rp
in
g
to
n
-
2
[
1
-4
]
-
1
.3
m
R
S
D
C
h
i
s
q
u
a
re
t
e
s
t
(m
R
S
>
*
)
+
N
e
w
c
a
s
tl
e
3
0
[
1
5
-5
0
]
-
-
6
B
I
O
W
il
c
o
x
o
n
t
e
s
t
0
:
D
ic
h
o
to
m
is
e
d
o
r
d
a
ta
c
o
ll
a
p
s
e
d
i
n
to
m
u
lt
ip
le
g
ro
u
p
s
;
O
:
O
rd
in
a
l
m
e
th
o
d
;
C
:
C
o
n
ti
n
u
o
u
s
m
e
th
o
d
:
B
e
n
e
fi
c
ia
l
in
te
rv
e
n
ti
o
n
e
ff
e
c
t;
-:
H
a
rm
fu
l
in
te
rv
e
n
ti
o
n
e
ff
e
c
t;
0
:
N
o
i
n
te
rv
e
n
ti
o
n
e
ff
e
c
t
b
u
t
p
a
rt
o
f
p
o
s
it
iv
e
o
r
n
e
g
a
ti
v
e
m
e
ta
n
a
ly
s
3
3
e
d
t
r
ia
ls
a
b
le
d
a
ta
:
a
p
ti
g
a
n
e
l,
D
a
y
h
o
s
p
it
a
l,
D
IA
S
,
E
C
A
S
S
I
,
G
ly
c
in
e
,
H
y
p
e
rb
a
ri
c
o
x
y
g
e
n
,
L
U
B
-I
N
T
-9
,
N
o
rw
e
g
ia
n
,
O
rp
in
g
to
n
(
1
9
9
3
&
R
o
n
n
in
g
,
S
u
lt
e
r
a
n
d
G
o
te
b
e
rg
s
tr
o
k
e
u
n
it
t
ri
a
ls
P
RO
A
C
T
I
,
S
T
A
T
,
Z
K
2
0
0
7
7
5
3
7
T
A
p
p
e
n
d
ix
4
:
R
e
s
u
lt
s
le
1
p
a
ri
s
o
n
o
f
th
e
r
a
n
k
in
g
s
o
f
s
ta
ti
s
ti
c
a
l
te
s
ts
b
y
t
ri
a
l
a
n
d
p
a
ti
e
n
t
c
h
a
ra
c
te
ri
s
ti
c
s
.
T
h
e
t
o
p
3
r
a
n
k
e
d
t
e
s
ts
a
re
g
iv
e
n
f
o
r
e
a
c
h
c
te
ri
s
ti
c
S
c
a
le
S
iz
e
S
e
tt
in
g
F
o
ll
o
w
-u
p
S
e
v
e
ri
ty
†
A
g
e
R
e
c
ru
it
m
e
n
t
ti
m
e
O
u
tc
o
m
e
I
m
RS
3
Q
<
5
0
0
>
5
0
0
A
c
u
te
Re
h
a
b
.
S
U
3
M
>
3
M
M
il
d
S
e
v
e
re
<
7
0
>
7
0
<
6
h
>
6
h
-
+
R
O
R
T
T
O
R
B
S
O
R
O
R
T
T
T
T
O
R
O
R
O
R
R
R
O
R
T
T
O
R
O
R
T
T
R
RR
T
r
4
T
T
O
R
RR
T
T
T
r
3
O
R
O
R
4
T
T
B
S
O
R
T
T
O
R
R
R
R
R
O
R
S
T
T
B
S
RR
RR
B
S
RR
X
2
c
RR
B
S
O
R
4
R
R
T
T
B
S
T
r
3
T
r
4
T
r
3
R
R
*
*
*
*
*
*
*
*
*
*
*
*
*
*
*
*
*
*
*
*
*
*
*
*
*
*
*
*
*
*
*
*
*
*
*
a
rt
h
e
l
In
d
e
x
;
B
S
:
b
o
o
ts
tr
a
p
;
m
RS
:
m
o
d
if
ie
d
Ra
n
k
in
S
c
a
le
;
3
Q
:
th
re
e
q
u
e
s
ti
o
n
s
;
O
R
:
o
rd
in
a
l
lo
g
is
ti
c
r
e
g
re
s
s
io
n
(
ra
w
);
O
R
3
:
o
rd
in
a
l
lo
g
is
ti
c
r
e
g
re
s
s
io
n
(
3
l
e
v
e
ls
);
O
R
4
:
o
rd
in
a
l
lo
g
is
ti
c
r
e
g
re
s
s
io
n
(
4
l
e
v
e
ls
);
R
R
T
:
ro
b
u
s
t
ra
n
k
s
t
e
s
t;
T
r
3
:
d
t
e
s
t
(3
l
e
v
e
ls
);
T
r
4
:
tr
e
n
d
t
e
s
t
(4
l
e
v
e
ls
);
T
T
:
t-te
s
t;
X
2