ISSN Online: 2165-3925 ISSN Print: 2165-3917
DOI: 10.4236/ojapps.2017.79034 Sep. 28, 2017 458 Open Journal of Applied Sciences
Optimization of Electrocoagulation Process for
the Removal of Binary Dye Mixtures Using
Response Surface Methodology and Estimation
of Operating Cost
Abdul Rauf Shah, Hajira Tahir, Hafiz Muhammad Kifayat Ullah, Asma Adnan
Department of Chemistry, University of Karachi, Karachi, Pakistan
Abstract
The study was useful for the treatment of Reactive red 223 (R223) and Coo-massie brilliant blue R250 (CBBR250) binary dye system by electrocoagulation process (EC). Moreover, the Al and Fe electrode were used as an anode and cathode, respectively. The response surface methodology (RSM) was adopted by utilizing central composite design to plan the experimental runs. The EC process was preceded under the effect of operating parameters including pH, NaCl, voltage and electrolysis time. The % color and COD removals were examined as response variables. The removal efficiency of RR223 and CBBR250 dye at optimum values was 89% and 94% and COD removal was 100%. The kinetic study was performed to determine the rate and rate con-stant. First and second order kinetic models were studied to figure out the ex-act mechanism of the dye removal using EC process. The estimated cost of the experimental design about 4.486 US$/dm3 was also determined. This study
showed that EC process is an economical way for the treatment of waste wa-ter.
Keywords
Electrocaogulation, Central Composite Design, Kinetic Study, FTIR, Color, COD
1. Introduction
The water bodies are being contaminated due to industrial and domestic dis-charges. To protect water reservoirs and living organism from life threatening diseases, various treatment methods were designed [1]. Dye is also considered as
How to cite this paper: Shah, A.R., Tahir, H., Ullah, H.M.K. and Adnan, A. (2017) Optimization of Electrocoagulation Process for the Removal of Binary Dye Mixtures Using Response Surface Methodology and Estimation of Operating Cost. Open Jour-nal of Applied Sciences, 7, 458-484.
https://doi.org/10.4236/ojapps.2017.79034
Received: July 18, 2017 Accepted: September 25, 2017 Published: September 28, 2017
Copyright © 2017 by authors and Scientific Research Publishing Inc. This work is licensed under the Creative Commons Attribution International License (CC BY 4.0).
DOI: 10.4236/ojapps.2017.79034 459 Open Journal of Applied Sciences
a major pollutant to pollute water. Additionally, they are of great concern owing to massive worldwide production of dye stuffs. There are over 100,000 commer-cially accessible dyes with an assessable annual production over 7 × 10⁵ tons of
dye-stuff [2]. These discharges from various industries have metals, salts, color-ing substances, total phosphate, dissolved solids and total suspended solids (TSS)
[3]. Conversely, it decreases the light penetration in water bodies to bioaquatic ecosystem and increases COD demand [4]. Moreover, they adversely affect on the concentration of dissolved gases in giant water bodies [5]. Textile effluent has carcinogenic compounds: textile discharge contains high color, pH ranges about (2 - 12), high organic and low biodegradability [6]. Biological treatment is not successful to treat textile waste due to toxicity for living organism; they can-not survive in such aqueous environment [7]. Electrocoagulation has several ad-vantages over the other treatment process [8]. Moreover, in this method, metal hydroxide is generated that coagulates pollutants by charge neutralization, surface complexation and adsorption methods. Mostly, Fe and Al electrodes are utilized to produce metal hydroxides. They are effectively utilized for the treatment of indus-trial discharges from tannery [9], textile [10], bio-digester [11] etc. Moreover, the EC process involves several phenomena including discharge of gases, anodic dissolution, cathodic reduction like hydrogen gas evolution, coagulation, natural process migration, and adsorption. Simultaneous evolution of hydrogen gas within the electrodes promotes the flotation process [12]. The metallic sludge obtained by EC is compact compared with those engendered by chemical process. The sludge that is formed as a result of electrocoagulation process also removes dye from solution by adsorption process. The general metal anode oxi-dation reaction can be expressed as:
( )s ( )aq
M →Mn+ +ne− (1)
Metal ions are able to neutralize the dissolved pollutants and additionally the electrolysis of water occurs at the cathode and anode respectively:
( ) ( ) ( )
2 l aq 2 g
2H O →4H+ +O +4e−
(2)
( ) ( ) ( )
2 l 2 g aq
2H O +2e−→H +2OH−
(3)
Moreover, the anodic metal ions form hydroxide which depends on the pH of the EC system. The metal cations and hydroxide ions form various poly hydrox-ides of the metal ions, and sweep to coagulation.
( )aq ( )aq
(
)
( )sMn OH M OH
n
n
+ + − → (4)
The consistency of the EC process is found on the basis of power consump-tion at industrial scale [13]. Moreover, they have advantage due to fast tendency of color removal and low cost compared to other classical treatment methods
sta-DOI:10.4236/ojapps.2017.79034 460 Open Journal of Applied Sciences
tistical tool for the optimization of operational parameters for chemical process both at laboratory and industrial scale [15]. The present study focuses on impact of different operational parameters on color and COD removal from binary dye system. It can be employed for the treatment of waste water by designing a reac-tor at the waste stream by inserting only Fe, Al.
2. Materials and Methods
2.1. Materials and Instruments
The binary dye system was prepared by dissolving Reactive red 223 and Com-passion brilliant blue R250 in deionized water. The structure of both of them is shown in Table 1. The absorbance was measured by T80 UV/VIS Spectrometer. The digital DC power supply (Yaxun 1502DD; 15 V, 2 A) was used to perform EC experiments. The pH was measured by (Portable pH/EC/TDS/Temperature HANNA, H19811-5). A 78HW-1 serial constant-temperature magnetic pug mill stirrer was used to perform agitation of the solution during EC process. The glass EC reactor was designed having 500 mL capacity. The Al anode and Fe ca-thode were used to perform EC experiments. Whereas FTIR model NICOLET 67,000 was used to study the structural variation in dyes after the process.
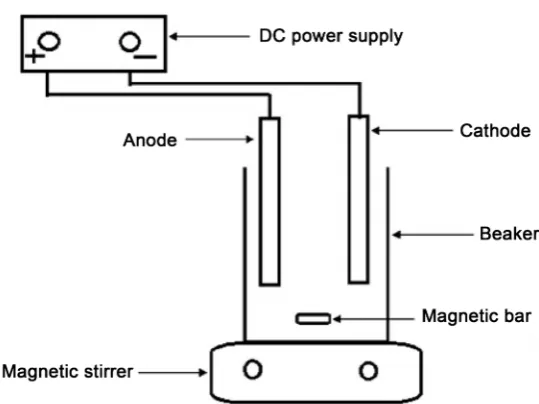
2.2. Electrocoagulation Setup
[image:3.595.207.531.510.747.2]The EC setup is given in Figure 1. The removal of binary dye system was carried out. The reactor consists of Al and Fe electrodes that are immersed in 500 ml of dye content. The initial pH of system was measured by multiple (Portable pH/EC/TDS/Temperature HANNA, H19811-5). The electrodes are connected to a DC power supply. The distance between them were kept constant throughout the experiment. The samples were ejected at different time intervals and ana-lyzed to note their absorbance. Moreover all the experimental runs were
Table 1. Reactive red 223 and Coomassie Brilliant Blue R250 dyes characteristics.
C.I Chemical formula Molecular mass (g/mol) Structure
RR223 C29H21ClN8Na4O17S5 1041.26
DOI: 10.4236/ojapps.2017.79034 461 Open Journal of Applied Sciences Figure 1. Schematic view of electrochemical batch reactor.
performed at constant temperature. After each run electrodes were washed by H2SO4
(0.1 M) and EC reactor was cleaned by HCl (0.1 M). After each experimental run, samples were analyzed by determining its dye removal tendency and COD values.
2.3. Determination of Removal Efficiencies
The removal efficiencies of dyes were calculated as:
%color removal efficiency o t 100
o
X X
X
− ×
= (5)
where Xo– the [dye]initial and Xt–values [dye]final concentration in EC system
af-ter a certain EC time (t).
2.4. The COD Measurements
The COD test is an indicator of organic component in waste water. They were pd by Standard Methods for Examination of Water and Wastewater (APHA, 1992) [16]. It is estimated as:
[
]
[
]
[
initial]
initial tCOD COD
100 COD
%COD Removal= − × (6)
where [COD]initial and [COD]t in EC process after a definite EC time period (t).
2.5. pH, Conductance and TDS measurements
The pH, conductance and TDS were measured by (Portable pH/EC/TDS/Temperature HANNA, H19811-5). The pH and conductivity were adjusted to a desirable val-ue using NaOH, H2SO4, and electrolyte (NaCl) respectively.
2.6. Calibration Curves
DOI:10.4236/ojapps.2017.79034 462 Open Journal of Applied Sciences
2.7. Central Composite Design for Dyes Removal
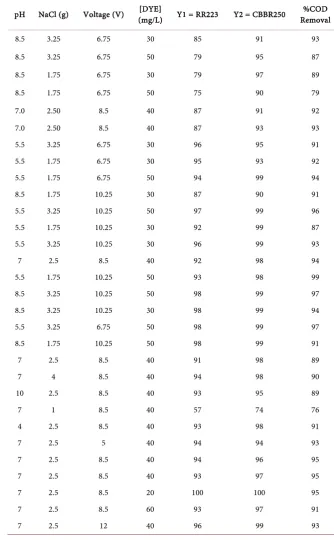
The chemical process depends on different operational parameters they are op-timized by RSM. Consequently, through this approach combine and interactive effect of factors are evaluated. Subsequently, the optimization of parameters is studied for % color and COD removal. To check the significance of operation variables including pH, [NaCl], Voltage and electrolysis time has maintained. The CCD model with four factors at 5 levels is used to optimize the parameters for color and COD removal. Thirty (30) experimental runs are provided by software. A second-order polynomial model Equation (7) was applied to assess the correlations between the responses and also the freelance variables [17].
4 4 4 4 2
0 i1 i i i1 j1 ij i j i1 ii i
Y =β +
∑
=βx +∑ ∑
= =β x x +∑
=β x (7)where Y represent the predicted function; β0 is an intercept; βi, βii, and βij are the
linear coefficients, the quadratic coefficient, and the interaction coefficient, re-spectively; Xiand Xj represent the coded independent factors. The experimental
runs determined by Minitab software 17 and their corresponding results are given in Table 2.
2.8. Surface and Contour Plots
Response surface plots provide a method to predict the decolorization efficiency of dyes. Moreover, the contours of the plots help to identify the type of interac-tions between these variables. The maximum predicted yield was obtained and it was indicated by the surface confined in the smallest curve of the contour dia-gram [18]. The respective plots are showing the variation in target responses owing to variation in levels of operational parameters.
3. Result and Discussion
3.1. The Surface and Contour Plots of the Quadratic Model
Figures 2-4 show the surface and contour plots obtained from the linear models built from the experimental results. Three (3D) dimensional and contour (2D) plots are drawn to check the effect of each variable on responses. The surface and contour plots of the quadratic model with two variables kept constant at their zero level and the other two varying within the experimental ranges. From the results, it was observed that in all the combined process variables showed the significant ef-fect on the color and COD removal in electrocoagulation treatment process.
3.2. Effect of pH on % Color Removal
In the EC process, the pH value of the solution plays a fundamental role in the pollutants removal [19]. The initial pH value was varied from 4 to 10. The effect of pH with other factors on % color removal potency is shown in Figure 2 and
DOI: 10.4236/ojapps.2017.79034 463 Open Journal of Applied Sciences
8 and 10) due to the (H+) and (OH−) consumption and formation during EC
process, respectively. During EC process neutralization of pH of the system de-scribe that [21] the pH of acidic medium (EC system) increases due to the water hydrolysis and H2(gas) evolution, thus producing OH−:
2
[image:6.595.199.534.186.731.2]2H++2e−→H (8)
Table 2. Experimental runs with responses.
pH NaCl (g) Voltage (V) (mg/L) [DYE] Y1 = RR223 Y2 = CBBR250 Removal %COD
8.5 3.25 6.75 30 85 91 93
8.5 3.25 6.75 50 79 95 87
8.5 1.75 6.75 30 79 97 89
8.5 1.75 6.75 50 75 90 79
7.0 2.50 8.5 40 87 91 92
7.0 2.50 8.5 40 87 93 93
5.5 3.25 6.75 30 96 95 91
5.5 1.75 6.75 30 95 93 92
5.5 1.75 6.75 50 94 99 94
8.5 1.75 10.25 30 87 90 91
5.5 3.25 10.25 50 97 99 96
5.5 1.75 10.25 30 92 99 87
5.5 3.25 10.25 30 96 99 93
7 2.5 8.5 40 92 98 94
5.5 1.75 10.25 50 93 98 99
8.5 3.25 10.25 50 98 99 97
8.5 3.25 10.25 30 98 99 94
5.5 3.25 6.75 50 98 99 97
8.5 1.75 10.25 50 98 99 91
7 2.5 8.5 40 91 98 89
7 4 8.5 40 94 98 90
10 2.5 8.5 40 93 95 89
7 1 8.5 40 57 74 76
4 2.5 8.5 40 93 98 91
7 2.5 5 40 94 94 93
7 2.5 8.5 40 94 96 95
7 2.5 8.5 40 93 97 95
7 2.5 8.5 20 100 100 95
7 2.5 8.5 60 93 97 91
DOI:10.4236/ojapps.2017.79034 464 Open Journal of Applied Sciences Figure 2. Response surface plots for % removal of RR223. (a) pH and NaCl (g); (b) pH and voltage (V); (c) pH and [Dye] (mg/L); (d) NaCl (g) and Voltage (V); (e) NaCl (g) and [Dye] (mg/L); (f) Voltage (V) and [dye] (mg/L).
The % color removal of reactive red223 is significantly affecting by the varia-tion in pH levels as compared to CBBR250.The acidic medium is most favoura-ble for both dyes % decolourization efficiency. The % decolourization potency of Coomassie brilliant blue dye in both acidic and alkaline media is virtually same. When pH is acidified, H+ ions neutralize the functional groups (such as
phenol-ic, OH−, and -COO) of organic molecules that are negatively charged; thus, this
protonic charge neutralization decreases their solubility in water which facilitate coagulation of molecules. The neutralization due to pH is the key step of the coagulation process [22].
3.3. Effect of Amount of Electrolyte on % Color Removal
DOI: 10.4236/ojapps.2017.79034 465 Open Journal of Applied Sciences Figure 3. Response surface plots for %removal of CBBR250. (a) pH and NaCl (g); (b) pH and voltage(V); (c) pH and [Dye] (mg/L); (d) NaCl (g) and Voltage (V); (e) NaCl (g) and [Dye] (mg/L); (f) Voltage (V) and [dye] (mg/L).
for the experiments. In the case of 1 g/L NaCl the % color removal efficiency were 57% and 74 % of RR223 and CBBR250 at neutral pH. While at 4 g/L NaCl the % decolourization increased upto 98% for both dyes at buffer conditions. The effect of NaCl with other factors on % color removal potency is shown in
Figure 2 and Figure 3.
3.4. Effect of Voltage on % Color Removal
The removal of RR223 is significantly affecting due to variation in voltage. At 6.75 V the color removal potency of RR223 is 79% and enhanced upto 96% at 12 V. The removal potency of CBB250 has observed same at all levels of voltage as in Figure 2 and Figure 3.
3.5. Effect of Dye Concentration on % Color Removal
[image:8.595.58.541.65.472.2]coagu-DOI:10.4236/ojapps.2017.79034 466 Open Journal of Applied Sciences
lation and coagulants formation in EC process is entirely depend upon the ap-plied voltage and reaction time. So, energy consumption will directly increase the cost of the process.
3.6. Effect of pH on % COD Removal
At neutral pH the % COD removal efficiency is 76 % and at 5.5 pH value in-creased upto 97%. The experiments were carried out at different initial pH val-ues at the vary of pH 4.0 - 10. Generally, the pH of the medium inclined to in-crement throughout the method. The vicissitude in pH depends on the slightly electrode material and initial pH value. At low pH, CO2 is dissolved into the
so-lution and discharge of H2 evolution, causing a pH increase. The effect of initial
[image:9.595.58.537.294.696.2]pH on the COD abstraction efficiencies is given in Figure 4. The maximum ab-straction rates were obtained at the cessation of a 50 min reaction time. As opti-cally discerned, for pH < 6, between 91% and 94% for COD abstraction. COD
DOI: 10.4236/ojapps.2017.79034 467 Open Journal of Applied Sciences
abstractions drop dramatically at pH > 6. The highest abstraction efficiencies have been obtained with aluminum in acidic medium with pH < 6. The COD from textile wastewater utilizing aluminum electrodes are mainly removed by electrocoagulation, while the COD abstraction by iron electrodes is due to the collective effect of electrocoagulation and electrooxidation. Solution pH is one of the most consequential parameters for EC process [23]. So, it is adjusted in the range from 4 to 10 by integrating sodium hydroxide or sulfuric acid solution to investigate the effect of pH on process performance. The process efficiency de-pends vigorously on pH value of the solution. Especially, low pH value increases the abstraction efficiencies, because pH values of the solution elevate during electrolysis process and after a certain point it reaches auspicious pH value for Al(OH)3 precipitation [24]. The best COD removals could be obtained in acidic
pH value with aluminum electrodes [25]. In addition, they reported that when solution pH was increased to 7, removal rates decreased dramatically. When aluminum is used as the electrode material, acidic pH values are more conve-nient for the removal kinetics due to predominant form of Al(OH)3(s). The
re-sult is in accordance with kindred studies in literature [26] [27].
3.7. Effect of Amount of Electrolyte on % COD Removal
The conductivity of the textile wastewater was adjusted to the desired levels by integrating an opportune amount of electrolyte. The experimental conditions were: initial pH of 4 - 10; [NaCl] 1 - 4 g/L, Voltage (5 - 12 V); and dye concen-tration (20 - 60 mg/L). If anode potential is adequately high, secondary reactions may occur additionally, such as direct oxidation of organic compounds and of Cl− ions present in wastewater [28]:
2
2Cl− →Cl +2e−
(9)
Thus, above generated chlorine gas oxidizes dye molecules. The conductivity of the wastewater is adjusted to the desired levels by adding an appropriate amount of NaCl. This adjustment has shown negligible effect on the initial pH of the wastewater, approximately 0.3 pH units, with mean pH value of 6.8. It is clear that, for aluminum, the energy consumption is higher and electrode con-sumption is lower. For both electrodes, the energy and electrode concon-sumptions decrease with increasing wastewater conductivity. It is observed that higher conductivity favors high process efficiency.
3.8. Effect of Voltage on % COD Removal
In fact, Voltage is directly proportional to current. When current increases, there is an increase in aluminium dissolution. So, enhances the formation of hydrox-ide Al(OH)3. For long electrolysis times, the structure of the sludge may change,
approx-DOI:10.4236/ojapps.2017.79034 468 Open Journal of Applied Sciences
imately 50 min. The COD removal potency was observed 76%, when NaCl = 1 g and Voltage = 8.5 V and 93% COD removal potency was observed, when NaCl = 2.5 g voltage = 12 V at neutral pH. It is agreed from Pareto chart too that voltage and pH combine significantly affecting the % COD removal potency.
Figure 4 shows that increasing the voltage from 3 to 5 V causes the increasing removal percentage and then by more enhancement of voltage, the percentage of removal of COD declines. Effect of voltage can be described according to reac-tions that occur during the process. Mechanism of reacreac-tions and behavior of oxide anodes (MOx) was proposed by Comninellis [29]. At the first step, dis-charge of water occurs to produce hydroxyl radicals. There are two states of ac-tive oxygen; physically adsorbed acac-tive oxygen (adsorbed hydroxyl radicals MOx(OH)) and chemisorbed active oxygen (oxygen in the oxide lattice MOx+1)
[30]. In the presence of oxidizable organics, combustion and conversion reac-tions may take place Equareac-tions ((10) and (11)). These oxidation reacreac-tions com-pete with side reactions of oxygen evolution Equations ((12) and (13));
(
o)
X X 2 2
MO HO +RH→MO +mCO +nH O H+ ++e− (10)
X 1 X
MO + +RH→MO +ROH
(11)
(
o)
X X 1 2
MO HO MO O H e
2
+ −
→ + + + (12)
X 1 X 1 2
MO MO O
2
+ → + (13)
Electrochemical oxidation of organics occurs theoretically before oxygen evo-lution [30]. By applying higher voltage concomitant oxygen evolution takes place that results in decreasing efficiency of organic oxidation. On the other hand, performing the process at higher voltages causes oxidation of poisoning products formed at the anode surface.
3.9. Effect of Dye Concentration on % COD Removal
DOI: 10.4236/ojapps.2017.79034 469 Open Journal of Applied Sciences
observed that at same system conditions when concentration of dyes was 30 ppm, the % COD abstraction potency was 93% and decremented upto 87% when dyes system concentration was victualed 50 ppm. The EC process can facilely abstract particulate COD, it may abstract just a scintilla of soluble COD via sorp-tion mechanism on the floc surface [32].
4. CCD Experimental Design
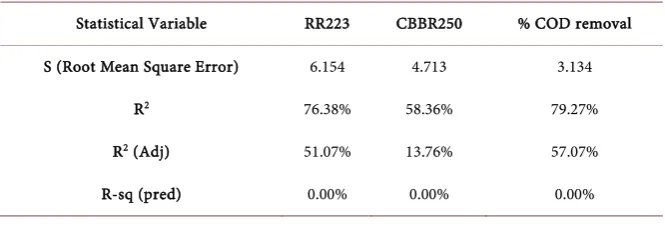
The experimental and the predicted responses correlation is quantitatively eva-luated by coefficient (R2). The obtained R2 values suggest good agreement to the
observed results since this indicates that 76.38% and 58.36% variation in % color removal is explained by the model. The goodness of a fit is measured by the Ad-justed R2 (Adj-R2) value as shown in Table 3 design by Minitab 17 software.
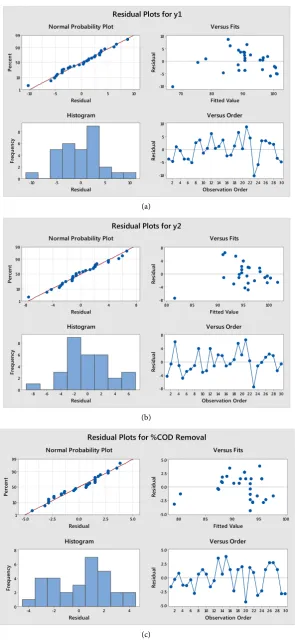
The independent variable on the horizontal axis is plotted against the resi-duals on the vertical axis in residual plots. If the points in a residual plot are randomly dispersed around the horizontal axis, a linear regression model is fit-ted for the data; otherwise, a non-linear model is more appropriate. The normal-ity of the residuals is studied by Normal probabilnormal-ity plots. The observed residuals are plotted against the expected values, given by a normal distribution in Figure 5. The residuals from the analysis should be normally distributed. In practice, if number of observation is large, moderate divergence from normality do not critically influence the results. The normal probability plot of the residuals should follow a straight line to fit the linear model. Trends observed in Figures 5(a)-(c) reveal reasonably well-behaved residuals for % color and COD removal. Based on these plots, the residuals appear to be randomly scattered about zero.
Figures 5(a)-(c) illustrate the residuals in the order of the corresponding obser-vations. It shows that the residuals in the plot fluctuate in an arbitrary pattern around the center line.
4.1. Pareto Charts Analysis
[image:12.595.207.540.613.733.2]The Pareto plot helps to identify the significant factors that influence the target response. Linear, quadratic and interactive significance of factors on response are identified. The amount of electrolyte, pH and dyes concentration is the sig-nificant factors that are influencing the response. The amount of electrolyte fac-tor has a greater effect on response compared to the other facfac-tors. This is due to
Table 3. Model Summary for % color and COD removals.
Statistical Variable RR223 CBBR250 % COD removal
S (Root Mean Square Error) 6.154 4.713 3.134
R2 76.38% 58.36% 79.27%
R2 (Adj) 51.07% 13.76% 57.07%
DOI:10.4236/ojapps.2017.79034 470 Open Journal of Applied Sciences (a)
(b)
[image:13.595.226.522.65.710.2](c)
Figure 5. Residual plots of (a) RR223 dye (b) CBBR250 (c) % COD removal potency. 10 5 0 -5 -10 99 90 50 10 1 Residual Pe rc en t 100 90 80 70 10 5 0 -5 -10 Fitted Value Re si du al 10 5 0 -5 -10 8 6 4 2 0 Residual Fr eq ue nc y 30 28 26 24 22 20 18 16 14 12 10 8 6 4 2 10 5 0 -5 -10 Observation Order Re si du al
Normal Probability Plot Versus Fits
Histogram Versus Order
Residual Plots for y1
8 4 0 -4 -8 99 90 50 10 1 Residual Pe rc en t 100 95 90 85 80 8 4 0 -4 -8 Fitted Value Re si du al 6 4 2 0 -2 -4 -6 -8 8 6 4 2 0 Residual Fr eq ue nc y 30 28 26 24 22 20 18 16 14 12 10 8 6 4 2 8 4 0 -4 -8 Observation Order Re si du al
Normal Probability Plot Versus Fits
Histogram Versus Order
Residual Plots for y2
5.0 2.5 0.0 -2.5 -5.0 99 90 50 10 1 Residual Pe rc en t 100 95 90 85 80 5.0 2.5 0.0 -2.5 -5.0 Fitted Value Re si du al 4 2 0 -2 -4 8 6 4 2 0 Residual Fr eq ue nc y 30 28 26 24 22 20 18 16 14 12 10 8 6 4 2 5.0 2.5 0.0 -2.5 -5.0 Observation Order Re si du al
Normal Probability Plot Versus Fits
Histogram Versus Order
DOI: 10.4236/ojapps.2017.79034 471 Open Journal of Applied Sciences
the fact that NaCl increases the conductivity of the EC system and enhances the % color and COD removal. The Pareto chart related to % dye and COD re-moval potency are given in Figures 6 (a)-(c).
4.2. ANOVA Test
ANOVA test is performed to study the influence of all factors on target re-sponse. Statistical significance of the model equation and model terms was eva-luated by F-test and ANOVA [33]. Sum of squares (SS), DOF (degree of free-dom), mean of square (MS), and associated F-test of importance (F) can be cal-culated as follows:
(
2)
21 –
A k
A i i
SS =
∑
= A nAi T N (14)Description of abbreviations is as follows: ‘‘kA’’ is the number of the levels of
factor A, ‘‘nAi’’ is the number of all observations at level ‘‘i’’ of factor A, Ai is the
sum of all observations of level ‘‘i’’ of factor A and T is the sum of all observa-tions. SS of error is computed using the following equation:
(
)
T A B
SSe SS= − SS +SS + (15)
where SST is the total SS:
( )
2 21 –
n
T i i
SS =
∑
= Y T N (16)where ‘‘yi’’ is the observation of ‘‘i’’. MS is calculated by dividing the sum of
squares by the degrees of freedom. DOFA is estimated by DOFA = kA− 1. F value
is calculated as follows (Gönder et al. 2010):
A A
F =MS MSe (17)
MSe is the variance of error [34].
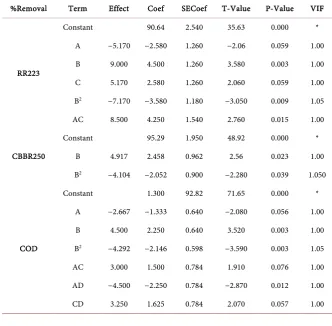
The analysis of variance (ANOVA) is presented in Table 4. If the model is a good predictor of the experimental results, F-value should be greater than the tabulated value of F-distribution for a certain number of degrees of freedom in the model at a level of significance α. The p-value < 0.05 for RR223 so it is con-firming the adequacy of the model fitted. A, B, C, B2 and AC are significantly
af-fecting the response of RR223. The p-value > 0.05 for coommassie brilliant blue R250 is indicating insignificance of the model. B, B2 are the terms that are
sig-nificantly effecting the response of the target response of coommassie brilliant blue. p-value < 0.05 for % COD removal its mean model is fitted for the re-sponse.B.B2 and AD are the significant terms for %COD removal potency which
DOI:10.4236/ojapps.2017.79034 472 Open Journal of Applied Sciences (a)
(b)
[image:15.595.219.524.69.671.2](c)
Figure 6. The Pareto chart of % color removal. (a) Reactive red223; (b) Coomassie bril-liant blue R250; (c) % COD removal potency.
-.084083 .1681656 .3363311 -.343267 -.420414 .6972379 .9249106 1.137599 1.467869 -2.12825 2.128252 2.858814 -3.15592 3.707278 p=.05
Standardized Effect Estimate (Absolute Value) 1Lby4L 2Lby3L 1Lby2L (4)[Dye](L) 2Lby4L pH(Q) 3Lby4L Voltage(Q) [Dye](Q) (1)pH(L) (3)Voltage(L) 1Lby3L NaCl(Q) (2)NaCl(L) .3363311 -.343267 .0540072 .0540072 -.162022 .2700359 .2700359 .39687 .4860646 .6481932 .6481932 -1.19061 1.213889 1.45519 -2.32171 2.601704 p=.05 Standardized Effect Estimate (Absolute Value) 3Lby4L 2Lby4L 1Lby4L 1Lby3L 1Lby2L (4)[Dye](L) 2Lby3L Voltage(Q) pH(Q) (1)pH(L) [Dye](Q) (3)Voltage(L) NaCl(Q) (2)NaCl(L) .1310431 .1604944 -.160494 .5953866 .5953866 -.665432 1.283955 1.70356 1.925932 2.086427 -2.09669 -2.8889 3.53816 -3.6073 p=.05
DOI: 10.4236/ojapps.2017.79034 473 Open Journal of Applied Sciences Table 4. Analysis of variance for EC process for binary dye removal potency.
Response Source DF Adj SS Adj MS F-Value P-Value
RR223
Model 15 1714 114.3 3.020 0.023
Error 14 530.3 37.88 * *
Lack-of-Fit 10 509.0 50.90 9.580 0.022
Pure Error 4 21.25 5.312 * *
Total 29 2245 * * *
CBBR250
Model 15 436.0 29.06 1.310 *
Error 14 311.0 22.21 * *
Lack-of-Fit 10 272.5 27.25 2.830 0.164
Pure Error 4 38.50 9.625 * *
Total 29 747.0 * * *
COD
Model 15 526.0 35.06 3.57 0.011
Error 14 137.5 9.823 * *
Lack-of-Fit 10 123.5 12.35 3.53 0.118
Pure Error 4 14.00 3.500 * *
Total 29 663.5 * * *
Table 5. Student t and p values for significant operational parameters.
%Removal Term Effect Coef SECoef T-Value P-Value VIF
RR223
Constant 90.64 2.540 35.63 0.000 *
A −5.170 −2.580 1.260 −2.06 0.059 1.00 B 9.000 4.500 1.260 3.580 0.003 1.00 C 5.170 2.580 1.260 2.060 0.059 1.00 B2 −7.170 −3.580 1.180 −3.050 0.009 1.05
AC 8.500 4.250 1.540 2.760 0.015 1.00
CBBR250
Constant 95.29 1.950 48.92 0.000 *
B 4.917 2.458 0.962 2.56 0.023 1.00
B2 −4.104 −2.052 0.900 −2.280 0.039 1.050
COD
Constant 1.300 92.82 71.65 0.000 *
A −2.667 −1.333 0.640 −2.080 0.056 1.00 B 4.500 2.250 0.640 3.520 0.003 1.00 B2 −4.292 −2.146 0.598 −3.590 0.003 1.05
[image:16.595.205.538.408.734.2]DOI:10.4236/ojapps.2017.79034 474 Open Journal of Applied Sciences
4.3. Regression Equations
Based on second order polynomial model, an empirical relationship between the response and independent variables was attained and expressed by the following second-order polynomial equations:
( )
1 RR 223
Y 235.6 21.2A 36.5B 20.65C 1.78D 0.352AA 6.37BB 0.422CC 0.0167DD 0.44AB 1.619AC 0.008AD 0.19BC 0.083BD 0.0786CD
= − + − − +
− + + + +
− + − +
(18)
( )
2 CBBR 250
Y 124.1 5.52A 15.6B 4.44C 0.78D 0.255AA 3.65BB 0.187CC 0.01073DD 0.28AB 0.119AC 0.0125AD 0.429BC 0.008BD 0.0036CD
= − + − − +
− + + + +
− + + +
(19)
%COD Re moval 106.3 0.49A 15.99B 8.82C 0.056D 0.176AA 3.81BB 0.116CC 0.00354DD 0.889AB 0.571AC 0.1500AD 0.095BC 0.017BD 0.0929CD
= + + − − −
− + + + +
− − + +
(20)
4.4. Optimization of Parameters
The goals of the optimization of EC system are to increase the response of color removal potency of two dyes. To solve this type of multi-objective optimization drawback, Derringer and Suich recommended the desirability perform Equation (21) that is one in all the foremost appropriate ways. The overall desirability function, D, is the mean value of the individual desirability functions:
(
)
11 k i i k
d
D=
∏
= (21)with di denoting the individual desirability function for every response, and k
DOI: 10.4236/ojapps.2017.79034 475 Open Journal of Applied Sciences Table 6. The result obtained at optimum values.
Operational parameters
Optimum values Result at optimum values
%Color removal of RR223
%Color removal of
CBBR250
% COD removal
%Color removal of RR223
%Color removal of
CBBR250
% COD removal
pH 4 4 4
89% 94% 100%
Amount of
electrolyte 3 3 1
Voltage 12 12 5
[Dyes] 60 60 20
process of RR223 and Coomassie brilliant blue solutions is prosperous [36].
4.5. Main Interaction Plots
Observation of main interaction plots clearly showing that operational parame-ters are not linear to experimental mean lines of responses. Its mean factor is significantly affecting the response. Interactions plots could be acclimated to compare the relative vigor of the responses due to factors. The following Figures 7(a)-(c) are the main interaction plots for % dye and COD removal potency.
4.6. Full Interaction Plots
These are the plot between variables at a time and corresponding response is premeditated. This plot shows response means for the levels of one factor on the x-axis and a separate line for each level of another factor. The parallel lines mean that no variation in target responses due to amendment in factors levels. More-over, if the response slope is higher than means additional robust interaction was present among the levels of factors for the target response additionally these plots are reciprocal to ANOVA. In addition, interaction plots are very useful and showing significant interaction is present among factors for the responses. Fig-ures 8(a)-(c) are representing full interaction plots for % dye and COD removal potency.
4.7. Kinetic Study
The First order and second order kinetics model was utilized, which are represented as follows:
[ ]
ln A t=lnAo k t− ⋅
(22)
[ ]
A t1 = ⋅ +k t[ ]
A o1 (23)The kinetic parameters of respective dyes system and energy consumption during the process is represented in Table 7.
4.8. FTIR Studies and Characterization of Synthesized Sludge
DOI:10.4236/ojapps.2017.79034 476 Open Journal of Applied Sciences (a)
(b)
[image:19.595.216.532.61.692.2](c)
Figure 7. Main interaction plots. (a) % color removal of RR223; (b) %Color removal po-tency CBBR250; (c) % COD removal popo-tency.
10.0 8.5 7.0 5.5 4.0
100
90
80
70
60
4.00 3.25 2.50 1.75
1.00 5.00 6.75 8.50 10.2512.00 20 30 40 50 60
A
M
ea
n
B C D
y
Data Means
10.0 8.5 7.0 5.5 4.0
100
95
90
85
80
75
4.00 3.25 2.50 1.75
1.00 5.00 6.75 8.50 10.2512.00 20 30 40 50 60
A
M
ea
n
B C D
y
Data Means
10.0 8.5 7.0 5.5 4.0
95
90
85
80
75
4.00 3.25 2.50 1.75
1.00 5.00 6.75 8.5010.2512.00 20 30 40 50 60
A
M
ea
n
B C D
DOI: 10.4236/ojapps.2017.79034 477 Open Journal of Applied Sciences (a)
(b)
[image:20.595.214.533.59.693.2](c)
Figure 8. Full interaction plots. (a) % color removal of RR223; (b) %Color removal po-tency CBBR250; (c) % COD removal popo-tency.
4.00 3.25 2.50 1.75
1.00 20 30 40 50 60
100 80 60 100 80 60 100 80 60 10.0 8.5 7.0 5.5 4.0 100 80 60 12.00 10.25 8.50 6.75 5.00 A B C D 4.0 5.5 7.0 8.5 10.0 A 1.00 1.75 2.50 3.25 4.00 B 5.00 6.75 8.50 10.25 12.00 C 20 30 40 50 60 D Data Means 4.00 3.25 2.50 1.75
1.00 20 30 40 50 60
100 90 80 100 90 80 100 90 80 10.0 8.5 7.0 5.5 4.0 100 90 80 12.00 10.25 8.50 6.75 5.00 A B C D 4.0 5.5 7.0 8.5 10.0 A 1.00 1.75 2.50 3.25 4.00 B 5.00 6.75 8.50 10.25 12.00 C 20 30 40 50 60 D y Data Means 4.00 3.25 2.50 1.75
1.00 20 30 40 50 60
DOI:10.4236/ojapps.2017.79034 478 Open Journal of Applied Sciences Table 7. Kinetic study of dyes decolorization at (T: 23˚C, NaCl: 4 g/L and V: 12 V, pH = 4, I = 1.38 A. Time = 45 min).
Dye Kinetic Model Rate constant t1/2
(min) R
2 Consumption Energy
(kwh) Sludge RR 223 First Order 4.9 × 10⁻² min−1 14.14 0.597 12.42 × 10⁻³
1.14 g/L CBBR250 Second order 2.939 M−1 min−1 26.17 0.767 12.42 × 10⁻³
Figure 9. FTIR spectrum of (a) CBBR250 (b) RR223.
was found to be 1.14 g/L of the treated wastewater (on a dry substructure). The characterization of the EC-engendered sludge was performed with FT-IR as shown in Figure 9.
4.9. Influence of the Chemical Structure of the Dyes
DOI: 10.4236/ojapps.2017.79034 479 Open Journal of Applied Sciences
5. Comparison between This Work and Previous Work
The comparative work is represented below to show the significance of EC process especially in electrode pair of Al/Fe for the treatment of dye effluent discharges. The comparison of electrode combination for different dyes removal is given in Table 8.
Operating Cost Analysis
Energy, sacrificial electrodes and chemicals are used during the process and their costs are taken into account in the calculation of the operating cost, as US$ per dm3 for the treatment of binary dye wastewater. The following equation was
used to estimate operating cost.
energy electrode chemicals
Operating cost=aC +bC +eC (24)
where Cenergy, Celectrode, Csludge, Cchemicals, are represented as a, b, d, while the e
represent the energy intake for every dm3 of wastewater (kWh/dm3). The cost
analysis related data is given in Table 9.
6. Conclusions
[image:22.595.55.541.448.741.2]Dyes are extensively utilized in textile industries. They are characterized by wa-ter solubility and structural diversity. So, it may be paramount to investigate processes which are able to decolorize wastewaters or to abstract dyes. Many electrochemical processes have been studied, including treatment by EC. The elec-trochemical process for the abstraction of organic matter from effluent was studied.
Table 8. Electrocoagulation process used for removal of various types of dyes.
Reference
no Dye Current density Current or Anode-cathode %Removal efficiency
[37] Reactive orange 84 130 A/m2 Fe-Fe 66, 76
[38] Acid red131, Reactive yellow 86, Indanthrene blue RS, Basic GR 4, Reactive yellow 145 0.0625 A/cm2 Al-Al 97
[39] Reactive black B, Orange 3R, Yellow GR 0.0625 A/cm2 Al-Al 98
[40] Azo, Anthraquinone, Xanthene 0.3 A Fe-Fe 98
[41] Acid black 52, Acid yellow 220 40 A/m2 Al-Al 92, 95
[42] Levafix brilliant blue E-B 100 A/cm2 Al-Al, Fe-Fe 99, 83
[43] Acid, Reactive 4.0 mA/cm2 Fe-Carbon 95
[44] Orange II 160 A/m2 Al-Al 94.5
[45] Reactive black 5 4.575 mA/cm2 Fe-Fe 98.8
[46] Reactive, Basic e - Al-Al, Fe-Fe 96, 85.6
[47] Direct red 23 30 A/m2 Fe-Fe, Al-Al >95
[48] Levafix blue CA 35.5 mA/cm2 Fe-Fe 99.5
[49] Bomaplex red CR-L 0.50 mA/cm2 Al-Al 99.1
DOI:10.4236/ojapps.2017.79034 480 Open Journal of Applied Sciences Table 9. The cost analysis at optimal conditions (Al electrode consumption = 1.488 × 10⁻³ kg/dm3, NaCl = 3 g/L, dye = 60 mg/L, Reaction time = 60 min, pH = 4, V=12 volt).
Parameter Quantity
Energy consumption (kwh/dm3) 0.019 (kwh/dm3)
Sodium chloride (kg/dm3) 0.01 kg/dm3
sodium Hydroxide consumption (kg/dm3) 0.01 kg/dm3
Sludge production (kg/dm3) 0.7 kg/dm3
Electrode consumption (Kg/dm3) 1.488 × 10⁻³ kg/dm3
Hydrochloric acid (mL/dm3) 100 (mL/dm3)
dyes (Kg/dm3) 7.5 × 10⁻⁴ (Kg/dm3)
Electrical energy cost (US$/dm3) 3.2734 × 10⁻⁴ US$/dm3
dye cost (US$/dm3) 0.252 US$/dm3
Electrode cost (US$/dm3) 0.14 US$/dm3
Hydrochloric acid cost(US$/dm3) 0.1 US$/dm3
Hydroxide sodium cost (US$/dm3) 1 US$/dm3
Sodium chloride (US$/dm3) 0.001 US$/m3
Potassium dichromate (US$/dm3) 1 US$/dm3
Mercury sulphate (US$/dm3) 1 US$/dm3
Silver sulphate (US$/dm3) 1 US$/dm3
Total operating cost (US$/dm3) 4.486 US$/dm3
This work concerns EC process for textile dyes abstraction of RR223, an azoic dye, and CBBR250 as an anthraquinonic dye. Nevertheless, higher values can be achieved with more sizably voluminous periods of EC process. Most of the alu-minium present in the wastewater is removed , and it is the significant advantage of this EC process. Withal, the turbidity associated to organic and inorganic matter was abstracted with the electrocoagulation, making this process ideal for high-polluted wastewater treatment. The amendment of the optical characteris-tics of the water is fundamental for the prosperity of the EC treatment. Electro-coagulation is an efficient process, even at high pH, for the abstraction of color and total organic carbon in reactive dyes textile wastewater. The amount of elec-trolyte factor has a more preponderant effect on replication compared to the other factors. High conductivity favors high process performances. According to the results, in acidic medium, pH < 6, % color and COD abstraction efficiencies are higher in case of aluminum electrode. A 24-full factorial CCF design was
prosperously employed for experimental design and analysis of results. Analy-sis of variance showed a high coefficient of correlation value R2 (RR223) =
0.7638, R2 (CBBR250) = 0.5836 and R2 (COD) = 0.7927), thus ascertaining a
[image:23.595.210.540.103.408.2]DOI: 10.4236/ojapps.2017.79034 481 Open Journal of Applied Sciences
abstraction utilizing RSM to optimize the parameters. The present study demonstrated the applicability of electrocoagulation method for dye abstrac-tion. Thus, the EC can be considered as a reliable technique for treating wastewater from the textile industry.
Acknowledgements
The authors acknowledge the financial assistance supported by University of Karachi, Pakistan.
References
[1] Salazar, R., Brillas, E. and Sirés, I. (2012) Finding the Best Fe2+/Cu2+ Combination
for the Solar Photoelectro-Fenton Treatment of Simulated Wastewater Containing the Industrial Textile Dye Disperse Blue 3. Applied Catalysis B: Environmental, 115, 107-116.
[2] Robinson, T., McMullan, G., Marchant, R. and Nigam, P. (2001) Remediation of Dyes in Textile Effluent: A Critical Review on Current Treatment Technologies with a Proposed Alternative. Bioresource Technology, 77, 247-255.
[3] Martínez-Huitle, C.A. and Brillas, E. (2009) Decontamination of Wastewaters Con-taining Synthetic Organic Dyes by Electrochemical Methods: A General Review.
Applied Catalysis B: Environmental, 87, 105-145.
[4] Brown, D. (1987) Effects of Colorants in the Aquatic Environment. Ecotoxicology and Environmental Safety, 13, 139-147.
[5] Sharma, K.P., Sharma, S., Sharma, S., Singh, P.K., Kumar, S., Grover, R. and Shar-ma, P.K. (2007) A Comparative Study on Characterization of Textile Wastewaters (Untreated and Treated) Toxicity by Chemical and Biological Tests. Chemosphere, 69, 48-54.
[6] Koch, M., Yediler, A., Lienert, D., Insel, G. and Kettrup, A. (2002) Ozonation of Hydrolyzed Azo Dye Reactive Yellow 84 (CI). Chemosphere, 46, 109-113.
[7] Banat, I.M., Nigam, P., Singh, D. and Marchant, R. (1996) Microbial Decolorization of Textile-Dyecontaining Effluents: A Review. Bioresource Technology, 58, 217-227. [8] Sahu, O., Mazumdar, B. and Chaudhari, P.K. (2014) Treatment of Wastewater by Electrocoagulation: A Review. Environmental Science and Pollution Research, 21, 2397-2413.https://doi.org/10.1007/s11356-013-2208-6
[9] Murugananthan, M., Raju, G.B. and Prabhakar, S. (2004) Separation of Pollutants from Tannery Effluents by Electro Flotation. Separation and Purification Technol-ogy, 40, 69-75.
[10] Can, O.T., Bayramoglu, M. and Kobya, M. (2003) Decolorization of Reactive Dye Solutions by Electrocoagulation using Aluminum Electrodes. Industrial & Engi-neering Chemistry Research, 42, 3391-3396.https://doi.org/10.1021/ie020951g
[11] Kumar, M., Ponselvan, F.I.A., Malviya, J.R., Srivastava, V.C. and Mall, I.D. (2009) Treatment of Bio-Digester Effluent by Electrocoagulation using Iron Electrodes.
Journal of Hazardous Materials, 165, 345-352.
[12] Chen, G. (2004) Electrochemical Technologies in Wastewater Treatment. Separa-tion and PurificaSepara-tion Technology, 38, 11-41.
DOI:10.4236/ojapps.2017.79034 482 Open Journal of Applied Sciences [14] Youchun, Z., Dunwen, L., Yongqi, Z., Jianmin, L. and Meiqiang, L. (1991) The
Study of the Electrolysis Coagulation Process using Insoluble Anodes for Treatment of Printing and Dyeing Wastewater. Water Treatment, 6, 227-236.
[15] Cruz-González, K., Torres-Lopez, O., García-León, A.M., Brillas, E., Hernández-Ramírez, A. and Peralta-Hernández, J.M. (2012) Optimization of Elec-tro-Fenton/BDD Process for Decolorization of a Model Azo Dye Wastewater by Means of Response Surface Methodology. Desalination, 286, 63-68.
[16] APHA (1992) Standard Methods for Examination of Water and Wastewater. American Water Work Association, New York.
[17] Yu, P. and Chao, X. (2013) Statistics-Based Optimization of the Extraction Process of Kelp Polysaccharide and Its Activities. Carbohydrate Polymers, 91, 356-362. [18] Ravikumar, K., Pakshirajan, K., Swaminathan, T. and Balu, K. (2005) Optimization
of Batch Process Parameters using Response Surface Methodology for Dye Removal by a Novel Adsorbent. Chemical Engineering Journal, 105, 131-138.
[19] Kobya, M., Demirbas, E. and Sahin, O. (2012) Effect of Operational Parameters on the Removal of Phenol from Aqueous Solutions by Electrocoagulation using Fe and Al Electrodes. Desalination and Water Treatment, 46, 366-374.
https://doi.org/10.1080/19443994.2012.677565
[20] Do, J.S. and Chen, M.L. (1994) Decolourization of Dye-Containing Solutions by Electrocoagulation. Journal of Applied Electrochemistry, 24, 785-790.
https://doi.org/10.1007/BF00578095
[21] Ghernaout, D., Mariche, A., Ghernaout, B. and Kellil, A. (2010) Electromagnetic Treatment-Doubled Electrocoagulation of Humic Acid in Continuous Mode using Response Surface Method for Its Optimisation and Application on Two Surface Waters. Desalination and Water Treatment, 22, 311-329.
https://doi.org/10.5004/dwt.2010.1120
[22] Ghernaout, B., Ghernaout, D. and Saiba, A. (2010) Algae and Cyanotoxins Removal by Coagulation/Flocculation: A Review. Desalination and Water Treatment, 20, 133-143.https://doi.org/10.5004/dwt.2010.1202
[23] Daneshvar, N., Khataee, A.R., Ghadim, A.A. and Rasoulifard, M.H. (2007) Decolo-rization of CI Acid Yellow 23 Solution by Electrocoagulation Process: Investigation of Operational Parameters and Evaluation of Specific Electrical Energy Consump-tion (SEEC). Journal of Hazardous Materials, 148, 566-572.
[24] Mouedhen, G., Feki, M., Wery, M.D.P. and Ayedi, H.F. (2008) Behavior of Alumi-num Electrodes in Electrocoagulation Process. Journal of Hazardous Materials, 150, 124-135.
[25] Kumar, V. (2017) A Review on the Feasibility of Electrolytic Treatment of Waste-water: Prospective and Constraints. Constraints, 2, 52-62.
[26] Attour, A., Touati, M., Tlili, M., Amor, M.B., Lapicque, F. and Leclerc, J.P. (2014) Influence of Operating Parameters on Phosphate Removal from Water by Electro-coagulation using Aluminum Electrodes. Separation and Purification Technology, 123, 124-129.
[27] İrdemez, Ş., Demircioğlu, N., Yıldız, Y.Ş. and Bingül, Z. (2006) The Effects of Cur-rent Density and Phosphate Concentration on Phosphate Removal from Wastewa-ter by Electrocoagulation using Aluminum and Iron Plate Electrodes. Separation and Purification Technology, 52, 218-223.
DOI: 10.4236/ojapps.2017.79034 483 Open Journal of Applied Sciences [29] Comninellis, C. (1994) Electrocatalysis in the Electrochemical Conversion/Combustion of Organic Pollutants for Waste Water Treatment. Electrochimica Acta, 39, 1857-1862.
[30] Wang, Y.Q., Gu, B. and Xu, W.L. (2009) Electro-Catalytic Degradation of Phenol on Several Metal-Oxide Anodes. Journal of Hazardous Materials, 162, 1159-1164. [31] Moreno, H.A., Cocke, D.L., Gomes, J.J.A., Morkovsky, P., Peterson, E. and Parga,
J.R. (2006) Electrocoagulation: COD Removal Mechanism. The 2006 Annual Meet-ing.
[32] Hu, Z., Chandran, K., Smets, B.F. and Grasso, D. (2002) Evaluation of a Rapid Physical-Chemical Method for the Determination of Extant Soluble COD. Water Research, 36, 617-624.
[33] Jadhav, S.B., Chougule, A.S., Shah, D.P., Pereira, C.S. and Jadhav, J.P. (2015) Appli-cation of Response Surface Methodology for the Optimization of Textile Effluent Biodecolorization and Its Toxicity Perspectives using Plant Toxicity, Plasmid Nick-ing Assays. Clean Technologies and Environmental Policy, 17, 709-720.
https://doi.org/10.1007/s10098-014-0827-3
[34] Gönder, Z.B., Kaya, Y., Vergili, I. and Barlas, H. (2010) Optimization of Filtration Conditions for CIP Wastewater Treatment by Nanofiltration Process using Taguchi Approach. Separation and Purification Technology, 70, 265-273.
[35] Kasiri, M.B., Aleboyeh, H. and Aleboyeh, A. (2008) Modeling and Optimization of Heterogeneous Photo-Fenton Process with Response Surface Methodology and Ar-tificial Neural Networks. Environmental Science & Technology, 42, 7970-7975.
https://doi.org/10.1021/es801372q
[36] Aisyah, S.I., Norfariha, M.S., Azlan, M.M. and Norli, I. (2014) Comparison of Syn-thetic and Natural Organic Polymers as Flocculant for Textile Wastewater Treat-ment. Iranica Journal of Energy & Environment, 5, 436-445.
[37] Abu Hassan, M.A., Pei, L. and Noor, Z.Z. (2004) Coagulation and Flocculation Treatment of Wastewater in Chicken Processing Industry Using Chitosan. Journal of Chemical and Natural Resources Engineering, 4, 43-53.
[38] Khandegar, V. and Saroha, A.K. (2013) Electrochemical Treatment of Effluent from Small-Scale Dyeing Unit. Indian Chemical Engineer, 55, 112-120.
https://doi.org/10.1080/00194506.2013.798889
[39] Khandegar, V. and Saroha, A.K. (2013) Electrochemical Treatment of Textile Ef-fluent Containing Acid Red 131 Dye. Journal of Hazardous, Toxic, and Radioactive Waste, 18, 38-44.https://doi.org/10.1061/(ASCE)HZ.2153-5515.0000194
[40] Wei, M.C., Wang, K.S., Huang, C.L., Chiang, C.W., Chang, T.J., Lee, S.S. and Chang, S.H. (2012) Improvement of Textile Dye Removal by Electrocoagulation with Low-Cost Steel Wool Cathode Reactor. Chemical Engineering Journal, 192, 37-44.
[41] Zodi, S., Merzouk, B., Potier, O., Lapicque, F. and Leclerc, J.P. (2013) Direct Red 81 Dye Removal by a Continuous Flow Electrocoagulation/Flotation Reactor. Separa-tion and PurificaSepara-tion Technology, 108, 215-222.
[42] Akbal, F. and Kuleyin, A. (2011) Decolorization of Levafix Brilliant Blue E-B by Electrocoagulation Method. Environmental Progress & Sustainable Energy, 30, 29-36.https://doi.org/10.1002/ep.10437
Mate-DOI:10.4236/ojapps.2017.79034 484 Open Journal of Applied Sciences
rials, 151, 422-431.
[44] Mollah, M.Y.A., Gomes, J.A., Das, K.K. and Cocke, D.L. (2010) Electrochemical Treatment of Orange II Dye Solution—Use of Aluminum Sacrificial Electrodes and Floc Characterization. Journal of Hazardous Materials, 174, 851-858.
[45] Şengil, İ.A. and Özacar, M. (2009) The Decolorization of CI Reactive Black 5 in Aqueous Solution by Electrocoagulation using Sacrificial Iron Electrodes. Journal of Hazardous Materials, 161, 1369-1376.
[46] Charoenlarp, K. and Choyphan, W. (2009) Reuse of Dye Wastewater through Co-lour Removal with Electrocoagulation Process. Asian Journal on Energy and Envi-ronment, 10, 250-260.
[47] Phalakornkule, C., Polgumhang, S. and Tongdaung, W. (2009) Performance of an Electrocoagulation Process in Treating Direct Dye: Batch and Continuous Upflow Processes. World Academy of Science, Engineering and Technology, 57, 277-282. [48] Aleboyeh, A., Daneshvar, N. and Kasiri, M.B. (2008) Optimization of CI Acid Red
14 Azo Dye Removal by Electrocoagulation Batch Process with Response Surface Methodology. Chemical Engineering and Processing: Process Intensification, 47, 827-832.
[49] Yildiz, Y.Ş. (2008) Optimization of Bomaplex Red CR-L Dye Removal from Aqueous Solution by Electrocoagulation using Aluminum Electrodes. Journal of Hazardous Materials, 153, 194-200.
Submit or recommend next manuscript to SCIRP and we will provide best service for you:
Accepting pre-submission inquiries through Email, Facebook, LinkedIn, Twitter, etc. A wide selection of journals (inclusive of 9 subjects, more than 200 journals)
Providing 24-hour high-quality service User-friendly online submission system Fair and swift peer-review system
Efficient typesetting and proofreading procedure
Display of the result of downloads and visits, as well as the number of cited articles Maximum dissemination of your research work
Submit your manuscript at: http://papersubmission.scirp.org/

![Figure 2. Response surface plots for % removal of RR223. (a) pH and NaCl (g); (b) pH and voltage (V); (c) pH and [Dye] (mg/L); (d) NaCl (g) and Voltage (V); (e) NaCl (g) and [Dye] (mg/L); (f) Voltage (V) and [dye] (mg/L)](https://thumb-us.123doks.com/thumbv2/123dok_us/171574.510400/7.595.60.540.66.470/figure-response-surface-removal-voltage-voltage-nacl-voltage.webp)
![Figure 3. Response surface plots for %removal of CBBR250. (a) pH and NaCl (g); (b) pH and voltage(V); (c) pH and [Dye] (mg/L); (d) NaCl (g) and Voltage (V); (e) NaCl (g) and [Dye] (mg/L); (f) Voltage (V) and [dye] (mg/L)](https://thumb-us.123doks.com/thumbv2/123dok_us/171574.510400/8.595.58.541.65.472/figure-response-surface-removal-voltage-voltage-nacl-voltage.webp)
![Figure 4. Response surface plots for % COD removal. (a) pH and NaCl (g); (b) pH and Voltage (V); (c) pH and [Dye] (mg/L); (d) NaCl (g) and Voltage (V); (e) NaCl (g) and [Dye] (mg/L); (f) Voltage (V) and [dye] (mg/L)](https://thumb-us.123doks.com/thumbv2/123dok_us/171574.510400/9.595.58.537.294.696/figure-response-surface-removal-voltage-voltage-nacl-voltage.webp)