729 † Corresponding author
TECHNO-LOGY & HUMAN DEVELOPMENT
Seher Gülşah TOPUZ1† --- Esra DOĞAN2 1
Research Assistant, Department of Economics, Faculty of Economics and Administrative Sciences, Eskisehir Osmangazi University, Turkey 2Research Assistant, Department of Public Finance, Faculty of Economics and Administrative Sciences, Eskisehir Osmangazi University, Turkey
ABSTRACT
In this study, relationship between technology and development is examined comparatively under conceptual and
econometric aspect. Data analyses and Vector Error Correction Model as the basis for the causality test is applied
for 55 countries in a different development levels for the period 2000 to 2013. High technology export, ICT export,
patent applications and individual internet usage is used as an indicator of the technology level in the analyses. It is
concluded that there exists a considerable difference about the relationship between technology and development
between developed and developing countries.
© 2016 AESS Publications. All Rights Reserved.
Keywords:Technology, Development, Knowledge, ICT, VECM, Patent.
JEL Classification:C33, D80, L96, O1, O3.
Received: 2 August 2016/ Revised: 3 September 2016/ Accepted: 29 September 2016/ Published: 25 October 2016
Contribution/ Originality
This study contributes in the existing literature importance of relationship between technology and knowledge in the scope of etymological investigation and also it is emphasized that impacts of this relationship on human development.
1. INTRODUCTION
Technology and development have bilateral relationship. Both of them represent the improvement based on human consequently society. Especially with the globalization process impact of this relationship on human and society increase. Therefore, examinations on this relationship are considered the human and society jointly.
Technology beyond the socio, cultural character is accepted as an important factor of the economies. Because economies are taken advantage of technology in all areas related to technology. A connection between technology and economy loom large in the point of productivity. As a matter of fact, it is seen that priority works carried out by artisans has left in its place to technology with the development of science. This process has been accelerated by
development of machines and the increasing importance of technology with the motivation of productivity in the
economic processes.
Asian Economic and Financial Review
ISSN(e): 2222-6737/ISSN(p): 2305-2147
Development usually refers to economic progress, but it can also apply to political, social and technological progress as well. Therefore, development contains parameters related to human development instead of economic parameters unlike the concept of economic growth. However, it is seen that importance of economic parameters for development is irrefutable in a consequence development is directly associated with technology.
According to the literature relationship of technology between economic growth is vast instead of development. This difference results from the approach to technology. In neo-classical growth model of Solow (1956) technology is exogenous on the contrary, it is endogenous in new growth theory of Lucas (1988) and Romer (1990). Accordingly, in new growth theory technology is more closely to the indicators of human development (education, health, etc.).
On the other different variables are used as an indicator of technology in the studies related to development and technology. The study conducted by Fagerberg and Srholec (2008) on the relationship between technology and development consists of 75 countries in a different development levels and major of them are low and medium income level for the period 2000 to 2004. According to the results of their analyses there exists a strong relationship between technological capability, governance and social capital. Study of Hardy (1980) is one of the main studies that examined the relationship between economic development and per capita phone number as an indicator of technological development. It is concluded that effect of per capita number of phone on GDP is significant for 60 countries for the period 1960 to 1973. The other study on this subject conducted by Röller and Waverman (2001) on the relationship between per capita landline and investments on telecommunication is used the data for 21 OECD countries for the period 1970 to 1990. Findings of that study indicate that development of telecommunication investments effects the economic development. O’Mahony and Vecchi (2005) examined that ICT effect on growth of output for 55 non-agricultural market economy located in England and USA for the period 1976 to 2000. In that study it is used the pooled mean group estimator method. According to the results of the analysis information and telecommunication technologies has a positive effect on the growth of output.
On the other hand there exists studies on relationship between economic development, technology exports level and patent applications as an indicator of technological development. Atun et al. (2007) asserts that patents have an important effect on the economic growth. Moreover that study contains the explanations about patent has a positive effect on trade, productivity and profitability. Gani (2009) examined the relationship between technology exports and per capita economic growth for the countries with higher levels of technology. It is revealed that high technology exports exert a statistically significant positive effect on growth of the technological leader category of countries and a positive but statistically insignificant effect on the potential leader category of countries. Archibugi and Coco (2004) devise a new indicator (ArCo) for the technological capabilities that the index contains a number of variables associated with technological change. As a consequence, it is presented the correlation between ArCo & GDP.
Edwards (1998) analysed the robustness of the relationship between openness and total factor productivity growth for 93 countries. According to the results it is suggested that more open countries experienced faster productivity growth. According to the conclusion of the literature review, it is seen that variables related to technology are examined, however, results of the examinations have not been evaluated in the context of development. As a matter of fact that majority of the studies have been limited it selves by the reduction of technology to quantitative variable and also qualitative and methodological studies are not contained in these studies. In this study it is aimed to emphasize the importance of method and level of technology usage for development contrary to the approaches that accepted the accessibility of technology is necessary and enough for development. Therefore it is thought that this study included 55 countries in different development level contributes for the elimination of the deficiency in the literature.
2. CONCEPTUAL FRAMEWORK OF TECHNOLOGY
Consideration about the evolution of technology is vital in order to examine the conceptual framework of technology. At this point Drucker (1993) has provided for us a chronological backround as quoted below:
“Then, beginning after 1700 – and within an incredibly short 50 years- technology was invented. The very word is a manifesto in that it combined téchne, that is, the mystery of a craft skill, with logy, that is, organized, systematic,
purposeful knowledge. The first engineering school, the French Ecole des Ponts et Chaussées, was founded in 1747,
followed around 1770 in Germany by the first school of Agriculture and in 1776 by the first school of Mining. In 1794
the first technical university, the French Ecole Polytechnique, was founded, and with it, the profession of engineer.
Shortly thereafter, between 1820 and 1850, medical education and medical practice were reorganized as a systematic
technology.
In a parallel development, Britain, between 1750 and 1800, shifted from patents being monopolies to enrich
royal favorites to patents being granted to encourage the application of knowledge, tools, products and processes,
and to reward inventors provided they publish their inventions. This not only triggered a century of feverish
mechanical invention in Britain; it finished craft mystery and secretiveness.
The great document of this dramatic shift from skill to technology –one of the most important books in history-
was the Encyclopedia, edited between 1751 and 1772 by Denis Diderot (1713-1784) and Jean d’ Alembert
(1717-1783). This famous work attempted to together in organized and systematic form the knowledge of all crafts, and in
such a way that the non-apprentice could learn to be a “technologist”. It was by no means accidental that articles in
the Encyclopedia that describe an individual craft (e.g. spinning or weaving) were not written by craftsmen. They were written by “information specialists”: people trained as analysts, as mathematicians, as logicians – both Voltaire and Rousseau were contributors. The underlying thesis of the Encyclopedia was the effective results in the
material universe - in tools, processes and products – are produced by systematic analyses, and by systematic,
purposeful application of knowledge.”
Technology is defined as a word “industrial science; the science of systematic knowledge of the industrial arts, especially of the more important manufactures, as spinning, weaving, metallurgy, etc.”
On the other hand just the definition of the word is not enough for questioning the framework of technology, it would be also necessary etymological evaluation. Therefore etymological origin of technology is stated below:
Technology: 1610’s, “a discourse or treatise on an art or the arts”, from Greek technologia “systematic treatment of an art, craft or technique” originally referring to grammar, from tekhno (techno+logy). The meaning “study of mechanical and industrial arts” (Century Dictionary, 1902, gives examples of “spinning, metal-working, or brewing”) is first recorded 1859. High technology attested from 1964; short form high-tech is from 1972.
Techno: forming element meaning “art, craft, skill”, later “technical, technology”, from Latinized form of Greek tekhno-, combining form of tekhne “art, skill, craft in work; method, system, an art, a system or method of making or doing”, from PIE *teks-na- “craft” (of weawing or fabricating), from suffixed form of root *teks- “to weave, fabricate, make” (source also of Sanskrit taksan “carpenter”, Greek tekton “carpenter”, Latin texere “to weave”. According to the etymological structure of the word “technology” it consists of skill and knowledge jointly. Therefore it must be approached to “techno” and “knowledge” respectively for the purpose of evaluating technology properly.
Firstly “techno” is examined, it is seen that “techno” has already existed before the technology and the science in the historical process. This situation is declared by Ellul (1964) like that:
“The relation between science and technique is a standard subject for graduate theses-in all the trappings of nineteenth-century experimental science. Everyone has been taught that technique is an application of science; more
particularly (science being pure speculation), technique figures as the point of contact between material reality and
This traditional view is radically false. It takes into account only a Single category of science and only a short period
of time: it is true only for the physical sciences and for the nineteenth century. It is not possible therefore to base a
general study on it nor, as we are attempting to do here, an up-to-date review of the situation. A few simple remarks
suffice to destroy our confidence in these views. Historically, technique preceded science; even primitive man was
acquainted with certain techniques. The first techniques of Hellenistic civilization were Oriental; they were not
derived from Greek science. Thus historically speaking, the relationship between science and technique ought to be
reversed. However, technique began to develop and extend itself only after science appeared; to progress, technique had to wait for science”.
Secondly “knowledge” is examined, it is seen that there is need a comprehensive analysis for the knowledge especially for the formation process of it. Therefore formation process and usage of knowledge will be examined. It can be said that knowledge formation process differs or cannot be completed because of the fact that knowledge formation process arise from contact with subject and there exists differences related to quality and the transformation of this contact. According to this;
When the subject extend beyond the contact with data there exists a transformation in the subject. In this process there exists knowledge formation process with the transformation of the subject.
When the subject just contact with data but there is no more process, there is not exist a transformation in the subject. In this process, there exists just information formation process with the exception of subject transformation.
Diagram 1, stated below, is prepared for the purpose of understanding the knowledge formation process.
Diagram-1. Formation & Usage of Knowledge Source: Doğan and Topuz (2016)
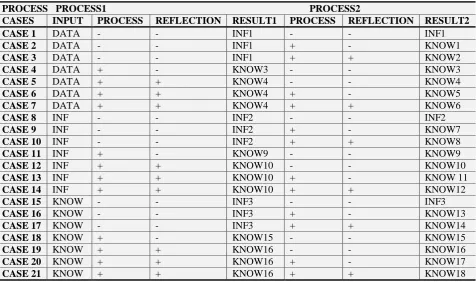
Table-1. Formation & Usage of Knowledge: Case Study PROCESS PROCESS1 PROCESS2
CASES INPUT PROCESS REFLECTION RESULT1 PROCESS REFLECTION RESULT2
CASE 1 DATA - - INF1 - - INF1
CASE 2 DATA - - INF1 + - KNOW1
CASE 3 DATA - - INF1 + + KNOW2
CASE 4 DATA + - KNOW3 - - KNOW3
CASE 5 DATA + + KNOW4 - - KNOW4
CASE 6 DATA + + KNOW4 + - KNOW5
CASE 7 DATA + + KNOW4 + + KNOW6
CASE 8 INF - - INF2 - - INF2
CASE 9 INF - - INF2 + - KNOW7
CASE 10 INF - - INF2 + + KNOW8
CASE 11 INF + - KNOW9 - - KNOW9
CASE 12 INF + + KNOW10 - - KNOW10
CASE 13 INF + + KNOW10 + - KNOW 11
CASE 14 INF + + KNOW10 + + KNOW12
CASE 15 KNOW - - INF3 - - INF3
CASE 16 KNOW - - INF3 + - KNOW13
CASE 17 KNOW - - INF3 + + KNOW14
CASE 18 KNOW + - KNOW15 - - KNOW15
CASE 19 KNOW + + KNOW16 - - KNOW16
CASE 20 KNOW + + KNOW16 + - KNOW17
CASE 21 KNOW + + KNOW16 + + KNOW18
Note: INF: Information, KNOW: Knowledge; “+”: process or reflection realized, “-“: process or reflection is not realized.
Source: Doğan and Topuz (2016)
Table essentially consists two process. Both of these process is prepared based on the different levels of process and reflections of inputs. First process contains 9 different cases by itself and independent from the Process 2. Second process that consists new cases arise from different information and knowledge level in each cases, arise from the end of Process 1. Therefore, it contains 21 different cases.
Process 1 ranges according to the differentiation of basic input of formation of knowledge and information. Information and knowledge in different levels result from the formations like “from data to information or knowledge” and “from information to information and knowledge” and “from knowledge to information and knowledge”.
Process 2 ranges according to differentiation of knowledge and information process due to processing or reflection of inputs in the Process 1.
When Process 1 and Process 2 is evaluated together, it is said that Process 2 is continuation of Process 1 and also Process 2 consists of comprehensive repetition of acts and increase of processing of inputs. Therefore differentiated information and knowledge level arise because of the differentiation of processing level of information and knowledge in each Step. According to this;
First seven case consists of the formation of information and knowledge process from the data. In these cases it is accepted that production of information and knowledge capacity is high. Because in these cases addition to the usage and transformation of formed information and knowledge, it is also gained information and knowledge quality to the data. The favorite case is Case7 which data is processed and reflected in each step.
Case 15-21 consists of the formation of information and knowledge process from the knowledge. In these cases it is accepted that production of information and knowledge capacity is lower than the first fourteen case. Because in these cases formation of information and knowledge is based on knowledge instead of data or information. The favorite case is Case21 which knowledge is processed and reflected in each step.
When all of the 21 cases are evaluated together it is accepted that the favorite case is Case7 because of the processing and reflection capacity.
It can be said that differentiations of skill and knowledge level covered by technology is determining on itself. However, it is expected that this differentiation is determining not only on technology level but also other parameters related to technology. One of the parameters associated with technology is economic growth. On the other hand it can be accepted that technological development level is much more related to knowledge instead of techno. Thus relationship between technology & development is more than the relationship between technology & economic growth due to the correlational and social features of knowledge. Consequently, there exists an econometrical analysis for the evaluation of relationship between development and technology.
3. ECONOMETRICAL METHOD AND DATA ANALYSIS
3.1. Data
The data used in this paper are annual and consist of 55 countries for the period 2000 to 2013. Countries and years have been selected according to the accessibility of the data. These countries are divided into two groups according to the ranks of Human Development Index and ICT Index in consideration of relationship between technology and human development. First group consists of 33 countries, with high ranking (a low numerical rank) and the second group consists of 22 countries, with low ranking (a high numerical rank). These countries are stated Table 2, as follows
Table-2. Country List
Group Countries
Group 1
Austria, Canada, Chile, Croatia, Czech Republic, Denmark, Estonia, Finland, France, Germany, Greece, Hong Kong, Hungary, Iceland, Ireland, Israel, Japan, Korea Republic, Latvia, Lithuania, Netherlands, New Zealand, Norway, Poland, Portugal, Russian Federation, Singapore, Slovak Republic, Spain, Sweden, Switzerland, UK, USA.
Group 2
Armenia, Brazil, Bulgaria, China, Colombia, Georgia, Guatemala, India, Jamaica, Jordan, Madagascar, Malaysia, Mexico, Moldova, Peru, Philippines, Romania, South Africa, Thailand, Tunisia, Turkey, Ukraine Source: These countries are grouped by the authors according to UNDP Human Development Index and ITU Global ICT Development Index.
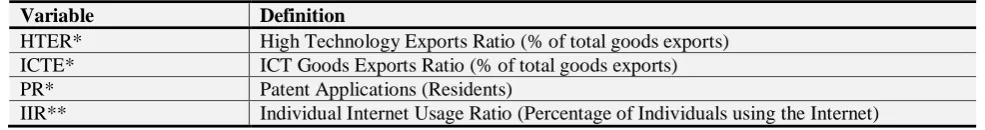
Symbols and definitions of the variables are as follows, Table 3.
Table-3. Details of Variables
Variable Definition
HTER* High Technology Exports Ratio (% of total goods exports) ICTE* ICT Goods Exports Ratio (% of total goods exports)
PR* Patent Applications (Residents)
IIR is obtained from statistics of International Telecommunication Union and all of the other variables are obtained from World Bank Data.
3.2. Methodology
In this analysis firstly it is examined the panel cross-section dependence before the examination of relationship between the variables. Lagrange multiplier tests proposed by Breusch and Pagan (1980); Pesaran (2004) and Pesaran
et al. (2008) are used for the cross section dependence. Series are examined with second generation Cross-Section Augmented Dickey-Fuller (CADF) test statistics formed by Pesaran (2007) contained cross-section dependency and Cross-Section Augmented IPS (CIPS) test statistics calculated by taking the averages. After the examination of stationary of the series, panel co-integration test is applied for the purpose of analyzing the long term relationship between the series. Finally, Vector Error Correction Model (VECM) is applied in order to ascertain the direction of relationship between the variables.
3.3. Panel Cross-Section Dependence Test
Panel cross-section dependence test ascertain the affection level of all cross-sections by reason of shocks. Ignorance of cross-sectional dependence might be problematic in the next step for selection of unit root tests. First generation unit root tests ignore the cross-sectional dependency, however second generation unit root tests take into consideration the cross-sectional dependency. Therefore ignorance of cross-sectional dependency causes the results being biased and inconsistent.
Lagrange multiplier (LM) test statistic proposed by Breusch and Pagan (1980) is based on the following LM statistic:
∑ ∑ ̂
(1)
LM test statistic ascertain the cross-sectional dependence in case of T>N, shows distribution with N fixed and as
.
Cross-sectional dependence is controlled with Pesaran (2004) test statistics in case of T=N and Pesaran (2004)CDLM test statistics in case of T<N. However test statictics is biased if average of group is zero but average of individuals is not zero. As a solution of this problem Pesaran et al. (2008) shows the reformulated CDLM test statistics like that:
√ ∑ ∑ [ ̂ ̂ ̂
]
(2)
Hypothesis of the test is No cross section dependence. : Cross section dependence.
In this paper results of test statistics are used because of the the existence of the case N>T. According to this it is ascertained that probability values of the variables are smaller than 0,05 except for the variable “PR”. Therefore it is concluded that there is a cross-sectional dependence in the series. Test results are reported Table 4.
3.4. Panel Unit Root Test
In this study stationarity of the series is analyzed by CADF and CIPS test statistics. Second generation unit root tests are used depending on the results of the analysis in the previous section. Pesaran (2007) presents an alternative test that contains cross sectional averages and first differences of ADF regression. Regression model of this test is as follows:
̅ ̅ (3)
Variables “ ̅ ” and ̅“ are calculated like that:
Existence of these variables demonstrates that cross-sectional dependence is considered in the model. Pesaran (2007) declared that results of these tests are reliable in case of small samples (N=T=10) and high cross-sectional dependence (Pesaran, 2007). Test statistics of coefficient shows CADF statistics. These test statistics compare with the critical values of Pesaran (2007) and it is decided that cross sectional data are stationary or not.
Table-4. Test Results of Cross-Sectional Dependence Group Variable Breusch-Pagan
)
Pesaran scaled
LM )
Bias-corrected scaled LM
Pesaran CD (CDLM)
Group 1
HTER 936,8034
(0,0000) 11,56455 (0,0000) 10,18955 (0,0000) 12,22170 (0,0000)**
ICTE 726,7405
(0,0000) 5,100311 (0,0000) 3,725311 (0,0002) 6,742713 (0,0000)**
PR 557,3481
(0,1821) -0,112378 (0,9105) -1,487378 (0,1369) 0,680213 (0,4964)
IIR 1028,246
(0,0000) 14,37849 (0,0000) 13,00349 (0,0000) 13,50126 (0,0000)** Group 2
HTER 247,3353
(0,2196) -0,263544 (0,7921) -1,180211 (0,2379) 3,822477 (0,0001)**
ICTE 297,1774
(0,0021) 2,055320 (0,0398) 1,138653 (0,2548) 5,519674 (0,0000)**
PR 280,7619
(0,0140) 1,291603 (0,1965) 0,374936 (0,7077) 0,637818 (0,5236)
IIR 409,5249
(0,0000) 7,282198 (0,0000) 6,365531 (0,0000) 5,401992 (0,0000)** Note: p values in parentheses. (**) significant at the %5 level.
CIPS (Cross-Section Augmented IPS) is an unit root test statistics for all of the panel and it is calculated by taking averages of CADF test statistics. It is as follows:
∑
(5)
Results of CIPS are evaluated according to the critical values calculated by simulation and contained in the table by Pesaran (2007). Null hypothesis and the alternative hypothesis are the same in each test. Non Stationary and Stationary. It is concluded that panel data series are non stationary if test statistics values of CIPS are bigger than critical values. The test results of unit root tests for levels and first differences are summarized in Table 5.
Table-5. Test Results of CIPS
Variables
Group Critical Value
Group 1 Group 2 % 10 % 5 % 1
LEVEL HTER -1,807 -2,238 -2,66 -2,76 -2,96
ICTE -2,086 -2,356 -2,66 -2,76 -2,96
PR -2,385 -2,348 -2,66 -2,76 -2,96
IIR -2,537 -1,925 -2,66 -2,76 -2,96
FIRST DIFFERENCE
DHTER -2,969 -3,186 -2,14 -2,25 -2,45
DICTE -3,208 -3,570 -2,14 -2,25 -2,45
DPR -3,501 -3,335 -2,14 -2,25 -2,45
DIIR -3,513 -2,720 -2,14 -2,25 -2,45
Source: Author’s estimations.
the first difference level. Panel co-integration test and the vector error correction model is applied due to the fact that all of the series are stationary at first differences.
3.5. Panel Co-integration Test
It is used panel co-integration analyses for the presence of long-run relationships among integrated variables with both a time-series dimension and a cross sectional dimension. Johansen (1988) has developed two different likelihood ratio test in order to ascertain co-integration relation in the non-stationary series.
( ̂ ) (6)
∑ ̂ (7)
Equations relating to Maximum eigenvalue and trace test are respectively stated Equation 6 and Equation 7. The null hypothesis for the trace test is that the number of co-integration vectors is r=r*<k, and the alternative that r=k. The null hypothesis for the Maximum eigenvalue test is that the number of co-integration vectors is r=k, and the alternative that r=r*+1.
Johansen Fisher panel integration test uses Johansen integration test results in order to calculate the co-integration relation. Maddala and Wu (1999) define Fisher type test statistics is as follows:
∑ (8)
value refers to individual test statistics for country i. Test statistic value has 2N degree of freedom and distribution.
Trace and Max Eigenvalue test statistics are both of them used for analyses, however, Johansen results do not contain equal number of co-integration vector. If it is concluded different results from each of the test statistics, maximum eigenvalue test results are preferred. Because it consists an advantage obtaining different test result in each eigenvalue (Lee and Brahmasrene, 2013).
Table-6. Test Results of Co-integration
Group
Hypothesized Fisher Stat.* Fisher Stat.*
No. of CE(s) (from trace test) Prob. (from max-eigen test) Prob.
Group 1
None 148.0 0.0000 148.0 0.0000
At most 1 522.7 0.0000 522.7 0.0000
At most 2 242.6 0.0000 207.2 0.0000
At most 3 146.5 0.0000 146.5 0.0000
Group 2
None 115.7 0.0000 115.7 0.0000
At most 1 371.2 0.0000 371.2 0.0000
At most 2 215.5 0.0000 177.6 0.0000
At most 3 126.2 0.0000 126.2 0.0000
Note: Co-integration test is applied under the condition of “intercept and no trend”.
According to Johansen Fisher Co-integration test results stated above Table 6, there is a long term co-integration between the series.
3.6. Vector Error Correction Model
long term effects. If the dependent variable is driven directly by this long-run equilibrium error, then it is responding to this feedback. If not, it is responding only to short-term shocks to the stochastic environment. F test contains short term causality and T test derive from long term co-integration, contains lagged error correction term provide an information. The coefficient of the lagged error-correction term, however, is a short-term adjustment coefficient and represents the proportion by which the long-run disequilibrium (or imbalance) in the dependent variable is being corrected in each short period (Masih and Masih, 1997).
Vector Error Correction Model is as follows:
∑
∑
∑ ∑
In the equation represents error correction parameter; denotes first differences; k is the optimal lag length determined by the Akaike and Schwarz Criterion; , , and represent effects of the divergences arised in the short term; ECT (Error Correction Term) represents the error terms derived from the long run co -integrating relationship. Therefore the model allows to test for short run and long run causality. The empirical model is represented by the following 4 equation VECM.
∑
∑
∑ ∑
∑
∑
∑ ∑
∑
∑
∑ ∑
∑
∑
∑ ∑
The causality pattern between the variables evaluated with the VECMs are reported in Table 7.
According to results of Vector Error Correction Model;
For Group 1: There is a bi-directional Granger Causality between DHTER, DICTE, DIIR and there is an one directional Granger Causality from DHTER, DICTE, DIIR to DPR.
Table-7. Test Results of VECM
Group Independent Variables
Dependent Variables
DHTER DICTE DPR DIIR
Group 1
DHTER - -1,052609
(0,0000)
-1,069045 (0,0000)
-1,011339 (0,0000)
DICTE -0,033044
(0,0000)
- -0,901932
(0,0000)
-0,659545 (0,0000)
DPR -0,002684
(0,5097)
0,001864 (0,5917)
- -0,007322
(0,1385)
DIIR -0,092119
(0,0014) -0,294243 (0,0000) -0,717795 (0,0000) - Group 2
DHTER - -0,036725
(0,4347)
0,000804 (0,6447)
-0,464510 (0,0000)
DICTE -1,262025
(0,0000)
- 0,000667
(0,8539)
-1,234462 (0,0000)
DPR 0,950604
(0,0000)
0,949859 (0,0000)
- 0,952807
(0,0000)
DIIR -0,240354
(0,0000) -0,004209 (0,5779) -0,000578 (0,8134) -
Note: Values represent C (1) and p values in parentheses.
4. EVALUATION
In this study based on evaluation of relationship between technology and development, it is examined that required technology level and the usage method of technology beyond the requirement of technology for development. This examination contains relationship between High Technology export ratio, ICT ratio, patent applications as an indicator of knowledge and usage of individual internet ratio as an indicator of techno for 55 countries different development and technology level. According to the analysis it is concluded that there is a relationship between the indicators of knowledge (DHTER, DIIR, DPR) for the developed countries in opposition to the developing countries. Moreover it is seen that relationship between indicator of techno (DIIR) and the indicators of knowledge is more in the developed countries than the developing countries. These results are examined according to Table 1 as follows;
Variables tests formation of techno and knowledge based on data are not included in this analysis. Therefore analysis represent these cases cannot be examined in this study (Case: 1-7).
For Developed Countries (Group 1) it can be concluded that
Formation of knowledge based on techno is realized due to the existence of relationship from individual internet usage ratio to high technology export ratio, ICT ratio and patent applications (Table 1: Case: 11-14 ).
Formation of knowledge from knowledge is realized due to the existence of relationship from high technology export ratio and ICT ratio to patent applications (Table 1: Case: 18-21).
For Developing Countries (Group 2) it can be concluded that formation of knowledge based on techno is realized due to the existence of relationship from individual internet usage ratio to high technology export ratio (Table 1: Case: 11-14).
On the other hand Graphs, stated below, are prepared for the purpose of questioning the approaches based on technology is the basic motivation of development and developed countries have high technology level.
Graph-1. ICT Exports & Imports Ratio (as a percentage of total exports & imports) for Developing Countries Source: It is prepared by the authors via calculation of the data from World Bank Data.
According to Graph 1 there is a dramatic difference between ICT imports and ICT exports in favor of imports against to exports. However, four countries (China, Malaysia, Mexico, Thailand) opposed to the overall position.
Graph-2. ICT Exports & Imports Ratio (as a percentage of total exports & imports) for Developed Countries Source: It is prepared by the authors via calculation of the data from World Bank Data.
When Graph 1 and Graph 2 is evaluated together, it is examined that the countries in a high ICT international trade level are included in the developing countries and also the countries in a low ICT international trade level are included in the developed countries. Therefore these graphs show that technology by itself cannot be the motivation of development and the technology level of developed countries is more than the developing countries. Technology obviously is an important indicator of development. If technology is crucial for the development as it is supposed, the 4 country (China, Malaysia, Mexico, Thailand) within the developing countries would be within the developed countries and also some of the countries like New Zealand, Norway would be within the developing countries. Consequently, it can be said that technology cannot provide development by itself, for the development technology is necessary but the most important thing is using the technology in the process of knowledge formation and provides the transformation of technology to knowledge.
5. CONCLUSION
When the studies related to technology and development are examined, it is seen that technology is reduced to quantitative element and also examined with economic growth instead of development. The reason of this situation is that technology consisting of a combination of skills and knowledge, is accepted just as the skill (techno) instead of knowledge. In this study initially it is examined the conceptual framework of technology.
Then technology, data which contains skill (techno) and knowledge is analyzed for the countries of different development level. According to the analyses it is concluded that technology should be examined with the formation of knowledge and also evaluations in the scope of development, accepted the technology just as the quantitative data cannot be acceptable.
In this context it can be said that differences between the developed and developing countries result from approaches to technology instead of accessibility to technology. For the detection of this situation causality analyses is applied used the data High Technology Export Ratio, ICT export ratio, patent applications and individual internet usage ratio for 55 countries in a different development level for the period 2000 to 2013.
Results of this analyses are evaluated with the graphs related to ICT exports and ICT imports level. According to the evaluations developed and developing countries both of them can access to the technology, however technology is used as an input in developed countries; on the contrary technology is used just as a final good in developing countries.
Finally, it is suggested that technology should be used as a process provided the transformation of technology to knowledge in opposition to be used just as the quantitative input of development. Therefore relationship between technology and development is examined in the scope of knowledge. Moreover development policies of the states also contains the measurements provided the increase of skilled labor instead of the technicians just use the technology.
Funding: This study received no specific financial support.
Competing Interests: The authors declare that they have no competing interests.
Contributors/Acknowledgement: All authors contributed equally to the conception and design of the study.
REFERENCES
Archibugi, D. and A. Coco, 2004. A new indicator of technological capabilities for developed and developing countries (ArCo).
World Development, 32(4): 629–654.
Atun, R.A., I. Harvey and J. Wild, 2007. Innovation, patents and economic growth. International Journal of Innovation
Breusch, T.S. and A.R. Pagan, 1980. The lagrange multiplier test and its applications to model specification tests in econometrics.
Review of Economic Studies, 47(1): 239-253.
Doğan, E. and S.G. Topuz, 2016. Critical approach to knowledge society concept in Turkey in the scope of economics.
Sosyoekonomi, 24(29): 257-283.
Drucker, P.F., 1993. Post-capitalist society. 1st Edn., Oxford: Butterworth-Heinemann Ltd.
Edwards, S., 1998. Openness, productıvıty and growth: What do we really know? Economic Journal, 4108(March): 383-398.
Ellul, J., 1964. The technological society. NewYork: Vintage Books A Division of Random House.
Engle, R.F. and C.W.J. Granger, 1987. Cointegration and error correction: Representation, estimation and testing. Econometrica,
55(2): 251-276.
Fagerberg, J. and M. Srholec, 2008. Technology and development: Unpacking the relationship (s) (No. 20080623). Centre for
Technology, Innovation and Culture, University of Oslo.
Gani, A., 2009. Technological achievement, high technology exports and growth. Journal of Comparative International
Management, 12(2): 31-47.
Hardy, A., 1980. The role of the telephone in economic development. Telecommunications Policy, 4(4): 278–286.
Johansen, S., 1988. Statistical analysis of cointegration vectors. Journal of Economic Dynamics and Control, 12(2): 231-254.
Lee, J.W. and T. Brahmasrene, 2013. Investigating the influence of tourism on economic growth and carbon emissions: Evidence
from panel analysis of the European union. Tourism Management, 38(2013): 69-76.
Lucas, R.E., 1988. On the mechanics of economic development. Journal of Monetary Economics, 22(1): 3-42.
Maddala, G.S. and S. Wu, 1999. A comparative study of unit root tests with panel data and a new simple test. Oxford Bulletin of
Economics and Statistics, 61(S1): 631-652.
Masih, A.M. and R. Masih, 1997. On the temporal causal relationship between energy consumption, real income, and prices: Some
new evidence from Asian-energy dependent nıcs based on a multivariate cointegration/vector error-correction approach.
Journal of Policy Modeling, 19(4): 417-440.
O’Mahony, M. and M. Vecchi, 2005. Quantifying the impact of ICT capital on output growth: A heterogeneous dynamic panel
approach. Economica, 72(288): 615– 633.
Pesaran, M.H., 2004. General diagnostic tests for cross section dependence in panels. Cambridge Working Papers in Economics,
No: 435.
Pesaran, M.H., 2007. A simple panel unit root test in the presence of cross-section dependence. Journal of Applied Econometrics,
22(2): 265–312.
Pesaran, M.H., A. Ullah and T. Yamagata, 2008. A bias-adjusted LM test of error cross-section independence. Econometrics
Journal, 11(1): 105-127.
Röller, L.H. and L. Waverman, 2001. Telecommunications infrastructure and economic development: A simultaneous approach.
American Economic Review, 91(4): 909–923.
Romer, P.M., 1990. Endogenous technological change. Journal of Political Economy, 98(5): 71-102.
Solow, M.S., 1956. A contribution to the theory of economic growth. Quarterly Journal of Economics, 70(1): 65-94.
BIBLIOGRAPHY
http://data.worldbank.org/products/wdi.
http://hdr.undp.org/sites/default/files/2015_human_development_report.pdf.
http://www.itu.int/en/ITU-D/Statistics/Pages/stat/default.aspx.
http://www.itu.int/net4/ITU-D/idi/2015/.
Online Etimology Dictionary, Technology. Available from
http://www.etymonline.com/index.php?allowed_in_frame=0&search=technology [Accessed 19.06.2016].
Webster’s Online Dictionary, Technology. Available from http://www.webster-dictionary.org/definition/technology [Accessed
19.06.2016].