Abstract— In today’s world, technology strategy development for industries is one of the most important tasks in proposing technology roadmap. Moreover, identifying strategic technology is main part of strategy development. This article tries to apply MCDM methods in finding key strategic technologies from identified technologies from in order to provide appropriate technology strategy. TOPSIS method helps in finding key strategic technologies from identified technologies from in order to provide appropriate technology strategy. At last Efficient TOPSIS method used for determining key strategic technology in Auto Company and key technology are derived from identified technology so as to develop technology strategy.
Index Terms— Multiple criteria decision analysis, TOPSIS, Distance-based ranking, Key Technology, Technology management
I. INTRODUCTION
ODAY, technology plays a crucial role in firms’ competitiveness. It needs therefore, like other sources of competition, to be managed based on a strategic point of view. The first and most important step of technology management is to develop a long-term strategic plan which determines firm’s investment priorities and preferences in the field technology development, called “Technology Strategy”.
TS is concerned with, but not limited to, the following questions [Lindsay 1999]:
1. What are the technologies which the company’s sustainable competitiveness depends on?
2. Are these technologies all available or feasible? 3. What are the appropriate ways of acquisition for those technologies should be acquired from outside?
4. How can we ensure that we make best ROI in technological assets/ capabilities/ competencies?
Different models and frameworks have been developed by practitioners as well as academicians in order to help companies’ top manager in TS formulation. But, firms in different sectors, with different sizes and thus different characteristics may find it difficult to choose the proper model, the most pertinent to their own situation. This is because for majority of firms’ managers is difficult to identify differences between models. While, for selecting an appropriate model, we should be able to compare different
Manuscript received November 23, 2010; revised January 12, 2011. Aliakbar Mazlomi is Department of Mechanical and Manufacturing Engineering, Universiti Putra Malaysia 43400 UPM, Serdang MALAYSIA (corresponding author to provide phone: 03-8946 6341/6335; fax: 03-8946 6335; e-mail: aam@ eng.upm.edu.my).
Rosnah bt. Mohd. Yusuff was Department of Mechanical and Manufacturing Engineering, Universiti Putra Malaysia 43400 UPM, Serdang MALAYSIA (e-mail: [email protected]).
models and be aware of their strengths and weaknesses and their limits of applications.
This paper uses TOPSIS method in finding key strategic technologies from identified technologies from in order to provide appropriate technology strategy. Identifying strategic technology is main part of strategy development. Efficient TOPSIS method for determining key strategic technology helps decision maker in decision about strategic technology strategy development.
II. CONCEPT AND DEFINITIONS
A. Strategy
1) Assigning long time objectives of an organization and chose action for allocation sources in order to achieve goals [1].
2) A procedure of assigning organization objectives for long time, executive plan and priority in sources allocation [2]. 3) A design and or plan in order to array fundamental objectives, policy, organization constant action drastically [3].
B. Technology strategy
1) Institute decision regarding to investment, development, applying technology of production and processes [4].
2) Assigning investment priority on technology development with considering long time objectives [5]. 3) Technology strategy is an operation strategy and interpreted as organization general strategy on technology context, a prior situation or gaining long run objectives assigned by technology development [6].
According to Drejer who in 1996 presented historical classification of different procedures of technology management, generally, these procedures are:[16]
R&D management,
innovation management,
technology planning,
strategic management of technology
each of which has been considered by institution in different time intervals. Important point in examination of historical path of different views on technology in interactions of organizations.
C. Operation strategy
Operation strategy is organization general strategy in a specific segment, in other hand a way of fulfilling general strategy in the segment of organization [7].
D. Benchmarking
Finding other firms function fulfilled better in order to implementing them and or improves it [8].
On the Use of MCDM Technique for Identifying
Key Technology: A Case of Auto Company
Aliakbar Mazlomi, Rosnah bt. Mohd. Yusuff
E. Strategic planning
1) A process encompasses sources allocation for gaining organization and general goals and mission in competitive environment [9].
2) Assign and build organization mission and long run objectives and achieving a way to gain goals [10].
F. Technology
According to dictionary the meaning of technology is scientific study, engineering and scientific application use [11].
A scientific use of science in order to human needs provision [12].
Skill and science required for producing goods and or providing services resulting from mental ability and human perspectives and existed fundamental and phenomenal regulation combination [13].
Technology encompasses the whole factors which cause an idea to be changed to product. And lead to increasing income and entails factors such as reconstruction of main activity product technology, process technology, skills and know how, systems and experiences, data services, supporting, logistics, and management approaches [14].
In a simple language, technology is ability entails skills and science, and could be studied in here context: 1. Product technology, 2. Process technology and 3. Management procedures.
1. Product technology
A kind of technologies which are used in combination of goods and services and could be perceived via discipline and application contexts [15].
2. Process technology
A kind of technologies which are used in producing of a goods process could be perceived via four factors: hardware, info ware, human ware and or aware [16].
3. Management procedures
Contains techniques and procedures for handling administrative better, total quality management (TQM), just in time, risk management, and so on.
G. Technologyselection
Technology as a major source of competitive advantage for manufacturing industries is widely accepted by practitioners, governments and academics. An enterprise can waste its competitive advantages by investing in wrong alternatives at the wrong time or by investing too much in the right ones (Torkkeli & Tuominen, 2002). A country can obtain its competitive advantages by investing in emerging technologies with comparative advantages (Lee & Song, 2007; Yu et al., 1998). In order to realize this competitive advantage, it is vital to understand both the specific technologies, and the ways in which organizations can best manage technology (Phaal, Farrukh, & Probert, 2001). Gregory (1995) has proposed that management of technology is comprised of five generic processes: identification, selection, acquisition, exploitation, and protection.
Among these processes, technology selection is defined as involving the choice of technologies that should be supported and promoted (Gregory, 1995). In the phase of technology selection, decision makers have to gather information from various sources about the alternatives, and
evaluate these alternatives against each other or some set of criteria (Lamb & Gregory, 1997). Accordingly, Gregory (1995) separates the ‘‘identification” and ‘‘selection” phases where the former is concerned with gathering alternatives and the latter is concerned with the action to decide on an alternative. In contrast, Dussauge, Hart, and Ramanatsoa (1992) define the technology selection process as identification and selection of new or additional technologies which the firm seeks to master. In sum, a key theme in these definitions is that technology selection is a ‘‘process” that is closely linked to organizational objectives and is associated with the broader technological and market environment (Shehabuddeen, Probert, & Phaal, 2006; Stacey & Ashton, 1990).
However, it is becoming more difficult to identify the right technologies because the number of technologies is increasing and the technologies are becoming more and more complex (Torkkeli & Tuominen, 2002). Additionally, decision makers need to face other challenges such the rising cost of technological development, abundance of technological options, and rapid diffusion of technologies (Berry & Taggart, 1994; Lei, 2000; Steensma & Fairbank, 1999). For example, technology accounts on average for more than one-third of all business capital spending (Bakos, 1998). The abundance abundance and complexity of technological options makes the task of accessing suitable technologies and selection of the most suitable option more difficult (Cantwell, 1992). Ronde (2001) selects 98 specific technologies of future possibilities in the field of biotechnology in France. Using the same foresight technique, Ronde (2003) respectively introduces 40, 51, 39 and 50 potential areas in the fields of elementary particles, energy, natural resources and environment for Germany and France. Lee and Song (2007) also provide 56 research areas in nano-technology field for South Korea.
Besides the increasing cost of technological development and the abundance of technology options, many studies have shown that companies fail to assess new technologies. Hackett (1990) and Greenberg and Canzoneri (1995) point out that projects to incorporate new technology in a majority of companies are failing or are not fulfilling expectations. Huang and Mak (1999) argue that the failure of a chosen technology often results from poor management and assessment. Some of the causes have been attributed to the inability to consider the wider relationship of technology to the industrial context and the technology investments (Schroder & Sohal, 1999). These studies demonstrate the necessity for a careful assessment to overcome the difficulties of technology selection before introducing a new technology (Efstathiades, Tassou, Oxinos, & Antoniou, 2000).
III. TECHNOLOGY STRATEGY MODELS
A. Porter Model (1980)
commercial action’s area and situation of that area’s changes.[33]
B. Mogen model (1982)
In this model, technology strategy development process includes four main stages or steps, shown in the below figure. In Mogen model, after identifying institution’s important technology, it’s necessary to perform evolution of this technology, Mogen specially considers two groups of: 1. basic criteria, technology’ attractiveness evaluation criteria, 2. and criteria of ability evolution of proposed institution in identified technology’s area.
C. Porter- Mogen composite model(1884)
deficits of Porter model for not presenting a clear way to evaluate attractiveness and ability of identified technologies as well as developing technology strategy based on those evolutions, are solved by use of tools presented by Mogen (attractiveness-ability matrix). In order to determine investment priorities and its proper methods., Identification of technologic changes procedure in key technologies of organization that was considered as one of critical steps in Porter model, is also important indirectly in Porter- Marin composite model and performed in step of attractiveness evaluation of selected technologies for investment of the composite model.
D. Hax and Mazlov model (1984 and 1991)
A valuable work to understand technology strategy
Their conceptual and mental theme was based on Poter framework.
Their theory specially made clear classification of the main decision- makings related to technology strategy[5,31].
In this model, institution considering its mission, strength & weakness points, strategic threats and its competitive plans, should provide macro- strategy.. By developing this strategy, technological requirements field is specified in macro form.
E. Chaplet and Twistiga model(1984)
Chaplet and Twistiga model(1984)believe that technology development strategy of an organization should be developed considering key factors of success in the market (KFS). From their view, key factors of success are a set of needs, requirements and demands which are applied to the organization by customers, suppliers, rivals, distribution channels, government and ect. Level of success or failure of organization, severely depends on their level of proper, timely and fast responsiveness to KFS s in the market.
F. Little model(1987)
Unlike chaplet & twistiga, some of other researchers believe that technology must be based on core competencies or in other words, basic capabilities of the organization. It's clear that paying attention to requirements, needs and demands of the market is necessary for survival of the organizations but organizations have different abilities in providing for demands and needs. In development process of technology strategy and making decision about that which technologies are important and what actions are required for their development, managers naturally tends to
begin with technology without considering other considerations.
G. Booz - Alen & Hamilton (1981)
A method for technology strategic management which is based on the following:[38]
Path & time required for gradual development of required technology could be determined by pervious knowledge and anticipation.
Technology should be seen as a capital asset.
Homogeneity of investment in technology and commercial strategy fields is a necessary fact which leads to successful technology management.
H. Mc Kenzy model[1998]
In 1998, Foster presented another theory which focused on technologic changes and institution's ability to facing them. Base of analysis is S diagram behavior. In the beginning of a R&D progress in this stage is slow, then progress rate increases and finally, considering its limitations, technology is formed and progress rate becomes slow.
Now it's time to move toward another technology management which has more fluent changes. Foster suggests that finding technological decline (decadence) of existing technologies is very important. Technological decline effects in an institution are:
decrease of R&D efficiency of the institution
orientation of the institution toward losing last R&D opportunities
change from R&D based on product to R&D based on process
change in sell growth resources toward a little section of market share
tendency toward important changes among rivals for investment on R&D
unsatisfaction of performing an emerging R&D management orientation toward competition with smaller & weaker rivals in industries.
I. Parhald and hamel capacity theory (1989)
J. D Aveni's ultro-competitive theory(1994)
In 1994, D "Aveni emphasized that dynamic property of competition is so intrinsically deep that it couldn't be considered as a secondary subject in strategic thinking. He emphasized that markets, are so changing and dynamic that evolution is the most basic power in strategic actions. In thoughts based on resources, the most important aspect of competition is not current situation of the institution but changes are made by dynamic interactions of competing firms.
K. Itami and Numagmi model(1992)
In 1992, Itami & Numagami performed an interesting examination about dynamic interaction between technology and strategy. Based on this, there are three kinds of interaction between strategy and technology:
Interaction between current strategy and current technology
Interaction between current strategy and future technology
Interaction between future strategy and current technology
First case which is introduced as abilities of strategy in technology focuses on simultaneous consistency between institution's strategy and adoption of proposed technologies. Basic hypothesis is that technology could influence strategy in three ways:
As an amour which distinguishes the institution from it's rivals.
As a limitation with which institution should become consistent
As a threat against which institution should protect itself
L. Chieza model.(2001)
Technology strategy formulation in dynamic environments of this section presents a structure of formulate technology in competitive dynamic environment. In the past section, basic principles and key characteristics of technology strategy formulation in dynamic environment were defined.
Decisions are made based on data collected from future form of competition & industry, technologic advances prediction and evolution of internal & external environments. This data collection provides base of future scenarios, which is consistent with strategy foundation. This step is called future- recording of environment and is the key to enter decision-making step.
IV. OVERVIEWS OF MCDM AND TOPSIS
A. MCDM technique
The analysis of an MCDA problem can be summarized as the following three steps (Chen, Kilgour, & Hipel, 2006): (1) Problem construction, in which the DMs objectives are identified, all possible alternatives are identified, and criteria are determined where by Successes in achieving the objectives are measured; (2) Preference Elicitation and aggregation, in which the DMs preferences within and across criteria are obtained and aggregated; (3) Implementation, in which a constructed preference model is
utilized to evaluate all alternatives, there by the “problématique” selected by the can be solved. The analysis results can be employed as an aid to the actual decision making process.
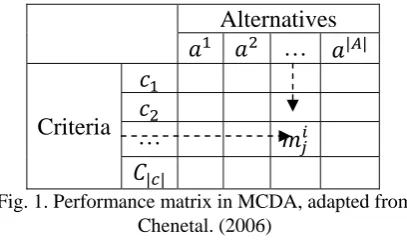
[image:4.595.324.528.265.385.2]Step (1) aims to structure an MCDA problem. Let the set of alternatives be
, … ,
, … ,
| | and the set of criteria be, … , , … ,
| | , where | | represents the cardinality of a set . When step (1) is completed, the consequence of alternative on criterion , denoted by , will be measured for every1, … , | | and
1, … , | |, constituting the
,
entry of a | | ∗ | | matrix called the information (or performance)matrix. The structure of this matrix is shown in Fig.1. Note that a consequence is a direct measurement of an alternative according to a criterionAlternatives
…
| |Criteria
…
| |
Fig. 1. Performance matrix in MCDA, adapted from Chenetal. (2006)
(e.g. cost in dollars). Generally speaking, a consequence is an objective physical measurement.
The DMs preferences are crucial in reaching a final recommendation for an MCDA problem, and different approaches to modeling preferences of the same problem may lead to different conclusions. Formally, as we interpret MCDA procedures, a DM may have preferences on consequences, called values, and preferences over criteria referred to as weights.
Preferences on consequences, or values, are refined data obtained by processing consequences (original and raw information) according to the needs and objectives of the DM. This is a necessary step to convert and normalize consequences in to a common comparative ground as consequences on different criteria of ten assume significantly different formats. The general relationship between consequences and values can be expressed as a mapping from consequences to values,
where ) and
are a value and a consequence
measurement, respectively. The DM’s values overall criteria for alternative constitute a value vector,, … ,
| | . It is often assumed that criteria are preference monotonic along consequences: (1) benefit criteria: the larger the consequence value, the better; (2) cost criteria: the smaller the consequence value, the better.Preferences on criteria, or weights, refer to expressions of the relative importance of criteria. The weight for criterion
∈
is denoted by∈
, usually it is required thatby
, … ,
, … ,
| | . After an MCDA problem is structured and preferences are obtained, a global model is required to aggregate preferences and solve the specified problématique. For∈
the overall evaluation of alternativeis denoted by
∈
where,
. Here,.
is a real-valued mapping from the value vector and the weight vector to a numerical evaluation of . A typical example is the linear additive value function,∑
| |.
(Hwang & Yoon, 1981).
B. The TOPSIS method
The TOPSIS analysis procedure can be summarized as the following steps (Shihetal., 2007):
Construct a performance matrix: establish a
| | ∗ | | matrix called the performance
(information, decision) matrix as shown in Fig. 1. Normalize the performance matrix: Apply a normalization process to the performance matrix to convert the original consequence data to values. Assume that ∀
∈
three widely used normalization functions, mapping fromto
0
1
are listed below (Chen,Kilgour, & Hipel, 2010; Chen, (1) Vector normalization:
∑| | ;
(2) Sum-based normalization:
∑| | .
(3) Min-Max-based normalization: | |
(
is a benefit criterion) and
| |
( is a cost criterion);
Define ideal and anti-ideal points: set an ideal point, , and an anti-ideal point, , as the combination of maximum or minimum values of for all
∈
and∈
, respectively. For example, for a benefit criterion , using vectornormalization, | | and
| | .
Assign weights to criteria: set (
∈
and∑
| |1
) to represent the relative importance of the criterion, . Calculate the distances from to : the p-norm distance functions
| |
| | /
(1)
and
| |
| | /
(2) are often employed, where p is a pre-defined distance norm, usually set as 1 or 2; and | | represents the absolute value of .
Obtain an overall assessment of : construct an overall distance function for
to aggregate the
aforesaid two distances into a final evaluation result. The overall distancecan be
expressed as Hwang and Yoon (1981)(3)
Obviously, a large values of represents a better overall performance.
C. Hypothetical scenarios for the future
1. Expansion strategy NGV stations due to lack of development and lack of adequate levels in the reservoirs locating insoles stop.
2. With government support use of NGV in the market increases, but due to the relatively limited growth rate and position limited survey, the production of two burnt cars still be on the agenda. 3. Growth and rapid expansion of fuel stations in
terms of number and distribution in the country with the change in the insoles vehicles, specifically the possibility of selling natural gas vehicles and two vehicles burnt with the petrol tank of less than 14 liters built only for emergencies, be provided.
D. Classified in terms of access technologies
- Technologies in the production stage
Technologies are already available for manufacturers and suppliers, and its well known to use whenever they decide to be in the car are applying.
- Technologies in the commercialization stage Past research stage, and by a limited number of suppliers and manufacturers are commercial but still they continue to develop and standardize.
- Technologies in development stage
E. Engine Technologies
1. Technologies in the production stage
Reduce mechanical friction and other losses / Hydrodynamic
Utilizing advanced low-friction oils
A multi-valve mechanism (more than two valves per cylinder) so camshaft
variable valve timing (VVT)
Variable valve timing and displacement (VVLT)
Inactivation cylinders
Develop and improve side components
Engine downsizing with bulimia
Multi-track weather variables (VLM)
Engine style building with plastic materials
2. Technologies in the commercialization stage
Suffocation valve engine through the air (IVT)
Astoqumetric direct injection gasoline engines (GDI)
3. Technologies in development stage
Direct injection engines, fuel poor (Lean Burn GDI)
Cam valve without stimulation (CVA)
Two types of CAM to stimulate valves
Variable compression ratio (VCR)
[image:6.595.307.542.85.758.2] Auto ignition under (HCCI)
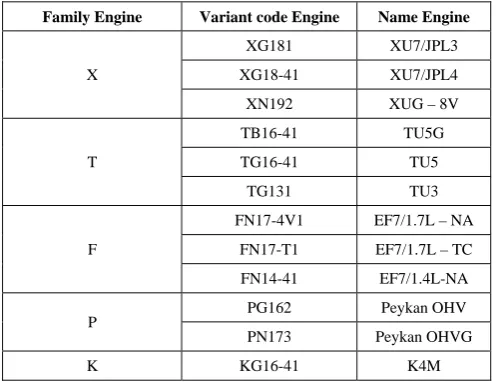
Table 1- List of current and developing engines of vehicles Engine
Family
Engine EngineVariant code Name
X
1 XG18
XU7/JPL3
1 XG18-4
XU7/JPL4
2
XN19 XUG – 8V
T
1 TB16-4
TU5G
1 TG16-4
TU5
1 TG13
TU3
F
1
FN17-4V EF7/1.7L – NA
1
FN17-T EF7/1.7L – TC
1 FN14-4
EF7/1.4L-NA
P Peykan PG162 OHV
3 PN17
Peykan OHVG
K K4MKG16-41
F. Evaluation Factors
- Fuel Reduction Co2 (% or qualitative) - Emission reduction (Nox)
- Drivability increscent
[image:6.595.50.300.400.591.2]G. Identified Technology
Table 2- List of IdentifiedTechnology
No. Identified Technology
1 Closed Coupled Catalyst
2 Palladium Containing Catalyst
3 Catalyst Design & Formulation
4 Cold Start Retard & Enlearnment
5 Rich Start & Secondary Air
6 Transient Adaptive Learning
7 EGR
8 Fast Light-off Lambda sensors
9 Electrical Heated Catalyst
10 Gasoline Burner
11 Exhaust Gas Ignition
12 HC Trapping Systems
13 GDI Lean Burn
14 GDI Stoch.
15 Nox Cat.
16 Controlled Auto Ignition
17 VVT
18 VCR
19 Low Idle Speed
20 Cylinder Deactivation
21 Electric Accessories
22 AMT
23 Lock-up Zone
24 Turbo Charging
25 Supper Charging
26 Low Crevice Volumes
27 Start Catalyst
28 Double-wall Exhaust Pipe
29 Exhaust line with low thermal
30 Dual oxygen sensors
31 Sequential fuel injection
32 Model based transient control
33 Model based canister purge
34 Canister load adaptation
35 4 V
36 Magnesium Alloies Material
37 VLM
38 V-TECH(lift-timing)
39 Assy Cams
40 Direct Oil Pump
41 HCCI
H. Deriving Key Technology by TOPSIS Method
Table 3- List of SelectedTechnology
No. Selected Technology
1 VCR
2 Low Idle Speed
3 Cylinder Deactivation
4 Electric Accessories
5 Magnesium Alloies Material
6 Oil Pump Controling
7 GDI Lean Burn
8 GDI Stoch
9 Controlled Auto Ignition
10 VVLT
11 VVT(full or intake)
12 Turbo Charging
13 Supper Charging
14 4 V (Multi Valve)
15 VLM (Variable Length Manifold)
16 V-TECH(lift-timing)
17 HCCI
18 Direct Oil Pump
V. CONCLUSION
This paper applies TOPSIS method in finding key strategic technologies from identified technologies from in order to provide appropriate technology strategy. Identifying strategic technology is main part of strategy development. Efficient TOPSIS method for determining key strategic technology helps decision maker in decision about strategic technology strategy development.
REFERENCES
[1] G. O. Young, “Synthetic structure of industrial plastics (Book style with paper title and editor),” in Plastics, 2nd ed. vol. 3, J. Peters, Ed. New York: McGraw-Hill, 1964, pp. 15–64.
[2] W.-K. Chen, Linear Networks and Systems (Book style). Belmont, CA: Wadsworth, 1993, pp. 123–135.
[3] H. Poor, An Introduction to Signal Detection and Estimation. New York: Springer-Verlag, 1985, ch. 4.
[4] B. Smith, “An approach to graphs of linear forms (Unpublished work style),” unpublished.
[5] E. H. Miller, “A note on reflector arrays (Periodical style—Accepted for publication),” Engineering Letters, to be published.
[6] J. Wang, “Fundamentals of erbium-doped fiber amplifiers arrays (Periodical style—Submitted for publication),” IAENG International
Journal of Applied Mathematics, submitted for publication.
[7] C. J. Kaufman, Rocky Mountain Research Lab., Boulder, CO, private communication, May 1995.
[8] Y. Yorozu, M. Hirano, K. Oka, and Y. Tagawa, “Electron spectroscopy studies on magneto-optical media and plastic substrate interfaces (Translation Journals style),” IEEE Transl. J. Magn.Jpn., vol. 2, Aug. 1987, pp. 740–741 [Dig. 9th Annu. Conf. Magnetics Japan, 1982, p. 301].
[9] M. Young, The Techincal Writers Handbook. Mill Valley, CA: University Science, 1989.
[10] J. U. Duncombe, “Infrared navigation—Part I: An assessment of feasibility (Periodical style),” IEEE Trans. Electron Devices, vol. ED-11, pp. 34–39, Jan. 1959.
[11] N. Meghanathan and G. W. Skelton, “Risk Notification Message Dissemination Protocol for Energy Efficient Broadcast in Vehicular Ad hoc Networks,” IAENG International Journal of Computer Science, vol. 37, no. 1, pp. 1–10, Jul. 2010.
[12] R. W. Lucky, “Automatic equalization for digital communication,” Bell Syst. Tech. J., vol. 44, no. 4, pp. 547–588, Apr. 1965.
[13] S. P. Bingulac, “On the compatibility of adaptive controllers (Published Conference Proceedings style),” in Proc. 4th Annu.
Allerton Conf. Circuits and Systems Theory, New York, 1994, pp. 8–
16.
[14] G. R. Faulhaber, “Design of service systems with priority reservation,” in Conf. Rec. 1995 IEEE Int. Conf. Communications, pp. 3–8.
[15] W. D. Doyle, “Magnetization reversal in films with biaxial anisotropy,” in 1987 Proc. INTERMAG Conf., pp. 2.2-1–2.2-6. [16] G. W. Juette and L. E. Zeffanella, “Radio noise currents n short
sections on bundle conductors (Presented Conference Paper style),” presented at the IEEE Summer power Meeting, Dallas, TX, Jun. 22– 27, 1990, Paper 90 SM 690-0 PWRS.
[17] J. G. Kreifeldt, “An analysis of surface-detected EMG as an amplitude-modulated noise,” presented at the 1989 Int. Conf. Medicine and Biological Engineering, Chicago, IL.
[18] J. Williams, “Narrow-band analyzer (Thesis or Dissertation style),” Ph.D. dissertation, Dept. Elect. Eng., Harvard Univ., Cambridge, MA, 1993.
[19] N. Kawasaki, “Parametric study of thermal and chemical nonequilibrium nozzle flow,” M.S. thesis, Dept. Electron. Eng., Osaka Univ., Osaka, Japan, 1993.
[20] J. P. Wilkinson, “Nonlinear resonant circuit devices (Patent style),” U.S. Patent 3 624 12, July 16, 1990.
[21] IEEE Criteria for Class IE Electric Systems (Standards style), IEEE
Standard 308, 1969.
[22] Letter Symbols for Quantities, ANSI Standard Y10.5-1968.
[23] R. E. Haskell and C. T. Case, “Transient signal propagation in lossless isotropic plasmas (Report style),” USAF Cambridge Res. Lab., Cambridge, MA Rep. ARCRL-66-234 (II), 1994, vol. 2. [24] E. E. Reber, R. L. Michell, and C. J. Carter, “Oxygen absorption in
the Earth’s atmosphere,” Aerospace Corp., Los Angeles, CA, Tech. Rep. TR-0200 (420-46)-3, Nov. 1988.
[25] (Handbook style) Transmission Systems for Communications, 3rd ed., Western Electric Co., Winston-Salem, NC, 1985, pp. 44–60.
[26] Motorola Semiconductor Data Manual, Motorola Semiconductor
Products Inc., Phoenix, AZ, 1989.
[27] N. Sohaee and C. V. Rorst, “Bounded Diameter Clustering Scheme For Protein Interaction Networks,” in Lecture Notes in Engineering and Computer Science: World Congress on Engineering and
Computer Science 2009, pp. 1–7.
[28] J. M. Merigo, “Using the Probabilistic Weight Average in Decision Making with Distsance Measures,” in Lecture Notes in Engineering
and Computer Science: World Congress on Engineering 2010, pp. 1–
4.
[29] T. Gonsalves and K. Itoh, “Multi-Objective Optimization for Software Development Projects,” in Lecture Notes in Engineering and Computer Science: International Multiconference of Engineers