Abstract—This paper presents the result of the statistical analysis on relationship between sub features in STAKCERT worm classification. The sub features of the STAKCERT worm classification in this paper were using the statistical analysis to prove the relationship between the sub features. Prior to that, the static and the dynamic analysis were conducted to identify and prove the association between the main features in STAKCERT worm classification for worm detection. There are limited ways on how the relationship between categorical data can be evaluated and Chi-Square tests and the symmetric measure are seen as the best method to be implemented. The case study presented in this paper explains in details how the Chi-Square tests are used to determine the relationship existed between the sub features and followed by the symmetric measure to quantify the strength of the relationship. This research paper is based on the integration between statistics and computer security field specifically with worm analysis. It can be used as the basis for further exploration in worm detection and isolation study.
Index Terms— infection, activation, payload, Chi-Square, symmetric measure.
I. INTRODUCTION
Worms infection left many bad implications on users and organizations all over the world for the past few decades. Many techniques were implemented to reduce or prevent the worms spread, but it is hard to produce 100% solid protection against it. Defence in depth is seen as a proactive way to overcome this problem where all possible point of entry for intruder being monitored and applied with security measure by considering the detection, prevention and responsive mechanism [8]. It is not a new concept. It was discussed in year 2003, that lack of communication and understanding between developers and users makes this concept hard to be realized [10]. The idea of this concept is to make sure that if the primary defense is being by-passed, there is always another layer of the defense method. Anti-virus alone is not enough to protect user from worms attack. The rise of firewall, intrusion detection system (IDS) and intrusion
Madihah Mohd Saudi is a lecturer with the Faculty Science and Technology, Islamic Science University of Malaysia (USIM), Bandar Baru Nilai, 71800 Nilai, Negeri Sembilan, Malaysia. Currently she is a PhD student in School of Computing, Informatics and Media, University of Bradford, United Kingdom. (email: [email protected] / [email protected]).
Dr Andrea J Cullen is a senior lecturer with the School of Computing, Informatics and Media, University of Bradford, United Kingdom. (email: [email protected]).
Professor Dr. Mike Woodward is a professor with the School of Computing, Informatics and Media, University of Bradford, United Kingdom. (email: [email protected]).
prevention system (IPS), business continuity planning, disaster recovery plan, security policy and incident response tool are alternatives to combat this problem. According to the survey carried out by Solera Network in year 2009 [9], 76% of the respondents felt that they can benefit more from the incident response tools. Only 28% of the respondents know how to capture and record the network traffic. One of the promising ways to tackle this problem is by using the incident response tool. In order to produce this kind of tool, a developer needs to understand how the worm works, the threat it posed, the exploited vulnerability, the avoidance technique integrated and the expected propagation rate. These examples of the trigger factors can help to produce the best solution for the incident response tool.
In this paper, a relationship between sub features in STAKCERT worm classification [3] are evaluated using the statistical test where these sub features will be used as the input for the propose incident response tool known as the STAKCERT system. The significant of this paper lays in the technique used to evaluate the relationship.
This research paper consists of the following: section II contains a discussion on previous work, section III discusses the methodology used and follows by section IV that explains the case study on the Chi-Square tests. Section V concludes and discusses the future work for this paper.
II. PREVIOUS WORK
In year 2005, the future of worm detection was explained [6]. The most important point that would like to be emphasized in this paper is on how to handle worm in most efficient ways. There are many different techniques implemented earlier, but how realistic and reliable the techniques are open to many doors for further discussion.
The idea to produce the incident response tool begins in year 2001 and followed by [1] in year 2003. SoSMART system that was developed by [1] is a coordination mechanism for incident response tool using agent architecture and case-based reasoning(CBR). It is similar with other security integration tool which are CIDF by DARPA and by IETF Intrusion Detection Working Group. Another incident response tool called DSS introduced by [2] claimed that it has resolved all the gaps found in the earlier version of incident response tool from year 2001. It used the combination of Recency, Frequency and Monetary(RFM) analysis methodology, statistical process control(SPC) chart, agent technique and case based reasoning(CBR) technique. The improvement made from [1] is in term of detect, response and prevent on the anomaly event in security threats. However, if the worms attack caused the failure of the network connection, this DSS system cannot works normally. The best way to produce the incident response is by not relying 100%
Statistical Analysis in Evaluating STAKCERT
Infection, Activation and Payload Methods
on the internet connection for updates or means of communication with other component. All of previous works presented in this section have been used as guidance in developing the STAKCERT system but will not be discussed here. This paper shows the significant of the feature selection by using Chi-Square and symmetric measure. Later the feature selection is used as input to the incident response tool. Paper by [7] is an example on how the Chi-Square tests and symmetric measure being applied in real world.
III. METHODS
Dataset taken from VxHeavens [4]. From 66,711 samples from VxHeavens, 5,614 were as the worms and were used as the scope for this research as the host worms. There were 161 variants of worms. The lab used for this testing is as illustrated in Fig. 1. It is a controlled lab environment and almost 80 % of the software used in this testing is open source or free basis. Before conducting the statistical analysis, static and dynamic analysis had been applied to identify the vulnerability being exploited by the worm in the binary code, to identify flows of the code, damage implication, the expected rate of the worm propagation and the infection avoidance method.
Figure 1. Lab architecture.
The STAKCERT relational model is formed based on the features of the STAKCERT worm classification [3]. The statistical analysis was conducted to prove that the relationship did not happen by chance between the sub features in the STAKCERT worm classification (as highlighted with red line in Fig. 2). The sub features evaluated are the infection, activation and the payload. The main features consist of the infection, activation, operating algorithm, payload and propagation. Only three of the main features are discussed here, as the others did not fulfill the requirement to be evaluated using the Chi-Square tests.
In Chi-Square tests, it becomes invalid if the expected frequency is less than 5. Only a few sub features are presented in this paper because of the constraint in the expected frequency. Since the dataset is a categorical or also known as the nominal data, testing was made based on the frequencies. Later it is converted into percentage for further analysis. Software SPSS has been used to conduct this statistical analysis.
Chi-Square is a statistical test for cross tabulation by comparing the actual frequencies result and the expected frequencies to verify that the result happens by chance or not [5]. Indeed it is also capable to measure the discrepancy between the observed cell counts (what we got from experiment) and what you would expect if the rows and columns were unrelated.
Figure 2. Improvement phase 1 STAKCERT framework.
The Chi-Square formula used on these data is as display in equation 1 where O stands for observed frequency, E stands for expected frequency, df for degree of freedom and X2 for Chi-Square.
(1) Expected frequencies are those we would expect if data were randomly distributed. The expected count in this cell is the average count one would expect under the null hypothesis. In general, the expected count for each cell of the contingency table is calculated as displayed in equation 2.
row total * column total
grand total (2)
In the case study conducted under section IV, the null hypothesis (H0) states that there is no significant difference
between expected and observed frequencies. In other word, there is no relationship between features. If there were no relationship between the features, the observed and the expected count would be similar (equals to 0). The alternative hypothesis (Ha) states they are different. Thus if H0, is
rejected, it can then be concluded that there is a relationship between the features. The level of significance chosen is 95% confident where the difference is not due to chance alone is set to 0.05. If the significance or probability (p) value is less than 0.05, it means less than 5 from 100 happens by chance. The details of the result are illustrated in the next section.
Figure 3. Infection result analysis.
[image:3.612.73.295.290.415.2]For the activation, the relationship between self-activation and human trigger is validated. The others after being tested did not fulfill the Chi-Square minimum frequency for expected count in the cell. The details of the summarized mode for the activation data is in Fig. 4.
Figure 4. Activation result analysis.
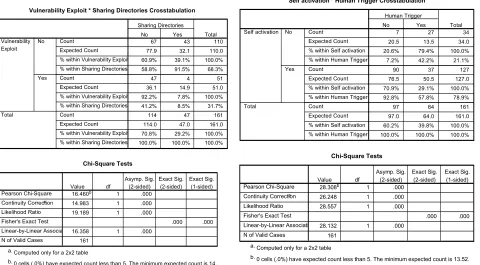
[image:3.612.315.540.316.564.2]For the payload data, only the autorun registry and backdoor relationship being presented. The others after being tested did not fulfill the Chi-Square minimum frequency for expected count in the cell. The details of the summarized mode for the activation data is in Fig. 5.
Figure 5. Top 10 payload result analysis.
IV. FINDINGS
A case study was conducted using a sample from VXheavens with the same architecture showed in Fig. 1. The method used to conduct this case study can be referred under section III of this paper. The objective of this case study was to evaluate the relationship between sub features for infection, activation and payload method using the Chi-Square tests and symmetric
measure. In this section, we presented the relationship between these sub features.
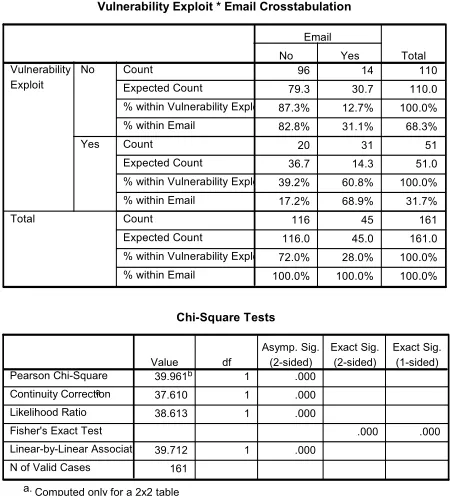
A. Finding 1. Relationship between Vulnerability and Email.
Assuming:
H0 = There is no relationship between vulnerability and email.
Ha = There is relationship between vulnerability and email.
Based on the statistical analysis conducted, the relationship between vulnerability and email has a positive strong relationship with Pearson Chi-Square value is 39.961, significance or probability (p) value of 0.00 and Phi value is 0.498 using the Chi-Square tests and symmetric measure. As a result, the H0 is rejected and Ha is accepted since the p value is
less than 0.05. This indicates that the relationship did not happen by chance, which is based on the Chi-Square tests. The value of the probability (p) for the distribution occurs by chance is 0.00 (refer to Table 1). As a conclusion, there is a relationship between vulnerability and email.
Table 1. Analysis result between vulnerability and email.
Vulnerability Exploit * Email Crosstabulation
96 14 110
79.3 30.7 110.0 87.3% 12.7% 100.0% 82.8% 31.1% 68.3%
20 31 51
36.7 14.3 51.0 39.2% 60.8% 100.0% 17.2% 68.9% 31.7%
116 45 161
116.0 45.0 161.0 72.0% 28.0% 100.0% 100.0% 100.0% 100.0% Count
Expected Count % within Vulnerability Exploit % within Email
Count Expected Count % within Vulnerability Exploit % within Email
Count Expected Count % within Vulnerability Exploit % within Email
No
Yes Vulnerability Exploit
Total
No Yes
Total
Chi-Square Tests
39.961b 1 .000
37.610 1 .000
38.613 1 .000
.000 .000
39.712 1 .000
161 Pearson Chi-Square
Continuity Correctiona Likelihood Ratio Fisher's Exact Test Linear-by-Linear Association N of Valid Cases
Value df
Asymp. Sig. (2-sided)
Exact Sig. (2-sided)
Exact Sig. (1-sided)
Computed only for a 2x2 table a.
0 cells (.0%) have expected count less than 5. The minimum expected count is 14.25. b.
Symmetric Measures
.498 .000
.498 .000
.446 .000
161 Phi
Cramer's V Contingency Coefficient Nominal by
Nominal
N of Valid Cases
Value Approx. Sig.
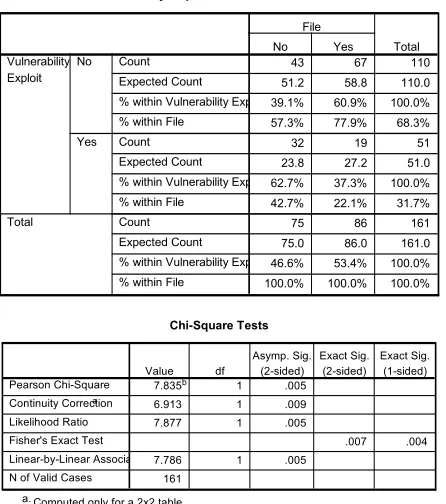
B. Finding 2. Relationship between Vulnerability and File.
Assuming:
H0 = There is no relationship between vulnerability and file.
[image:3.612.75.292.500.638.2]Based on the statistical analysis conducted, the relationship between vulnerability and email has a negative weak relationship with Pearson Chi-Square value is 7.835, significance or probability (p) value of 0.005 and Phi value is -0.221 using the Chi-Square tests and symmetric measure. Therefore, the H0 is rejected and Ha is accepted since the p
[image:4.612.315.547.158.547.2]value is less than 0.05. This indicates that the relationship did not happen by chance, which is based on the Chi-Square tests. The value of the probability (p) for the distribution occurs by chance is 0.005. The result of the analysis is summarized in Table 2. As a conclusion, there is a relationship between vulnerability and file.
Table 2. Analysis result between vulnerability and file.
Vulnerability Exploit * File Crosstabulation
43 67 110
51.2 58.8 110.0 39.1% 60.9% 100.0% 57.3% 77.9% 68.3%
32 19 51
23.8 27.2 51.0 62.7% 37.3% 100.0% 42.7% 22.1% 31.7%
75 86 161
75.0 86.0 161.0 46.6% 53.4% 100.0% 100.0% 100.0% 100.0% Count
Expected Count % within Vulnerability Exploit % within File
Count Expected Count % within Vulnerability Exploit % within File
Count Expected Count % within Vulnerability Exploit % within File
No Yes Vulnerability Exploit Total No Yes File Total Chi-Square Tests
7.835b 1 .005
6.913 1 .009
7.877 1 .005
.007 .004
7.786 1 .005
161 Pearson Chi-Square
Continuity Correctiona Likelihood Ratio Fisher's Exact Test Linear-by-Linear Association N of Valid Cases
Value df Asymp. Sig. (2-sided) Exact Sig. (2-sided) Exact Sig. (1-sided)
Computed only for a 2x2 table a.
0 cells (.0%) have expected count less than 5. The minimum expected count is 23.76. b. Symmetric Measures -.221 .005 .221 .005 .215 .005 161 Phi Cramer's V Contingency Coefficient Nominal by Nominal
N of Valid Cases
Value Approx. Sig.
C. Finding 3. Relationship between Vulnerability, File and Email.
Assuming:
H0 = There is no relationship between vulnerability, file and
email.
Ha = There is relationship between vulnerability, file and
email.
The relationship that would like to be tested is email influencing the vulnerability and the file. Based on the statistical analysis conducted, email did not influence the vulnerability and file. In the table Chi Square and symmetric measure, the ‘Yes’ column is being referred. The Pearson
Chi-Square value is 16.460, significance or probability (p) value of 0.128 and Phi value is 0.227 using the Chi-Square tests and symmetric measure. Based on the result analysis that is summarized in Table 3, H0 is accepted since the p value is
[image:4.612.75.298.215.467.2]more than 0.05. Therefore, the relationship might happened by chance with 22.7%. This is calculated by using the Chi-Square equation.
Table 3. Analysis result between vulnerability, file and email.
Vulnerability Exploit * File * Email Crosstabulation
32 64 96
38.9 57.1 96.0
33.3% 66.7% 100.0%
68.1% 92.8% 82.8%
15 5 20
8.1 11.9 20.0
75.0% 25.0% 100.0%
31.9% 7.2% 17.2%
47 69 116
47.0 69.0 116.0
40.5% 59.5% 100.0%
100.0% 100.0% 100.0%
11 3 14
8.7 5.3 14.0
78.6% 21.4% 100.0%
39.3% 17.6% 31.1%
17 14 31
19.3 11.7 31.0
54.8% 45.2% 100.0%
60.7% 82.4% 68.9%
28 17 45
28.0 17.0 45.0
62.2% 37.8% 100.0%
100.0% 100.0% 100.0% Count
Expected Count
% within Vulnerability Exploit
% within File
Count
Expected Count
% within Vulnerability Exploit
% within File
Count
Expected Count
% within Vulnerability Exploit
% within File
Count
Expected Count
% within Vulnerability Exploit
% within File
Count
Expected Count
% within Vulnerability Exploit
% within File
Count
Expected Count
% within Vulnerability Exploit
% within File No Yes Vulnerability Exploit Total No Yes Vulnerability Exploit Total Email No Yes No Yes File Total Chi-Square Tests
11.923b 1 .001
10.257 1 .001
11.908 1 .001
.001 .001
11.820 1 .001
116
2.311c 1 .128
1.412 1 .235
2.434 1 .119
.188 .116
2.260 1 .133
45 Pearson Chi-Square
Continuity Correctiona
Likelihood Ratio
Fisher's Exact Test
Linear-by-Linear Association
N of Valid Cases
Pearson Chi-Square
Continuity Correctiona
Likelihood Ratio
Fisher's Exact Test
Linear-by-Linear Association
N of Valid Cases Email No Yes Value df Asymp. Sig. (2-sided) Exact Sig. (2-sided) Exact Sig. (1-sided)
Computed only for a 2x2 table a.
0 cells (.0%) have expected count less than 5. The minimum expected count is 8.10. b.
0 cells (.0%) have expected count less than 5. The minimum expected count is 5.29. c. Symmetric Measures -.321 .001 .321 .001 .305 .001 116 .227 .128 .227 .128 .221 .128 45 Phi Cramer's V Contingency Coefficient Nominal by Nominal
N of Valid Cases
Phi
Cramer's V
Contingency Coefficient Nominal by
Nominal
N of Valid Cases Email
No
Yes
[image:4.612.75.301.496.561.2]D. Finding 4. Relationship between Vulnerability and Sharing Directories.
Assuming:
H0 = There is no relationship between vulnerability and
sharing directories.
Ha = There is relationship between vulnerability and sharing
directories.
Based on the statistical analysis conducted, the relationship between vulnerability and sharing directories has a negative weak relationship with Pearson Chi-Square value is 16.460, significance or probability (p) value of 0.000 and Phi value is -0.321 using the Chi-Square tests and symmetric measure. Therefore, the H0 is rejected and Ha is accepted since the p
[image:5.612.77.557.313.578.2]value is less than 0.05. Based on the Chi-Square tests, the relationship did not happen by chance. The value of the probability (p) for the distribution occurs by chance is 0.00. The result of the analysis is summarized in Table 4. It is concluded that there is a relationship between vulnerability and sharing directories.
Table 4. Analysis result between vulnerability and sharing directories.
Vulnerability Exploit * Sharing Directories Crosstabulation
67 43 110
77.9 32.1 110.0 60.9% 39.1% 100.0% 58.8% 91.5% 68.3%
47 4 51
36.1 14.9 51.0
92.2% 7.8% 100.0% 41.2% 8.5% 31.7%
114 47 161
114.0 47.0 161.0 70.8% 29.2% 100.0% 100.0% 100.0% 100.0% Count
Expected Count % within Vulnerability Exploit % within Sharing Directories Count
Expected Count % within Vulnerability Exploit % within Sharing Directories Count
Expected Count % within Vulnerability Exploit % within Sharing Directories No
Yes Vulnerability Exploit
Total
No Yes
Sharing Directories Total
Chi-Square Tests
16.460b 1 .000
14.983 1 .000
19.189 1 .000
.000 .000
16.358 1 .000
161 Pearson Chi-Square
Continuity Correctiona Likelihood Ratio Fisher's Exact Test Linear-by-Linear Association N of Valid Cases
Value df
Asymp. Sig. (2-sided)
Exact Sig. (2-sided)
Exact Sig. (1-sided)
Computed only for a 2x2 table a.
0 cells (.0%) have expected count less than 5. The minimum expected count is 14.89. b.
Symmetric Measures
-.320 .000
.320 .000
.305 .000
161 Phi
Cramer's V Contingency Coefficient Nominal by
Nominal
N of Valid Cases
Value Approx. Sig.
E. Finding 5. Relationship between Self Activation and Human Trigger.
Assuming:
H0 = There is no relationship between self activation and
human trigger.
Ha = There is relationship between self activation and human
trigger.
Based on the statistical analysis conducted, the relationship between self activation and human trigger has almost a strong negative relationship with Pearson Chi-Square value is 28.308, significance or probability (p) value of 0.000 and Phi value is -0.419 using the Chi-Square tests and symmetric measure. The result of this analysis is summarized in Table 5. Since the p value is less than 0.05, the H0 is rejected and Ha is
accepted. This indicates that the relationship did not happen by chance, which is based on the Chi-Square tests. The value of the probability (p) for the distribution occurs by chance is 0.00. As a conclusion, there is a relationship between self activation and human trigger.
Table 5. Analysis result between self activation and human trigger.
Self activation * Human Trigger Crosstabulation
7 27 34
20.5 13.5 34.0
20.6% 79.4% 100.0% 7.2% 42.2% 21.1%
90 37 127
76.5 50.5 127.0 70.9% 29.1% 100.0% 92.8% 57.8% 78.9%
97 64 161
97.0 64.0 161.0 60.2% 39.8% 100.0% 100.0% 100.0% 100.0% Count
Expected Count % within Self activation % within Human Trigger Count
Expected Count % within Self activation % within Human Trigger Count
Expected Count % within Self activation % within Human Trigger No
Yes Self activation
Total
No Yes
Human Trigger
Total
Chi-Square Tests
28.308b 1 .000
26.248 1 .000
28.557 1 .000
.000 .000
28.132 1 .000
161 Pearson Chi-Square
Continuity Correctiona Likelihood Ratio Fisher's Exact Test Linear-by-Linear Association N of Valid Cases
Value df
Asymp. Sig. (2-sided)
Exact Sig. (2-sided)
Exact Sig. (1-sided)
Computed only for a 2x2 table a.
0 cells (.0%) have expected count less than 5. The minimum expected count is 13.52. b.
Symmetric Measures
-.419 .000
.419 .000
.387 .000
161 Phi
Cramer's V Contingency Coefficient Nominal by
Nominal
N of Valid Cases
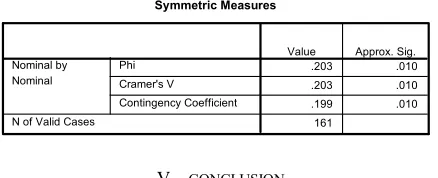
F. Finding 6. Relationship between Autorun Registry and Backdoor.
Assuming:
H0 = There is no relationship between autorun registry and
backdoor.
Ha = There is relationship between autorun registry and
backdoor.
Based on the statistical analysis conducted, the relationship between autorun registry and backdoor has almost positive weak relationship with Pearson Chi-Square with a value of 6.630, significance or probability (p) value of 0.010 and Phi value is 0.203 using the Chi-Square tests and symmetric measure. As a result, the H0 is rejected and Ha is accepted
[image:6.612.74.293.562.651.2]since the p value is less than 0.05. This indicates that the relationship did not happen by chance, which is based on the Chi-Square tests. The value of the probability (p) for the distribution occurs by chance is 0.010. The result of the analysis is summarized in Table 6. As a conclusion, there is a relationship between autorun registry and backdoor.
Table 6. Analysis result between autorun registry and backdoor.
Autorun at registry * Backdoor Crosstabulation
77 11 88
70.5 17.5 88.0
87.5% 12.5% 100.0%
52 21 73
58.5 14.5 73.0
71.2% 28.8% 100.0%
129 32 161
129.0 32.0 161.0 80.1% 19.9% 100.0% Count
Expected Count % within Autorun at registry Count
Expected Count % within Autorun at registry Count
Expected Count % within Autorun at registry No
Yes Autorun at registry
Total
No Yes
Backdoor
Total
Chi-Square Tests
6.630b 1 .010
5.648 1 .017
6.654 1 .010
.016 .009
6.589 1 .010
161 Pearson Chi-Square
Continuity Correctiona Likelihood Ratio Fisher's Exact Test Linear-by-Linear Association N of Valid Cases
Value df
Asymp. Sig. (2-sided)
Exact Sig. (2-sided)
Exact Sig. (1-sided)
Computed only for a 2x2 table a.
0 cells (.0%) have expected count less than 5. The minimum expected count is 14.51. b.
Symmetric Measures
.203 .010
.203 .010
.199 .010
161 Phi
Cramer's V Contingency Coefficient Nominal by
Nominal
N of Valid Cases
Value Approx. Sig.
V. CONCLUSION
Based on the six findings presented in this case study, it is concluded that each relationship has its owns representation and interpretation. The relationship between each sub features is evaluated using the Chi-Square tests and symmetric measure to prove that it is related with each other. Later the sub features will be used as the input for the proposed STAKCERT incident response. Prior to that, the static and
dynamic analysis have been conducted to prove the relationship between the sub features which leads the formation of the STAKCERT relational model. It is hoped this case study can be used as a guidance in analyzing categorical data via statistical testing. For future work, apoptosis and data mining will be integrated to improve the accuracy of results on worm detection and isolation.
ACKNOWLEDGMENT
The authors would like to express their gratitude to School of Computing, Informatics and Media, University of Bradford and Universiti Sains Islam Malaysia (USIM) for the support and facilities provided.
REFERENCES
[1] M. Scott And F. Pat, “System Or Security Managers Adaptive Response Tool,” Darpa Information Survivability Conference And Exposition, Vol. 2, 2000, pp. 1056-1056.
[2] H.K. Kim,K.W.Im And S.C.Park, “Dss For Computer Security Incident Response Applying Cbr And Collaborative Response,” Expert Systems With Applications, Vol. 37, No. 1, 2010, pp. 852-870.
[3] M.M.Saudi, A.J. Cullen and M.E. Woodward, "STAKCERT Framework in Eradicating Worms Attack," In Proceedings International Conference on CyberWorlds 2009.pp. 257-264, 2009. [4] VXHeavens website, “Virus Collection”, 2006, Available:
http://vx.netlux.org/vl.php.
[5] P.Greasley, “Quantitative data analysis using SPSS: An introduction for health and social sciences”. Open University Press, McGraw-Hill Education, Glasgow, pp. 63, 2008.
[6] R. Ford, “The future of virus detection,” Information Security Technical Report, vol. 9, no. 2, 2004, pp. 19-26.
[7] S. Daya, “Chi-Square test for larger (r×c) contingency tables,” Evidence-based Obstetrics & Gynecology, vol. 3, no. 2, 2001, pp. 59-60.
[8] Sandhills Publishing Company, “Defense In-Depth Exercise Best Practices & A Tiered Security Defense To Protect Your Internal Network”, vol.28, issue 40, 2006,pp.1
[9] B. Bosen, “Network Forensics Survey: Most Networks Are Unprepared For Quick Response”, Source: SC Magazine, 2009. URL: http://whitepapers.scmagazineus.com/whitepaper7313/