Original Article
Array profiling identified dysregulated miRNAs
and target genes and pathways in laryngeal
squamous cell carcinoma
Yifan Yang1*, Meng Lian1*, Ling Feng1, Ru Wang1, Qian Shi1, Jie Zhai1, Xiaoqin Liu2#, Jugao Fang1#
1Department of Otorhinolaryngology-Head and Neck Surgery, Beijing Tongren Hospital, Capital Medical University, Beijing, PR China; 2Department of Otolaryngology, The Inner Mongolia Autonomous Region People’s Hospital, In-ner Mongolia , PR China. *Equal contributors and co-first authors. #Equal contributors.
Received April 26, 2017; Accepted August 29, 2017; Epub March 15, 2018; Published March 30, 2018
Abstract: Background: Laryngeal squamous cell carcinoma (LSCC) is the most common type of head and neck squamous cell carcinoma (HNSCC), and comprehensive post-transcriptional regulation is needed to be clarified. Objective: The purpose of this study was to investigate the miRNA basis of tumorigenesis in LSCC, and miRNA-gene-network and miRNA-pathway-network will be established with microarray analysis to reveal the molecular mechanism regulated by miRNAs. Methods: MicroRNA array and microarray were used to detect differently ex-pressed miRNAs and mRNAs between the LSCC samples and para-carcinoma tissues collected from 2008 to 2013, then miRNA-mRNA network and miRNA-pathway network analysis were performed. Finally, the top dysregulated miRNAs were validated by quantitative real-time polymerase chain reaction (qRT-PCR). Results: 50 miRNAs (47 up- and 3 down-regulated), 2381 mRNAs (1542 up- and 839 down-regulated) were found to be differentially ex-pressed. Bioinformatics analysis show that there were 31 different genes and 71 functional pathways regulated by the screened miRNAs. Hsa-miR-30a-5p expression level was validated by qRT-PCR. Conclusions: The research revealed tumorigenesis-related miRNAs, mRNAs, miRNA-mRNA, miRNA-pathway-network in LSCC. Hsa-miR-30a-5p could be considered as a potential diagnostic and therapeutic marker in LSCC.
Keywords: Microarray, LSCC, tumorigenesis, microRNA array
Introduction
Head and neck squamous cell carcinoma (HN- SCC) is the sixth most frequent cancer, and laryngeal squamous cell carcinoma (LSCC) is the most common type, accounting for 1% to 2% of all malignancies worldwide [1-3]. Cor- responding to ~25% of HNSCC cases, of which the long-term survival rate has remained at 50%, LSCC should be drawn attention [4]. The development and progression of LSCC are mul-tistep processes accompanied by changes of molecular biology. Various studies have re- vealed numerous molecular abnormalities in LSCC. However, the complete array of molecu-lar changes that occur during oncogenesis remains elusive [5]. Hence, it is a need to acquire deeper understanding of LSCC biology and to develop predictive molecular signatur- es, which would improve patient selection for
appropriate treatment and guide the develop-ment and evaluation.
NAs. Finally, the significant screened miRNAs
which regulated important molecular
mecha-nism were validated by qRT-PCR. Our findings
contribute to the understanding of the mole- cular basis of tumorigenesis in LSCC, and pro-vide a set of miRNAs that may be useful for the development of novel diagnostic markers and/ or more effective diagnostic and therapeutic strategies.
Materials and methods
Tissue samples and patients
All patients we had selected were treated in Department of Head and Neck Surgery, Beijing Tongren Hospital between 2008 and 2013. All patients provided written informed consent before their participation. The Ethics Commit- tee of Capital Medical University approval was obtained for the use of all samples by using a protocol that conforms to the provisions of the Declaration of Helsinki.
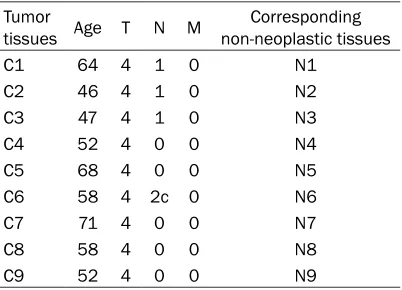
[image:2.612.91.292.96.188.2]A total number of 5 patients (no females) who underwent surgery for primary laryngeal squa-mous cell carcinoma were recruited for microR-NAs array analysis, and the TNM stage of each patient was determined as Table 1. Another total number of 9 patients (no females) who underwent surgery for primary laryngeal squa-mous cell carcinoma were recruited for Mic- roarray Gene Expression analysis, and the TNM stage of each patient was determined as
Table 2. A set of 36 patients (no females) who
underwent surgery for primary LSCC were also recruited for RT-PCR, and the TNM stage of each patient was determined as Table 3. The three patient cohorts used for array analysis and qRT-PCR investigations were separated. The cancer tissues and corresponding adjacent non-neoplastic tissues were collected during surgery. Each specimen was immediately sna- p-frozen in liquid nitrogen and stored at -80°C for subsequent study. The pathology of all the cancer tissues were squamous cell carcinoma, which were evaluated by pathologists.
RNA extraction and quality assessment
Total RNA was extracted from tissue samples using Trizol Reagent (Invitrogen). Then the RNA quantity was determined using denaturing gel electrophoresis which produced at least 2 dis-tinct bands representing the 28S and 18S
ribo-Table 1. Clinical data of patients for
microR-NAs array
Tumor
tissues Age T N M non-neoplastic tissuesCorresponding
FX3T 53 2 0 0 FX3Z
FX11T 55 4 3 0 FX11Z
HN3T 56 4 0 0 HN3Z
HN3DT 74 3 0 0 HN3DZ
[image:2.612.91.292.233.378.2]FX21T 71 4 2a 0 FX21Z
Table 2. Clinical data of patients for
microar-rays
Tumor
tissues Age T N M non-neoplastic tissuesCorresponding
C1 64 4 1 0 N1
C2 46 4 1 0 N2
C3 47 4 1 0 N3
C4 52 4 0 0 N4
C5 68 4 0 0 N5
C6 58 4 2c 0 N6
C7 71 4 0 0 N7
C8 58 4 0 0 N8
[image:2.612.90.293.412.506.2]C9 52 4 0 0 N9
Table 3. Clinical data of patients for RT-PCR
TNM Number Average age (mean ± SD)
T1N0M0 1 51.00±0.00
T2N0M0 7 49.00±8.40
T3N0M0 8 58.00±5.39
T4N0M0 6 60.00±7.32
T3NxM0 (X≠0) 6 58.00±6.69
T4NxM0 (X≠0) 8 61.00±6.82
has identified a new layer of gene regulation
mechanisms. MicroRNAs have also been rec-ognized to play important roles in Head and neck squamous cell carcinomas and are re- garded as key regulators of gene expression in biological systems [8-10].
In the present study, we focus on the microR-NAs expression about tumorigenesis in LSCC. With Microarray Gene Expression Analysis of Tumorigenesis in LSCC, we demonstrated the
gene expression profiles mediated by
miR-somal RNA, confirming that the total RNA was
not contaminated with DNA and the RNA was not degraded.
MicroRNA array
The Affymetrix GeneChip miRNA Array 3.0 (Beijing Compass Biotechnology Company) was used to investigate miRNA expression. The pro-cedure was carried out using FlashTag Biotin RNA Labeling Kit (Affymetrix) for Affymetrix GeneChip miRNA arrays in accord with the manufacturer’s protocol. The labeled RNA samples were processed by Poly A tailing, bio-tin ligation, hybridization, washing and staining, then the microarrays were scanned and the raw data were extracted. After raw data was pro-cessed by the Affymetrix GeneChip Command Console (version 4.0, Affymetrix) software, the differential miRNAs could be screened. The dataset had been submitted to Gene Expres- sion Omnibus, and the accession number was GSE62819.
Microarray assay
Agilent lncRNA Gene Expression 4 × 180K Mic- roarray (Design ID: 042818, Agilent Technolo- gies, USA) was used to test the mRNA
expres-sion profiling. The sample labeling, microarray
hybridization and washing were performed based on the manufacturer’s standard
proto-cols. Briefly, total RNA were transcribed to dou -ble strand cDNA, then synthesized into cDNA and labeled with Cyanine-3-CTP. The labeled cDNAs were hybridized onto the microarray. After washing, the arrays were scanned by the Agilent Scanner G2505C (Agilent Technolo- gies). Random Variance Model (RVM) t-test was
applied to filter the differentially expressed
genes between tumor tissues and adjacent non-cancerous tissues according to the p-value threshold. P value < 0.05 was considered as
significant difference. The Hierarchical
Clus-tering was conducted to analyze the differen-tially expressed mRNAs. The microarray data have been deposited in Gene Expression Om- nibus (GEO) database and are accessible th- rough GEO accession number GSE84957. Data analysis
MicroRNA-Pathway-network is built according
to the relationship of significant PATHWAYs and
genes and the relationships among MicroRNA
and genes. The adjacency matrix of MicroRNA and genes A= [ai,j] is made by the attribute re- lationships among PATHWAYs and MicroRNA, and ai,j represents the relation weigh of PA- THWAY i and MicroRNA j. In the MicroRNA-Gene-Network, the circle represents gene and the shape of square represents MicroRNA, and their relationship was represented by one edge. The center of the network was represents by degree. Degree means the contribution one MicroRNA to the PATHWAYs around or the contribution one PATHWAY to the MicroRNAs around. The key MicroRNA and gene in the net-work always have the biggest degrees [11, 12]. To build a miRNA-Gene-Network, the relation-ship between miRNAs and genes was counted by their differential expression values, and ac- cording to their interactions in the Sanger miRNA database. The adjacency matrix of Mi- croRNA and genes A= [ai,j] was made by the attribute relationships among genes and Mic- roRNA, where ai,j represents the weight of the relationship between gene i and MicroRNA j. In the miRNA-Gene-Network, the circles repre-sent is reprerepre-sented by one edge. The center of the network was represented by degree. De- gree is the contribution of one miRNA to the genes around or the contribution of one gene to the miRNAs around. The key miRNA and gene in the network always have the biggest degrees [13].
Quantitative real-time PCR
The transcriptional level of the target genes were measured by qRT-PCR detection. Trizol was applied to extract total cellular RNA. Pre-
pared Template RNA (5 μl)/primer (1 μl)
mix-ture in microtube. Keep in 70°C for 10 minu- tes, then rapid quenched in ice no more than 5 minutes. After that, centrifuged for a few sec-onds so that the template RNA/primer solu- tion of denatured aggregation gathered at the bottom of the microtube. Then added 5 × M- MLV Buffer, RNase Inhibitor and dNTP Mixture preparation called reverse transcription
reac-tion solureac-tion in the microtube, 4 μl totally. This
solution had to keep in 42°C for 1 hour. Cooled by ice after hold in 95°C for 15 minutes, then
we got the cDNA solution. Mixed this 1 μl
cD-NA solution, Taq DcD-NA Polymerase, 2XSYBR to
20 μl the mixed system. Hold it in 95°C for 5
Table 4. Differentially expressed miRNAs analyzed by microRNA array
p-value FDR Fold change (T/Z) Style Accession miRNA
0.049827 0.234 0.051 Down MIMAT0000728 miR-375
0.045292 0.234 0.11 Down MIMAT0017990 miR-3613-5p
0.001363 0.147 0.23 Down MIMAT0000087 miR-30a-5p
0.011938 0.184 4.07 Up MIMAT0002872 miR-501-5p
0.02809 0.21 4.37 Up MIMAT0016872 miR-4317
0.042284 0.234 4.38 Up MIMAT0000266 miR-205-5p
0.021747 0.21 4.41 Up MIMAT0004507 miR-92a-1-5p
0.02254 0.21 4.46 Up MIMAT0004657 miR-200c-5p
0.032786 0.214 4.48 Up MIMAT0009447 miR-1972
0.032483 0.214 4.57 Up MIMAT0019073 miR-4534
0.036512 0.227 4.57 Up MIMAT0005586 miR-1231
0.00396 0.153 4.61 Up MIMAT0000688 miR-301a-3p
0.028905 0.21 4.84 Up MIMAT0001536 miR-429
0.008558 0.164 4.87 Up MIMAT0002891 miR-18a-3p
0.020081 0.21 5 Up MIMAT0018178 miR-3180
0.020246 0.21 5.02 Up MIMAT0015058 miR-3180-3p
0.046047 0.234 5.14 Up MIMAT0002876 miR-505-3p
0.02424 0.21 5.2 Up MIMAT0001080 miR-196b-5p
0.042981 0.234 5.4 Up MIMAT0005825 miR-1180-3p
0.008372 0.164 5.87 Up MIMAT0018000 miR-23c
0.04804 0.234 5.89 Up MIMAT0018968 miR-4449
0.023286 0.21 6.14 Up MIMAT0004498 miR-25-5p
0.024156 0.21 6.6 Up MIMAT0005951 miR-1307-3p
0.031906 0.214 6.64 Up MIMAT0018929 miR-4417
0.021131 0.21 6.95 Up MIMAT0003886 miR-769-5p
0.04815 0.234 6.98 Up MIMAT0005797 miR-1301-3p
0.007944 0.164 7.14 Up MIMAT0009197 miR-205-3p
0.027598 0.21 7.27 Up MIMAT0001412 miR-18b-5p
0.006355 0.157 7.38 Up MIMAT0003150 miR-455-5p
0.0467 0.234 7.68 Up MIMAT0002821 miR-181d-5p
0.033348 0.216 9.24 Up MIMAT0004497 miR-24-2-5p
0.013133 0.184 9.5 Up MIMAT0005880 miR-1290
0.006736 0.157 9.52 Up MIMAT0004509 miR-93-3p
0.014237 0.184 9.71 Up MIMAT0004672 miR-106b-3p
0.010201 0.183 10.65 Up MIMAT0000261 miR-183-5p
0.011403 0.184 11.18 Up MIMAT0000267 miR-210-3p
0.003852 0.153 11.3 Up MIMAT0004496 miR-23a-5p
0.004903 0.153 11.32 Up MIMAT0004560 miR-183-3p
0.032302 0.214 11.46 Up MIMAT0000424 miR-128-3p
0.015601 0.189 11.52 Up MIMAT0004494 miR-21-3p
0.034939 0.223 11.53 Up MIMAT0004588 miR-27b-5p
0.005825 0.157 12.02 Up MIMAT0004749 miR-424-3p
0.013711 0.184 13.3 Up MIMAT0003339 miR-421
0.0023 0.153 13.57 Up MIMAT0004504 miR-31-3p
0.001178 0.147 14.7 Up MIMAT0002874 miR-503-5p
0.005236 0.153 18.28 Up MIMAT0004501 miR-27a-5p
0.007751 0.164 18.57 Up MIMAT0001635 miR-452-5p
0.004997 0.153 23.35 Up MIMAT0009198 miR-224-3p
0.006671 0.157 24.32 Up MIMAT0000226 miR-196a-5p
0.002876 0.153 48.16 Up MIMAT0000281 miR-224-5p
totally which were keeping in 95°C for 30 s, keeping in 65°C for 30 s, and keeping in 72°C for 5 mins. The gene expression levels were deter-mined based on Livak meth-od. The results that 2-ΔΔCT values of all samples were analyzed automatically by co-
mputer control with β-actin
gene as an internal reference. Statistical analysis for qRT-PCR
All data were imported to SP- SS 20.0. The data which did not meet normality would be converted into normality. Pair ed sample t tests were used for analysis involving two sam-ples. Differences were
consid-ered statistically significant at
P-value < 0.05.
Results
MiRNAs expression analysis of tumorigenesis in LSCC
Expression analysis using the miRNA array was initially
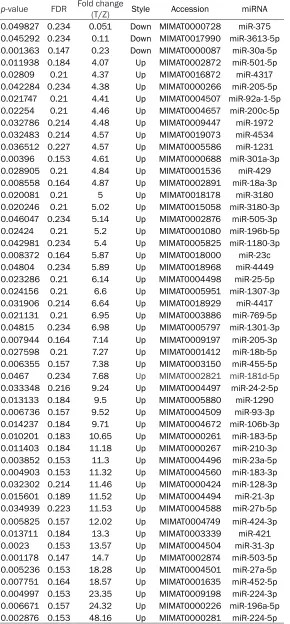
per-formed on five laryngeal squa -mous cell carcinoma tissues and their corresponding adja-cent non-neoplastic tissues. We found there were 50 miR-NAs showed statistically
sig-nificant differences in the
expression between LSCC tis-sues and corresponding non-neoplastic tissues. Among th- ese 50 miRNAs, 47 miRNAs showed a higher expression in tumor than in non-tumor tis-sue, and the other 3 miRNAs presented the contrasting pa- ttern.
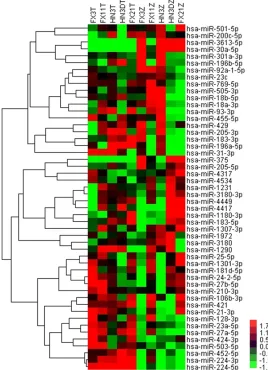
Figure 1. Hierarchical Trees: All differentially expressed miRNAs of tumori-genesis in LSCC For each miRNA (row), red indicated a higher expression and green a lower one relative to the average level of expression of all the 50 miRNAs (columns).
tumors from non-neoplastic tissues in the set of samples. The result was shown below in
Table 4 and Figure 1.
Microarray-based integrated analysis
The microRNA array hierarchical clustering analysis showed a clear separation between laryngeal squamous cell carcinoma tissues and their corresponding adjacent non-neo- plastic tissues. To determine the potential di- rect targets or pathways of screened miRNAs in LSCC, we next performed mRNA microarray
to detect the gene expression profiles in LSCC.
We found that total 2381 genes were differen-tially expressed. The 2381 genes showed
sta-tistically significant differences in the expres
-sion between LSCC tissues and corresponding non-neo-plastic tissues (P < 0.05). Am- ong these 2381 genes, 1542 showed a higher expression in tumor than in non-tumor tis-sue, and 839 presented the contrasting pattern. Supervis- ed hierarchical clustering an- alysis revealed that the expr- ession patterns of the selec- ted set of the differentially ex- pressed genes were able to perfectly distinguish tumors fr- om non-neoplastic tissues in the set of samples. The result was shown below in Figure 2. To predict potentially function-al target genes and pathways between miRNAs and mRNAs, we performed the two
expres-sion profiles of miRNAs and
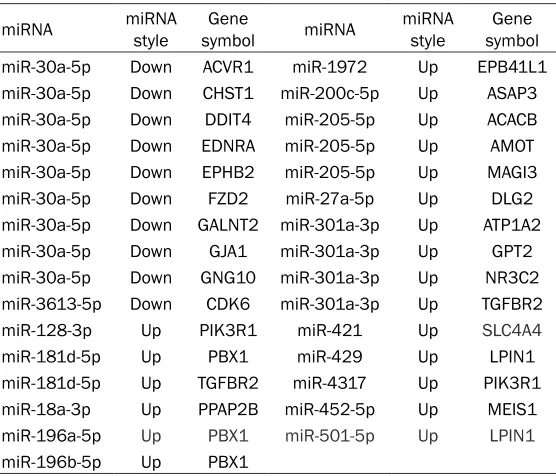
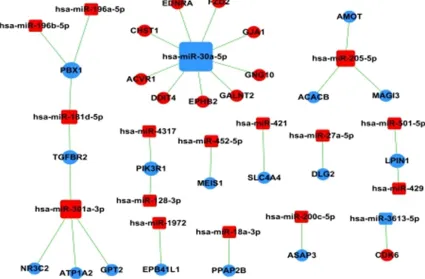
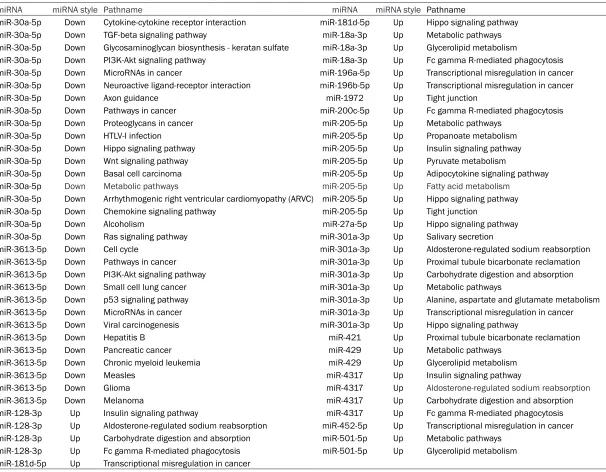
mRNAs to establish functional miRNA-gene-network and miR-NA-pathway-network relation-ships with a high precision. We found that 31 different scr- eened genes and 71 different functional pathways related to the screened miRNAs (Table
5, Figure 3; Table 6, Figure 4). Among the screened miR-NAs, hsa-miR-30a-5p should be paid attention to. Hsa-miR-30a-5p was down-expressed obviously, and it regulated PI3K/Akt signaling pathway, TGF-beta signaling pathway, Wnt signaling pathway and so on, all of which were considered as important signal-ing pathway related with tumorigenesis. Hsa-miR-30a-5p could be considered as potential diagnostic and therapeutic markers in LSCC. Quantitative real-time PCR
quantita-Figure 2. Hierarchical clustering of aberrant expressed mRNAs detected in LSCC. Red color indicates over expression and green color indicates low expression. Every column represents a tissue sample and every row repre-sents an mRNA probe.
Table 5. The result of miRNA-Gene-Network analysis
miRNA miRNA style symbolGene miRNA miRNA style symbolGene
miR-30a-5p Down ACVR1 miR-1972 Up EPB41L1
miR-30a-5p Down CHST1 miR-200c-5p Up ASAP3
miR-30a-5p Down DDIT4 miR-205-5p Up ACACB
miR-30a-5p Down EDNRA miR-205-5p Up AMOT
miR-30a-5p Down EPHB2 miR-205-5p Up MAGI3
miR-30a-5p Down FZD2 miR-27a-5p Up DLG2
miR-30a-5p Down GALNT2 miR-301a-3p Up ATP1A2
miR-30a-5p Down GJA1 miR-301a-3p Up GPT2
miR-30a-5p Down GNG10 miR-301a-3p Up NR3C2
miR-3613-5p Down CDK6 miR-301a-3p Up TGFBR2
miR-128-3p Up PIK3R1 miR-421 Up SLC4A4
miR-181d-5p Up PBX1 miR-429 Up LPIN1
miR-181d-5p Up TGFBR2 miR-4317 Up PIK3R1
miR-18a-3p Up PPAP2B miR-452-5p Up MEIS1
miR-196a-5p Up PBX1 miR-501-5p Up LPIN1
miR-196b-5p Up PBX1
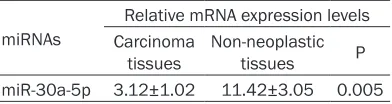
tive primer was F: GGGTGTA- AACATCCTCG; R: CTCAACTGG- TGTCGTGGAGTC, and the qu- antitative universal primer was CTCAACTGGTGTCGTGGAGTC. We found that hsa-miR-30a-5p expression levels in LSCC
tis-sues were significantly
down-regulated (P < 0.05).
Hsa-miR-30a-5p could be con-sidered as a potential diagnos-tic and therapeudiagnos-tic marker in LSCC. The results were shown below in Table 7.
Discussion
Since miRNAs were proved to be master regulators of post-transcriptional regulation and participate in diverse cellular physiological processes, it has been a priority to search for their functional roles. Dysre- gulation of miRNAs is found to be involved in distinct signal- ing pathways and closely as- sociated with pathoclinical pa- rameters of carcinogenesis, su- ch as apoptosis, proliferation, migration and invasiveness [14].
In this study, both the diffe- rentially expressed microRNAs mRNAs between LSCC sam-ples and para-carcinoma tis-sues were investigated and
analyzed. We identified 50
mi-RNAs (47 up- and 3 down-re- gulated) and 2381 mRNAs (1542 up- and 839 down-re- gulated) as differentially regu-lated in LSCC tissues as com-pared to corresponding non- neoplastic tissues. Then the two differentially expression
profiling between miRNAs and
[image:6.612.92.370.476.714.2]dif-Figure 3. MiRNA-Gene-Network Analysis. The miRNA-mRNA network was generated according to the relationship of significantly functional screened mRNAs and miRNAs. Red squares represent up-regulated miRNAs while blue ones represent down-regulated miRNAs, and cycles represent targeted screened genes. The relationship between miRNAs and genes was represented by lines.
ferent functional pathways regulated by the screened miRNAs potentially. Carcinogenesis relating pathways are found to be regulated a set of microRNAs, such as hsa-miR-3613-5p, hsa-miR-205-5p, and hsa-miR-301a-3p and
so on. And a significant decrease of
hsa-miR-30a-5p is noticed and validation has been per-formed using qRT-PCR. Further investigation should be done to elucidate the functional ro- le of hsa-miR-30a-5p. Previous relevant resear- ch reported dysregulated microRNAs in head and neck squamous cell carcinoma (HNSCC). In locally advanced HNSCC, miR-21, miR-155, let-7i, and 142-3p were overexpressed, miR-125b and miR-375 were down-regulated [8]. The expression level of miR-21, let-7, 18, 29c, 142-3p, 155, 146b (overexpressed) and 494 (underexpressed) was altered in primary HN- SCC [15]. In our study, a novel set of discrep-antly expressed microRNAs was found in pri-mary LSCC tissues, including miR-30a-5p, 36- 13 (up-regulated), and 128-3p, 181-5p, 18a-3p, 196a-5p, 1972, 200c-5p, 205-5p, 27a-5p,
301a-5p, 421, 429, 4317, 452, 501 (down- regulated).
[image:7.612.94.519.79.358.2]candi-Table 6. The result of miRNA-Pathway-Network analysis
miRNA miRNA style Pathname miRNA miRNA style Pathname
miR-30a-5p Down Cytokine-cytokine receptor interaction miR-181d-5p Up Hippo signaling pathway
miR-30a-5p Down TGF-beta signaling pathway miR-18a-3p Up Metabolic pathways
miR-30a-5p Down Glycosaminoglycan biosynthesis - keratan sulfate miR-18a-3p Up Glycerolipid metabolism
miR-30a-5p Down PI3K-Akt signaling pathway miR-18a-3p Up Fc gamma R-mediated phagocytosis
miR-30a-5p Down MicroRNAs in cancer miR-196a-5p Up Transcriptional misregulation in cancer
miR-30a-5p Down Neuroactive ligand-receptor interaction miR-196b-5p Up Transcriptional misregulation in cancer
miR-30a-5p Down Axon guidance miR-1972 Up Tight junction
miR-30a-5p Down Pathways in cancer miR-200c-5p Up Fc gamma R-mediated phagocytosis
miR-30a-5p Down Proteoglycans in cancer miR-205-5p Up Metabolic pathways
miR-30a-5p Down HTLV-I infection miR-205-5p Up Propanoate metabolism
miR-30a-5p Down Hippo signaling pathway miR-205-5p Up Insulin signaling pathway
miR-30a-5p Down Wnt signaling pathway miR-205-5p Up Pyruvate metabolism
miR-30a-5p Down Basal cell carcinoma miR-205-5p Up Adipocytokine signaling pathway
miR-30a-5p Down Metabolic pathways miR-205-5p Up Fatty acid metabolism
miR-30a-5p Down Arrhythmogenic right ventricular cardiomyopathy (ARVC) miR-205-5p Up Hippo signaling pathway
miR-30a-5p Down Chemokine signaling pathway miR-205-5p Up Tight junction
miR-30a-5p Down Alcoholism miR-27a-5p Up Hippo signaling pathway
miR-30a-5p Down Ras signaling pathway miR-301a-3p Up Salivary secretion
miR-3613-5p Down Cell cycle miR-301a-3p Up Aldosterone-regulated sodium reabsorption
miR-3613-5p Down Pathways in cancer miR-301a-3p Up Proximal tubule bicarbonate reclamation
miR-3613-5p Down PI3K-Akt signaling pathway miR-301a-3p Up Carbohydrate digestion and absorption
miR-3613-5p Down Small cell lung cancer miR-301a-3p Up Metabolic pathways
miR-3613-5p Down p53 signaling pathway miR-301a-3p Up Alanine, aspartate and glutamate metabolism
miR-3613-5p Down MicroRNAs in cancer miR-301a-3p Up Transcriptional misregulation in cancer
miR-3613-5p Down Viral carcinogenesis miR-301a-3p Up Hippo signaling pathway
miR-3613-5p Down Hepatitis B miR-421 Up Proximal tubule bicarbonate reclamation
miR-3613-5p Down Pancreatic cancer miR-429 Up Metabolic pathways
miR-3613-5p Down Chronic myeloid leukemia miR-429 Up Glycerolipid metabolism
miR-3613-5p Down Measles miR-4317 Up Insulin signaling pathway
miR-3613-5p Down Glioma miR-4317 Up Aldosterone-regulated sodium reabsorption
miR-3613-5p Down Melanoma miR-4317 Up Carbohydrate digestion and absorption
miR-128-3p Up Insulin signaling pathway miR-4317 Up Fc gamma R-mediated phagocytosis
miR-128-3p Up Aldosterone-regulated sodium reabsorption miR-452-5p Up Transcriptional misregulation in cancer
miR-128-3p Up Carbohydrate digestion and absorption miR-501-5p Up Metabolic pathways
miR-128-3p Up Fc gamma R-mediated phagocytosis miR-501-5p Up Glycerolipid metabolism
[image:8.792.96.702.82.554.2]Figure 4. MiRNA-Pathway-Network Analysis. The miRNA-mRNA network was generated according to the relationship of significantly functional screened mRNAs and miRNAs. Red squares represent up-regulated miRNAs while blue ones represent down-regulated miRNAs, and cycles represent pathways. The relationship between miRNAs and pathways was represented by lines.
Table 7. RT-PCR analysis between LSCC
tis-sues and their corresponding adjacent non-neoplastic tissues (paired sample t tests)
miRNAs
Relative mRNA expression levels Carcinoma
tissues Non-neoplastic tissues P miR-30a-5p 3.12±1.02 11.42±3.05 0.005
date biomarker for ovarian cancer diagnosis [31]. Up-regulation of hsa-miR-30a-5p was as- sociated with ovarian cancer chemotherapy re-
sistance and promoted carcinogenesis [32].
These findings may provide guidance for
clini-cal prediction, diagnosis and prognosis. And the mechanism of tumorigenesis needs further investigation in LSCC.
[image:9.612.92.288.620.672.2]mechanisms and evaluate the clinical applica-tion values. Results indicated that the dysregu-lation of hsa-miR-30a-5p was associated with disease development in LSCC and its
down-expression was validated by qRT-PCR. Our find -ings contribute to the understanding of the molecular basis of laryngeal squamous cell car-cinoma, thus helping to improve the diagnosis and treatment.
Acknowledgements
Supported by The Inner Mongolia Autonomous Region Natural Science Foundation (2015MS- 0834); Beijing Municipal Science & Technology Commission (No.Z141107002514003); Beijing Municipal Administration of Hospital Clinical Medicine Development of Special Funding Support (Code.XMLX201311); The Priming
Scientific Research Foundation for The Junior
Researcher in Beijing Tongren Hospital, Capital Medical University (2015-YJJ-ZZL-001).
Disclosure of conflict of interest
None.
Address correspondence to: Xiaoqin Liu, Depart- ment of Otolaryngology, The Inner Mongolia Auto- nomous Region People’s Hospital, No.20, Zhaowu- da Street, Saihan District, Huhhot, Inner Mongolia 010010, PR China. Tel: +86-15101181174; Fax: +86-471-8935518; E-mail: xiaoqinliu6049@163. com; Jugao Fang, Department of Otorhinolaryngo- logy-Head and Neck Surgery, Beijing Tongren Hos- pital, Capital Medical University, No.2, Chongwen- mennei Street, Dongcheng District, Beijing 100730, PR China. Tel: +86-18811612211; Fax: +86-10-58- 269858; E-mail: [email protected]
References
[1] Wu H, Liu T, Wang R, Tian S, Liu M, Li X and Tang H. MicroRNA-16 targets zyxin and pro-motes cell motility in human laryngeal carci-noma cell line HEp-2. IUBMB Life 2011; 63: 101-108.
[2] Fleskens SA, van der Laak JA, Slootweg PJ and Takes RP. Management of laryngeal premalig-nant lesions in the Netherlands. Laryngoscope 2010; 120: 1326-1335.
[3] Ren J, Zhu D, Liu M, Sun Y and Tian L. Down-regulation of miR-21 modulates Ras expres-sion to promote apoptosis and suppress inva-sion of laryngeal squamous cell carcinoma. Eur J Cancer 2010; 46: 3409-3416.
[4] Hunter KD, Parkinson EK and Harrison PR. Pro-filing early head and neck cancer. Nat Rev Can -cer 2005; 5: 127-135.
[5] Lian M, Fang J, Han D, Ma H, Feng L, Wang R and Yang F. Microarray gene expression analy-sis of tumorigeneanaly-sis and regional lymph node metastasis in laryngeal squamous cell carci-noma. PLoS One 2013; 8: e84854.
[6] Iorio MV, Ferracin M, Liu CG, Veronese A, Spiz-zo R, Sabbioni S, Magri E, Pedriali M, Fabbri M, Campiglio M, Menard S, Palazzo JP, Rosenberg A, Musiani P, Volinia S, Nenci I, Calin GA, Quer-zoli P, Negrini M and Croce CM. MicroRNA gene expression deregulation in human breast can-cer. Cancer Res 2005; 65: 7065-7070. [7] Bartel DP. MicroRNAs: genomics, biogenesis,
mechanism, and function. Cell 2004; 116: 281-297.
[8] Hui AB, Lenarduzzi M, Krushel T, Waldron L, Pintilie M, Shi W, Perez-Ordonez B, Jurisica I, O’Sullivan B, Waldron J, Gullane P, Cummings B and Liu FF. Comprehensive microRNA profil -ing for head and neck squamous cell carcino-mas. Clin Cancer Res 2010; 16: 1129-1139. [9] Kozaki K, Imoto I, Mogi S, Omura K and
Inaza-wa J. Exploration of tumor-suppressive microR-NAs silenced by DNA hypermethylation in oral cancer. Cancer Res 2008; 68: 2094-2105. [10] Tran N, McLean T, Zhang X, Zhao CJ, Thomson
JM, O’Brien C and Rose B. MicroRNA expres-sion profiles in head and neck cancer cell lines. Biochem Biophys Res Commun 2007; 358: 12-17.
[11] Enright AJ, John B, Gaul U, Tuschl T, Sander C and Marks DS. MicroRNA targets in drosophila. Genome Biol 2003; 5: R1.
[12] Shalgi R, Lieber D, Oren M and Pilpel Y. Global and local architecture of the mammalian mi-croRNA-transcription factor regulatory net-work. PLoS Comput Biol 2007; 3: e131. [13] Joung JG, Hwang KB, Nam JW, Kim SJ and
Zhang BT. Discovery of microRNA-mRNA mod-ules via population-based probabilistic learn-ing. Bioinformatics 2007; 23: 1141-1147. [14] Janiszewska J, Szaumkessel M and Szyfter K.
MicroRNAs are important players in head and neck carcinoma: a review. Crit Rev Oncol He-matol 2013; 88: 716-728.
[15] Chang SS, Jiang WW, Smith I, Poeta LM, Be-gum S, Glazer C, Shan S, Westra W, Sidransky D and Califano JA. MicroRNA alterations in head and neck squamous cell carcinoma. Int J Cancer 2008; 123: 2791-2797.
[16] Cheng Y, Chen G, Hu M, Huang J, Li B, Zhou L and Hong L. Has-miR-30a regulates autopha-gic activity in cervical cancer upon hydroxyc-amptothecin exposure. Biomed Pharmacother 2015; 75: 67-74.
[18] Baraniskin A, Birkenkamp-Demtroder K, Magh-nouj A, Zollner H, Munding J, Klein-Scory S, Reinacher-Schick A, Schwarte-Waldhoff I, Schmiegel W and Hahn SA. MiR-30a-5p sup-presses tumor growth in colon carcinoma by targeting DTL. Carcinogenesis 2012; 33: 732-739.
[19] Min J, Han T, Choi B, Hur K, Lee HJ and Yang HK. Abstract 3115: miR-30a-5p functions as a tumor suppressor gene in gastric cancer. Can-cer Research 2015; 75: 3115.
[20] Wang HY, Li YY, Fu S, Wang XP, Huang MY, Zhang X, Shao Q, Deng L, Zeng MS, Zeng YX and Shao JY. MicroRNA-30a promotes inva-siveness and metastasis in vitro and in vivo through epithelial-mesenchymal transition and results in poor survival of nasopharyngeal car-cinoma patients. Exp Biol Med (Maywood) 2014; 239: 891-898.
[21] Dai H, Kang B, Zuo D and Zuo G. [Effect of miR-30a-5p on the proliferation, apoptosis, inva-sion and migration of SMCC-7721 human he-patocellular carcinoma cells]. Zhonghua Gan Zang Bing Za Zhi 2014; 22: 915-920.
[22] Jia Z, Wang K, Wang G, Zhang A and Pu P. MiR-30a-5p antisense oligonucleotide suppresses glioma cell growth by targeting SEPT7. PLoS One 2013; 8: e55008.
[23] Wang X, Wang K, Han L, Zhang A, Shi Z, Zhang K, Zhang H, Yang S, Pu P and Shen C. PRDM1 is directly targeted by miR-30a-5p and modu-lates the Wnt/β-catenin pathway in a Dkk1-dependent manner during glioma growth. Can-cer Letters 2013; 331: 211-219.
[24] Wang T, Li F and Tang S. MiR-30a upregulates BCL2A1, IER3 and cyclin D2 expression by tar-geting FOXL2. Oncol Lett 2015; 9: 967-971. [25] Wen XP, Ma HL, Zhao LY, Zhang W and Dang
CX. MiR-30a suppresses non-small cell lung cancer progression through AKT signaling pathway by targeting IGF1R. Cell Mol Biol (Noisy-le-grand) 2015; 61: 78-85.
[26] Lian R, Lu B, Jiao L, Li S, Wang H, Miao W and Yu W. MiR-132 plays an oncogenic role in la-ryngeal squamous cell carcinoma by targeting FOXO1 and activating the PI3K/AKT pathway. Eur J Pharmacol 2016; 792: 1-6.
[27] Zhao H, Yang J, Fan T, Li S and Ren X. RhoE functions as a tumor suppressor in esopha-geal squamous cell carcinoma and modulates the PTEN/PI3K/Akt signaling pathway. Tumour Biol 2012; 33: 1363-1374.
[28] Li XT. Laryngeal squamous cell carcinoma pro-gression is associated with the NFkappaB sig-naling pathway regulated by IkappaB kinase beta. Eur Rev Med Pharmacol Sci 2016; 20: 467-475.
[29] Halifu Y, Liang JQ, Zeng XW, Ding Y, Zhang XY, Jin TB, Yakeya B, Abudu D, Zhou YM, Liu XM, Hu FX, Chai L, Kang XJ. Wnt1 and SFRP1 as potential prognostic factors and therapeutic targets in cutaneous squamous cell carcino-ma. Genet Mol Res 2016; 15.
[30] Ng EK, Chong WW, Jin H, Lam EK, Shin VY, Yu J, Poon TC, Ng SS, Sung JJ. Differential expres-sion of microRNAs in plasma of patients with colorectal cancer: a potential marker for colorectal cancer screening. Gut 2009; 58: 1375-81.
[31] Taylor DD and Gercel-Taylor C. MicroRNA signa-tures of tumor-derived exosomes as diagnostic biomarkers of ovarian cancer. Gynecol Oncol 2008; 110: 13-21.