Original Article
Validation of reference genes for the normalization of
qRT-PCR expression studies in head and neck
squamous cell carcinoma cell lines treated
by different chemotherapy drugs
Wenzhi Song1, Yingzi Li1, Ming Ren2, Dezhou Wang1, Yingcai Li1, Tianfu Zhang1, Wanzhong Yin3, Qiwei Yang2
1Department of Stomatology, China-Japan Union Hospital, Jilin University, Changchun 130031, China; 2Central
Laboratory of Second Hospital, Jilin University, Changchun 130041, China; 3Department of Otorhinolaryngology,
Head and Neck Surgery, First Clinical Hospital, Jilin University, Changchun 130021, China
Received September 15, 2017; Accepted January 16, 2018; Epub March 15, 2018; Published March 30, 2018
Abstract: Selection of stably expressed reference genes is crucial for data evaluation of quantitative real-time poly-merase chain reaction (qRT-PCR) assay via relative quantification method. In this present study, we were committed to selecting the optimal reference genes for the investigation of target gene expression profiling in head and neck squamous cell carcinoma (HNSCC). Two cell lines, CNE and FaDu, were investigated. Both of them were treated by 5 different common chemotherapy drugs (CTX, DDP, PTX, VCR, and 5-FU), respectively. 12 reference genes (GAPDH,
ACTB, B2M, 18S rRNA, ALAS1, RPL29, TBP, HPRT1, PUM1, HMBS, PPIA, and GUSB) which are commonly used in the qRT-PCR method for analysis of gene expression were investigated via geNorm, NormFinder, and BestKeeper programs. From the results, we conclude that ALAS1, ALAS1, and GAPDH are the optimal reference genes for study of the total group (both CNE and FaDu cell lines), CNE cell line, and FaDu cell line, respectively. If using multiple reference genes to improve accuracy, for the total group, the recommended combination was ALAS1 + HMBS + HPRT1. For the CNE cell line, the recommended combination was ALAS1 +RPL29. For the FaDu cell line, the rec-ommended combination was GAPDH +ALAS1 + HPRT1. Our findings provide a suitable approach via qRT-PCR that can be applied to investigate the pharmacological effects and the molecular mechanism of chemotherapy drugs on HNSCC.
Keywords: Quantitative real-time polymerase chain reaction, relative quantitation, reference gene, head and neck squamous cell carcinoma, chemotherapy treatment
Introduction
Relative quantification analysis is a common,
accurate, and easy to operate method which is widely used in many gene expression investiga-tions of molecular biological research. A stably expressed internal control gene is used as a standard to measure and compare the relative expression levels of target genes in the same biological sample. Therefore, in relative
quanti-fication analysis, it is very important to evaluate
and identify appropriate reference genes. Only the reference gene which is expressed stably under various experimental conditions can be considered as an ideal reference gene [1-3]. However, there are more and more studies that
have demonstrated that the expression levels of most reference genes, commonly used in
many studies, such as β-actin (ACTB), ribosom -al RNA (18S rRNA), and glycer-aldehyde-3-phos- glyceraldehyde-3-phos-phate dehydrogenase (GAPDH) are variable across cell types, or in distinct tissues [4-7], even between treatments of the same tissue [8-10]. Thus, it is very important to identify and choose optimal reference genes before
study-ing different kinds of cell types and tissues on
the gene expression level through relative
quantification analysis.
Each year, more than 500,000 head and neck
ly, approximately two-thirds of these patients are in advanced stages [12]. Radiotherapy or chemotherapy are the conventional treatmen- ts for the HNSCC patients. However, solving the chemotherapy multidrug resistance pro- blem has become the focus of the study [13]. Among the chemotherapy strategies of HNSCC, Cyclophosphamide (CTX), cis-Dichlorodiamine-platinum (II) (DDP), Paclitaxel (PTX), Vincristine (VCR), and 5-Fluorouracil (5-FU) are the most widely used chemotherapy drugs [14-17].
GAPDH, ACTB, B2M, 18S rRNA, ALAS1, RPL29,
TBP, HPRT1, PUM1, HMBS, PPIA, and GUSB
are commonly used references which have been validated and suggested as suitable ref-erence genes in the studies of certain other cancers [18, 19]. In order to determine the op- timal reference genes in gene expression st-
udies of HNSCC by relative quantification
an-alysis, these 12 candidate genes were vali- dated in the present study, both in CNE (hu- man nasopharyngeal carcinoma cell line) and FaDu (pharyngeal squamous cell carcinoma cell line).
Materials and methods
Cell culture and treatment
CNE and FaDu cell lines were donated by the Research Center of Second Hospital, Jilin University. They were cultivated according to the recommendation of the supplier, in IMDM containing 10% FBS with 100 units of Penicil- lin-Streptomycin for CNE, and RPMI 1640 con-taining 10% FBS with 100 units of Penicillin-Streptomycin for FaDu, maintained at 37°C in 5% CO2 humidified atmosphere.
CNE and FaDu cell lines were treated at a
con-fluency of 80-90% with CTX (final
concentra-tion was 2.00 mg/mL for CNE and FaDu), DDP
(final concentration was 0.45 μg/mL for CNE and 50 μg/mL for FaDu), PTX (final concentra
-tion was 0.84 μg/mL for CNE and 50 μg/mL for FaDu), VCR (final concentration was 2.00 μg/ mL for CNE and 6.18 μg/mL for FaDu), and 5-FU (final concentration was 100 μg/mL for CNE and 50 μg/mL for FaDu), respectively.
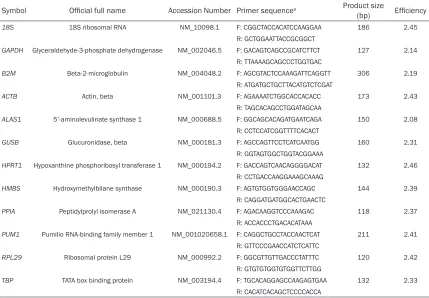
[image:2.612.91.520.86.384.2]Cells treated with medium only were used as Table 1. Summary of reference genes used in the present study
Symbol Official full name Accession Number Primer sequencea Product size
(bp) Efficiency
18S 18S ribosomal RNA NM_10098.1 F: CGGCTACCACATCCAAGGAA 186 2.45
R: GCTGGAATTACCGCGGCT
GAPDH Glyceraldehyde-3-phosphate dehydrogenase NM_002046.5 F: GACAGTCAGCCGCATCTTCT 127 2.14 R: TTAAAAGCAGCCCTGGTGAC
B2M Beta-2-microglobulin NM_004048.2 F: AGCGTACTCCAAAGATTCAGGTT 306 2.19
R: ATGATGCTGCTTACATGTCTCGAT
ACTB Actin, beta NM_001101.3 F: AGAAAATCTGGCACCACACC 173 2.43
R: TAGCACAGCCTGGATAGCAA
ALAS1 5’-aminolevulinate synthase 1 NM_000688.5 F: GGCAGCACAGATGAATCAGA 150 2.08 R: CCTCCATCGGTTTTCACACT
GUSB Glucuronidase, beta NM_000181.3 F: AGCCAGTTCCTCATCAATGG 160 2.31
R: GGTAGTGGCTGGTACGGAAA
HPRT1 Hypoxanthine phosphoribosyl transferase 1 NM_000194.2 F: GACCAGTCAACAGGGGACAT 132 2.46 R: CCTGACCAAGGAAAGCAAAG
HMBS Hydroxymethylbilane synthase NM_000190.3 F: AGTGTGGTGGGAACCAGC 144 2.39
R: CAGGATGATGGCACTGAACTC
PPIA Peptidylprolyl isomerase A NM_021130.4 F: AGACAAGGTCCCAAAGAC 118 2.37
R: ACCACCCTGACACATAAA
PUM1 Pumilio RNA-binding family member 1 NM_001020658.1 F: CAGGCTGCCTACCAACTCAT 211 2.41
R: GTTCCCGAACCATCTCATTC
RPL29 Ribosomal protein L29 NM_000992.2 F: GGCGTTGTTGACCCTATTTC 120 2.42 R: GTGTGTGGTGTGGTTCTTGG
TBP TATA box binding protein NM_003194.4 F: TGCACAGGAGCCAAGAGTGAA 132 2.33
the control. All cells were collected 24 hours after the treatment.
RNA extraction and reverse transcription
TRIzol Reagent (Invitrogen Life Technologies, USA) was used for extracting total RNA from each group. NanoDrop 2000 (Thermo Fisher
Scientific, USA) was used for measuring the
concentration and purity of the isolated RNA. DNase I was used for eliminating the residue
genomic DNA. 1 μg of total RNA was used for
reverse transcription reaction by M-MuLV First
Strand cDNA Synthesis kit (Sangon, China). All
operations were carried out according to the instructions.
Real-time quantitative polymerase chain reac-tion (RT-qPCR)
The primer sequences of 12 candidate refer-ence genes are listed in Table 1. All of these primer sequences were based on previous studies [20]. qRT-PCR was performed on Roche LightCycler 480 instrument (Roche, Germany). 2×SG Fast qPCR Master Mix (Sangon, China) was used for qRT-PCR, as previously described [20, 21]. The Cp value data were pre-convert- ed into relative quantities (Q) using the
equa-tion Q = 2-ΔCp [22] for the following statistical
analysis.
Amplification efficiency
A random pool of cDNA from the samples was
employed for determining the amplification efficiency of qRT-PCR. The cDNA was diluted
into 4 series, ranging from the original concen-tration to 1/1000 of the concenconcen-tration. The equation E = 10-1/slope was used for calculating the amplification efficiency.
Statistical analysis
The samples were divided into 3 groups: to-
tal group (taking both CNE and FaDu cell lines
into consideration), CNE group, and FaDu group. Three software programs, geNorm [23], NormFinder [24], and BestKeeper [25] were uti-lized to assess the stability of the reference genes as previously described [3, 6, 7, 21]. Results
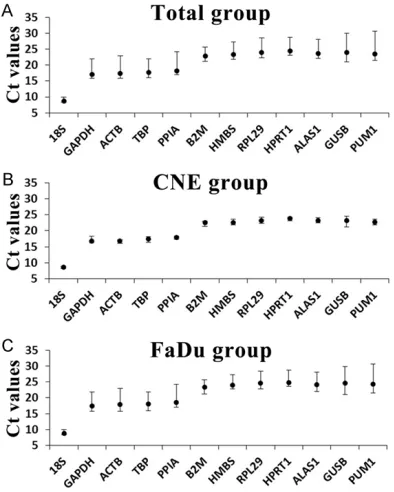
The Cp values of candidate reference genes
The expression profiles of the candidate refer
-ence genes were reflected by Cp values. A high -er Cp value indicates a low-er amount of expres-sion level. In Figure 1, we can see that the Cp values of all the samples range between 8.25
(18S rRNA) and 30.70 (PUM1).
The expression stability of candidate reference genes
GeNorm: From the results of geNorm in the
total group, HMBS and HPRT1 had the lowest M-values which means that they are the most stably expressed candidate genes in both CNE and FaDu cells treated with 5 types of chemo-therapy drugs. In the CNE group, ALAS1 and
RPL29 had the lowest M-values; in FaDu group,
GAPDH and ALAS1 had the lowest M-values
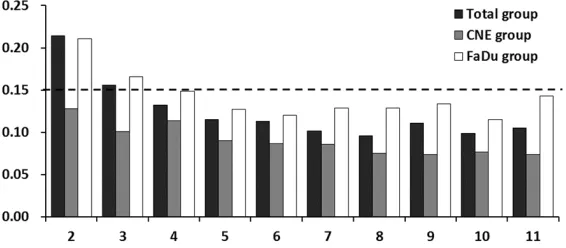
(Table 2). A combination of 4 reference genes, with V4/5 of 0.132 and 0.149, was optimal for the total group and FaDu group to further improve the normalization; 2 reference genes combined together was optimal for the CNE group, with V2/3 of 0.128 (Figure 2).
NormFinder: From the results of NormFinder,
we can see that the combination of ALAS1 and
HMBS has the lowest Stability value (0.079) which means that the combination of ALAS1
[image:3.612.90.287.73.319.2]and HMBS is the optimal choice for the total
group. If using a single reference gene, ALAS1
is considered to be the most stable candidate gene in this group, the second one is HMBS. In the CNE group, 18S rRNA is considered to be the most stable candidate gene, the second one is ALAS1. In the FaDu group, GAPDH is
considered to be the most stable candidate gene, the second one is HMBS (Table 2).
BestKeeper: Due to the characteristics of the
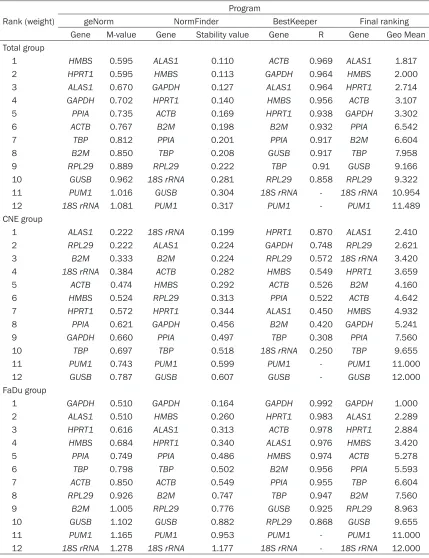
[image:4.612.90.519.84.642.2]BestKeeper program, only 10 candidate genes can be evaluated at a time. Even though the Table 2. Twelve candidate reference genes ranked by different software
Rank (weight)
Program
geNorm NormFinder BestKeeper Final ranking
Gene M-value Gene Stability value Gene R Gene Geo Mean Total group
1 HMBS 0.595 ALAS1 0.110 ACTB 0.969 ALAS1 1.817
2 HPRT1 0.595 HMBS 0.113 GAPDH 0.964 HMBS 2.000
3 ALAS1 0.670 GAPDH 0.127 ALAS1 0.964 HPRT1 2.714
4 GAPDH 0.702 HPRT1 0.140 HMBS 0.956 ACTB 3.107
5 PPIA 0.735 ACTB 0.169 HPRT1 0.938 GAPDH 3.302
6 ACTB 0.767 B2M 0.198 B2M 0.932 PPIA 6.542
7 TBP 0.812 PPIA 0.201 PPIA 0.917 B2M 6.604
8 B2M 0.850 TBP 0.208 GUSB 0.917 TBP 7.958
9 RPL29 0.889 RPL29 0.222 TBP 0.91 GUSB 9.166
10 GUSB 0.962 18S rRNA 0.281 RPL29 0.858 RPL29 9.322
11 PUM1 1.016 GUSB 0.304 18S rRNA - 18S rRNA 10.954
12 18S rRNA 1.081 PUM1 0.317 PUM1 - PUM1 11.489
CNE group
1 ALAS1 0.222 18S rRNA 0.199 HPRT1 0.870 ALAS1 2.410
2 RPL29 0.222 ALAS1 0.224 GAPDH 0.748 RPL29 2.621
3 B2M 0.333 B2M 0.224 RPL29 0.572 18S rRNA 3.420
4 18S rRNA 0.384 ACTB 0.282 HMBS 0.549 HPRT1 3.659
5 ACTB 0.474 HMBS 0.292 ACTB 0.526 B2M 4.160
6 HMBS 0.524 RPL29 0.313 PPIA 0.522 ACTB 4.642
7 HPRT1 0.572 HPRT1 0.344 ALAS1 0.450 HMBS 4.932
8 PPIA 0.621 GAPDH 0.456 B2M 0.420 GAPDH 5.241
9 GAPDH 0.660 PPIA 0.497 TBP 0.308 PPIA 7.560
10 TBP 0.697 TBP 0.518 18S rRNA 0.250 TBP 9.655
11 PUM1 0.743 PUM1 0.599 PUM1 - PUM1 11.000
12 GUSB 0.787 GUSB 0.607 GUSB - GUSB 12.000
FaDu group
1 GAPDH 0.510 GAPDH 0.164 GAPDH 0.992 GAPDH 1.000
2 ALAS1 0.510 HMBS 0.260 HPRT1 0.983 ALAS1 2.289
3 HPRT1 0.616 ALAS1 0.313 ACTB 0.978 HPRT1 2.884
4 HMBS 0.684 HPRT1 0.340 ALAS1 0.976 HMBS 3.420
5 PPIA 0.749 PPIA 0.486 HMBS 0.974 ACTB 5.278
6 TBP 0.798 TBP 0.502 B2M 0.956 PPIA 5.593
7 ACTB 0.850 ACTB 0.549 PPIA 0.955 TBP 6.604
8 RPL29 0.926 B2M 0.747 TBP 0.947 B2M 7.560
9 B2M 1.005 RPL29 0.776 GUSB 0.925 RPL29 8.963
10 GUSB 1.102 GUSB 0.882 RPL29 0.868 GUSB 9.655
11 PUM1 1.165 PUM1 0.953 PUM1 - PUM1 11.000
top two unstable candidate reference genes
ranked by geNorm and NormFinder in the CNE
group and FaDu group are the same, in the total group they are not. In order to avoid the standard confusion, we only considered the result of geNorm and removed the top two un-stable candidate genes from each group be- fore analyzing. From the results of BestKeep-er, we can see that the most stable candida- te gene in total group is ACTB, the second one
is GAPDH. In the CNE group, the most stably
expressed candidate gene is HPRT1, the sec-ond one is GAPDG. In the FaDu group, the most stably expressed candidate gene is GAPDH, the second one is HPRT1 (Table 2).
Final ranking of the candidate reference genes
The M-values obtained from geNorm, stability values obtained from NormFinder, R values
obtained from BestKeeper, and their rankings
of candidate reference genes obtained from all 3 programs are listed in Table 2. Because the
rankings of the candidate genes varied slightly, the geometric means of the ranking numbers
from 3 programs were calculated to provide an
overall ranking of the best candidate reference
genes. The smaller geometric mean the candi-date gene had the more stably the candicandi-date
gene was expressed [26]. The final ranking of
the candidate reference genes is also given in Table 2. According to the final ranking, ALAS1
and HMBS are considered as the optimal
refer-ence genes that can be used in the studies of CNE and FaDu cell lines treated by chemother-apy drugs. ALAS1 is considered as the optimal reference gene that can be used in the study of CNE with chemotherapy drug treatment, follow
expression in the HNSCC cell line, treated by 5
kinds of chemotherapy drugs. We found that
ALAS1, ALAS1 and GAPDH were the optimal
reference genes for the study of total group, the CNE group, and the FaDu group, respectively. If 2 or more reference genes are needed to achieve better standardization effect, ALAS1 +
HMBS + HPRT1 is considered to be the optimal
combination for the total group; ALAS1 +
RPL29 is considered to be the optimal for the
CNE cell line; GAPDH + ALAS1 + HPRT1 is con-sidered to be the optimal for the FaDu cell line. The twelve candidate genes in the present study, including GAPDH, ACTB, B2M, 18S rRNA,
ALAS1, RPL29, TBP, HPRT1, PUM1, HMBS,
PPIA, and GUSB, have been commonly used for
relative quantification analysis on the study of
human tissues or cell lines, and the primer sequences were derived from previous studies [7]. The expression levels of 12 genes deter-mined by qRT-PCR were presented as Cp val-ues. In this study, Cp values of all the samples ranged between 8.25 (18S rRNA) and 30.70 (PUM1), which is within an acceptable range and could be used as candidate reference genes, as shown in previous studies [27, 28]. To assess more accurate reference gene ex- pression patterns, three specialized programs (geNorm, NormFinder, and BestKeeper) were employed for data analyzing. The results
pro-vided are slightly different in the ranking of the
candidate gene expression stabilities by the three programs, which is possibly caused by different calculation algorithms [29, 30]. For
instance, in total group, geNorm ranked the top
[image:5.612.92.375.76.200.2]four genes, in order, as HMBS, HPRT1, ALAS1,
Figure 2. The optimal number of reference genes for normalization. X-axis represents the number of genes that should be used as a combination to achieve a satisfactory accuracy in the relative quantification analysis; Y-axis stands for the pairwise variation value.
by RPL29. GAPDH is
consid-ered as the optimal reference gene that can be used in the study of FaDu with chemo-therapy drug treatment, follow
by ALAS1.
Discussion
In our present study, a sys-tematic evaluation of stability and applicability of reference genes was conducted in order to choose optimal reference genes for performing a more
and GAPDH. NormFinder ranked in a different
order, as ALAS1, HMBS, GAPDH, and HPRT1. BestKeeper even had an alternative gene, as
ACTB, GAPDH, ALAS1, and HMBS. In the CNE
group, ALAS1 was ranked first and second by
geNorm and NormFinder respectively, but
ranked seventh by BestKeeper. However, all
three programs produced the same unstable genes. GUSB was ranked within the last five in
all groups, and PUM1 was ranked within the
last two in all groups. In recent studies, RPL family genes showed a high stability in both human breast cancer cell lines and FFPE biop-sies, but GAPDH performed poorly [31]. GAPDH
was also found to be unsuitable in the study of bladder cancer cell lines, in which B2M was considered as the most reliable reference gene [32]. In a study of endometrial carcinoma,
PUM1 and PPIA showed a high stability, but RPL
family genes performed poorly [33]. Taken together, these findings reinforce the notion
that the expression of reference genes is con-text-dependent and has a large variation in dif-ferent cell types or between treatments in the same cell types. These wide variations may be due to the effect of the toxic effects of chemo-therapy drugs on the modulation of gene expressions of the 12 reference genes that have diverse cellular functions. Thus, validat- ing and evaluating the expression stabilities of reference genes and selecting the most
sta-ble reference gene is the key to the accuracy of
the experiments, before further quantitative studies in different samples or experimental conditions.
Since the expression stabilities of candidate
genes were ranked slightly different, the geo
-metric means of the ranking numbers from 3
programs were calculated to provide an overall
ranking of the best candidate reference genes.
The smaller geometric mean the candidate gene has the more stably the candidate gene
was expressed [26]. The final ranking of the
candidate reference genes shows that ALAS1,
ALAS1, and GAPDH are suggested to be the
optimal reference genes for the study of both CNE and FaDu cell lines together, CNE cell line, and FaDu cell line, respectively. In addition, the Minimum Information for Publication of Quan- titative Real-Time PCR Experiments (MIQE) guidelines state that normalization can be fur-ther improved by using multiple reference genes [34]. If using multiple reference genes to
improve accuracy of relative quantification
analysis, considering the V value results which is provided by geNorm program, 2-4 reference genes combined together is suggested as opti-mal for each group. However, according to the
standardized principle of relative quantification
analysis, this result only provides a guide to decide how many reference genes should be used as a combination for further improving normalization [23], instead of a stringent stan-dard consideration. Previous studies have rec-ommend that a combination of 3 internal control genes is accurate enough for perform-ing a relative quantitative investigation [35]. Comprehensively considering the results of all the 3 programs, it is proposed that the recom-mended combination for the total group is
ALAS1 + HMBS + HPRT1; the recommended
reference gene combination for the CNE cell line is ALAS1 +RPL29; the recommended ref-erence gene combination for the FaDu cell line
is GAPDH +ALAS1 + HPRT1.
Conclusions
Twelve candidate reference genes were
evalu-ated under treatment of 5 kinds of chemother
-apy drugs in two kinds of HNSCC cell lines. Our
present study was committed to analyzing and evaluating the expression stability of reference genes in the chemotherapy drugs that treated HNSCC cell lines. For the simultaneous study of the effects on CNE and FaDu cell lines treated
by 5 kinds of chemotherapeutic drugs, ALAS1
gene or the combination of ALAS1, HMBS and
HPRT1 gene is considered the most suitable
reference gene. For the study of the effects on
CNE cell line treated by 5 kinds of chemothera -peutic drugs, ALAS1 gene or the combination
of ALAS1 and RPL29 gene is considered the
most suitable reference gene. For the study of
the effects on FaDu cell line treated by 5 kinds
of chemotherapeutic drugs, GAPDH gene or the combination of GAPDH, ALAS1 and HPRT1
the pharmacological effects and underlying molecular mechanism of chemotherapy drugs on HNSCC.
Acknowledgements
This study was supported in part by grants from The Science and Technology Department of Jilin Province, P.R.C. (No. 20110708, No. 20140101055JC, No. 20180520111JH), and The Education Department of Jilin Province, P.R.C. (No. JJKH20170853KJ), The Health Sci-
entific Research Foundation of Jilin Province,
P.R.C (No. 2015Q024).
Disclosure of conflict of interest
None.
Address correspondence to: Dr. Wanzhong Yin, Department of Otorhinolaryngology, Head and Neck Surgery, First Clinical Hospital, Jilin Univer- sity, Changchun 130021, China; E-mail: [email protected]; Dr. Qiwei Yang, Central La- boratory of Second Hospital, Jilin University, Chang- chun 130041, China. Tel: +86-431-81136667; Fax: +86-431-81136667; E-mail: [email protected]
References
[1] Radonic A, Thulke S, Mackay IM, Landt O, Sieg-ert W and Nitsche A. Guideline to reference gene selection for quantitative real-time PCR. Biochem Biophys Res Commun 2004; 313: 856-862.
[2] Derveaux S, Vandesompele J and Hellemans J. How to do successful gene expression analysis using real-time PCR. Methods 2010; 50: 227-230.
[3] Yang Q, Li X, Ali HA, Yu S, Zhang Y, Wu M, Gao S, Zhao G, Du Z and Zhang G. Evaluation of suitable control genes for quantitative poly-merase chain reaction analysis of maternal plasma cell-free DNA. Mol Med Rep 2015; 12: 7728-7734.
[4] Ali H, Du Z, Li X, Yang Q, Zhang YC, Wu M, Li Y and Zhang G. Identification of suitable refer-ence genes for gene expression studies using quantitative polymerase chain reaction in lung cancer in vitro. Mol Med Rep 2015; 11: 3767-3773.
[5] Ma H, Yang Q, Li D and Liu J. Validation of suit-able reference genes for quantitative poly-merase chain reaction analysis in rabbit bone marrow mesenchymal stem cell differentia-tion. Mol Med Rep 2015; 12: 2961-2968. [6] Yang Q, Ali HA, Yu S, Zhang L, Li X, Du Z and
Zhang G. Evaluation and validation of the
suit-able control genes for quantitative PCR studies in plasma DNA for noninvasive prenatal diag-nosis. Int J Mol Med 2014; 34: 1681-1687. [7] Yu S, Yang Q, Yang JH, Du Z and Zhang G.
Iden-tification of suitable reference genes for inves-tigating gene expression in human gallbladder carcinoma using reverse transcription quanti-tative polymerase chain reaction. Mol Med Rep 2015; 11: 2967-2974.
[8] He YX, Zhang Y, Yang Q, Wang C and Su G. Se-lection of suitable reference genes for reverse transcription-quantitative polymerase chain reaction analysis of neuronal cells differenti-ated from bone mesenchymal stem cells. Mol Med Rep 2015; 12: 2291-2300.
[9] Li X, Yang Q, Bai J, Xuan Y and Wang Y. Identifi-cation of appropriate reference genes for hu-man mesenchymal stem cell analysis by quan-titative real-time PCR. Biotechnol Lett 2015; 37: 67-73.
[10] Li X, Yang Q, Bai J, Yang Y, Zhong L and Wang Y. Identification of optimal reference genes for quantitative PCR studies on human mesenchy-mal stem cells. Mol Med Rep 2015; 11: 1304-1311.
[11] Greenlee RT, Murray T, Bolden S and Wingo PA. Cancer statistics, 2000. CA Cancer J Clin 2000; 50: 7-33.
[12] Clark JI, Hofmeister C, Choudhury A, Matz G, Collins S, Bastian R, Melian E, Emami B and Petruzzelli G. Phase II evaluation of paclitaxel in combination with carboplatin in advanced head and neck carcinoma. Cancer 2001; 92: 2334-2340.
[13] Shen B, Dong P, Li D and Gao S. Expression and function of ABCG2 in head and neck squa-mous cell carcinoma and cell lines. Exp Ther Med 2011; 2: 1151-1157.
[14] Elias ST, Borges GA, Rêgo DF, E Silva LF, Aveli-no S, DE Matos Neto JN, Simeoni LA and Guer-ra EN. Combined paclitaxel, cisplatin and fluo-rouracil therapy enhances ionizing radiation effects, inhibits migration and induces G0/G1 cell cycle arrest and apoptosis in oral carcino-ma cell lines. Oncol Lett 2015; 10: 1721-1727. [15] Khan Z, Khan N, Varma AK, Tiwari RP, Mouha-mad S, Prasad GB and Bisen P. Oxaliplatin-mediated inhibition of survivin increases sen-sitivity of head and neck squamous cell carcinoma cell lines to paclitaxel. Curr Cancer Drug Targets 2010; 10: 660-669.
[16] Tai KW, Chou MY, Hu CC, Yang JJ and Chang YC. Induction of apoptosis in KB cells by ping-yangmycin. Oral Oncol 2000; 36: 242-247. [17] Tamatani T, Ferdous T, Takamaru N, Hara K,
[18] Ohl F, Jung M, Xu C, Stephan C, Rabien A, Bur-khardt M, Nitsche A, Kristiansen G, Loening SA, Radonic A and Jung K. Gene expression studies in prostate cancer tissue: which refer-ence gene should be selected for normaliza-tion? J Mol Med (Berl) 2005; 83: 1014-1024. [19] Huan P, Maosheng T, Zhiqian H, Long C and
Xiaojun Y. TLR4 expression in normal gallblad-der, chronic cholecystitis and gallbladder carci-noma. Hepatogastroenterology 2012; 59: 42-46.
[20] Wang XN, Yang QW, Du ZW, Yu T, Qin YG, Song Y, Xu M and Wang JC. Evaluation of the stability of reference genes in bone mesenchymal stem cells from patients with avascular necrosis of the femoral head. Genet Mol Res 2016; 15. [21] Yang J, Yang Q, Yu S and Zhang X. Evaluation
and validation of suitable reference genes for reverse transcription-quantitative polymerase chain reaction studies in cholangiocarcinoma patients and cell lines. Oncol Lett 2016; 11: 2673-2681.
[22] Livak KJ and Schmittgen TD. Analysis of rela-tive gene expression data using real-time quantitative PCR and the 2(-Delta Delta C(T)) Method. Methods 2001; 25: 402-408. [23] Vandesompele J, De Preter K, Pattyn F, Poppe
B, Van Roy N, De Paepe A and Speleman F. Ac-curate normalization of real-time quantitative RT-PCR data by geometric averaging of multi-ple internal control genes. Genome Biol 2002; 3: Research0034.
[24] Andersen CL, Jensen JL and Orntoft TF. Nor-malization of real-time quantitative reverse transcription-PCR data: a model-based vari-ance estimation approach to identify genes suited for normalization, applied to bladder and colon cancer data sets. Cancer Res 2004; 64: 5245-5250.
[25] Pfaffl MW, Tichopad A, Prgomet C and Neuvi-ans TP. Determination of stable housekeeping genes, differentially regulated target genes and sample integrity: BestKeeper--Excel-based tool using pair-wise correlations. Biotechnol Lett 2004; 26: 509-515.
[26] Chen D, Pan X, Xiao P, Farwell MA and Zhang B. Evaluation and identification of reliable refer-ence genes for pharmacogenomics, toxicoge-nomics, and small RNA expression analysis. J Cell Physiol 2011; 226: 2469-2477.
[27] Jiang Q, Wang F, Li MY, Ma J, Tan GF and Xiong AS. Selection of suitable reference genes for qPCR normalization under abiotic stresses in Oenanthe javanica (BI.) DC. PLoS One 2014; 9: e92262.
[28] Wan H, Yuan W, Ruan M, Ye Q, Wang R, Li Z, Zhou G, Yao Z, Zhao J, Liu S and Yang Y. Identi-fication of reference genes for reverse tran-scription quantitative real-time PCR normaliza-tion in pepper (Capsicum annuum L.). Biochem Biophys Res Commun 2011; 416: 24-30. [29] Chang E, Shi S, Liu J, Cheng T, Xue L, Yang X,
Yang W, Lan Q and Jiang Z. Selection of refer-ence genes for quantitative gene expression studies in Platycladus orientalis (Cupressace-ae) using real-time PCR. PLoS One 2012; 7: e33278.
[30] Bruge F, Venditti E, Tiano L, Littarru GP and Da-miani E. Reference gene validation for qPCR on normoxia- and hypoxia-cultured human der-mal fibroblasts exposed to UVA: is beta-actin a reliable normalizer for photoaging studies? J Biotechnol 2011; 156: 153-162.
[31] El Hadi H, Abdellaoui-Maane I, Kottwitz D, El Amrani M, Bouchoutrouch N, Qmichou Z, Kark-ouri M, ElAttar H, Errihani H, Fernandez PL, Bakri Y, Sefrioui H and Moumen A. Develop-ment and evaluation of a novel RT-qPCR based test for the quantification of HER2 gene ex-pression in breast cancer. Gene 2017; 605: 114-122.
[32] Lima L, Gaiteiro C, Peixoto A, Soares J, Neves M, Santos LL and Ferreira JA. Reference genes for addressing gene expression of bladder can-cer cell models under hypoxia: a step towards transcriptomic studies. PLoS One 2016; 11: e0166120.
[33] Ayakannu T, Taylor AH, Willets JM, Brown L, Lambert DG, McDonald J, Davies Q, Moss EL and Konje JC. Validation of endogenous con-trol reference genes for normalizing gene ex-pression studies in endometrial carcinoma. Mol Hum Reprod 2015; 21: 723-735.
[34] Bustin SA, Benes V, Garson JA, Hellemans J, Huggett J, Kubista M, Mueller R, Nolan T, Pfaffl MW, Shipley GL, Vandesompele J and Wittwer CT. The MIQE guidelines: minimum information for publication of quantitative real-time PCR experiments. Clin Chem 2009; 55: 611-622. [35] Wisnieski F, Calcagno DQ, Leal MF, dos Santos