Original Article
Comparative analysis of reliability and validity
of six glucometers according to hematocrit
based on ISO guidelines
Min-Hee Kim1, Sang-Kil Bae2, Kyung-Soo Kim1
1Department of Family Medicine, Seoul St. Mary’s Hospital, College of Medicine, Seoul, Republic of Korea; 2School of Public Health, The Catholic University of Korea, Seoul, Republic of Korea
Received August 6, 2017; Accepted November 23, 2017; Epub February 15, 2018; Published February 28, 2018
Abstract: The management of diabetes using different methods such as diet, exercise, and medical treatment can delay the progression of diabetes and its complications. Complications of diabetes can be reduced by the careful regulation of blood glucose. Self-monitoring blood glucose enables diabetes patients to control their blood glucose levels effectively and is used globally to manage diabetes, indicating the importance of blood glucose testing. ISO 15197:2013 is an international regulation for verifying the reliability and validity of glucometers. Here, we evalu-ated six glucometers that were purchased randomly on the Korean market using the following verification criteria: precision evaluation, accuracy evaluation, and effect of hematocrit concentration. All verifications were performed according to ISO 15197:2013. In a repeatability study, the range for the total coefficient of variation was 1.3-4.3%, 1.5-5.7%, and 1.4-3.4%, respectively. In the intermediate precision evaluation, the coefficient of variation was 1.6-6.6%, 2.5-6.8%, and 1.1-3.3% for the three levels of control specimen (51-110, 151-250, 251-400 mg/dL), respec -tively. Three glucometers met ISO 15197:2013 for the accuracy criteria, and only one glucometer met the ISO 15197 hematocrit effect. More than 80% of the evaluated glucometers did not fulfill the ISO 15197:2013 criteria, and most were affected by the hematocrit concentration. These inaccurate results can increase the risk of uncontrolled blood glucose levels in diabetes patients, who should consider these limiting functions when evaluating their results. As venous blood was used in this study, further evaluations will be needed to confirm the results using capillary blood.
Keywords: Glucometer, reliability, validity, ISO guidelines
Introduction
The prevalence of diabetes mellitus (DM) is greatly increasing, and the number of patients suffering from this disease is estimated to reach around 415 million (415,000,000) by 2015 [1]. The number of diabetes patients is rapidly increasing particularly due to the aging society and lifestyle changes, and the preva-lence of DM in Korea has also increased 5- to
6-fold from approximately 1.5% to 7-9% in the
last 30 years [2]. Thus, DM is becoming a world-wide social issue. It has been proven recently that blood glucose control and blood pressure control along with various treatment methods can reduce acute complications and the pro-gression of disease in types 1 and 2 diabetes [3]. Blood glucose levels can be managed by different ways such as diet, exercise, and medi-cal treatment. The most important factor is for
aware of his/her own fluctuating blood glucose
levels through self-measurement and motivat-ed regarding the necessity of self-control. As a result, the disease can be better controlled, and progression to diabetic retinopathy, neu-ropathy, nephneu-ropathy, and other complications can be prevented [4, 5]. The accuracy of glu-cometers is very important because their func-tion has a direct effect on the control of blood glucose levels such as the determining the dos-age of insulin [6].
3) to avoid severe hyperglycemia caused by using medications that can affect the secretion or function of insulin, or by being at increased risk such as in comorbidities and aging, 4) to control medications according to lifestyle
modi-fications such as exercise or change in diet, and
5) to inform the decision regarding the need to initiate insulin treatment in gestational diabe-tes [3].
The International Organization for Standardi- zation (ISO) 15197:2013, which is an interna-tional standard set to evaluate the function of glucometers, states that the product should satisfy at least two of the accuracy parameters.
The first parameter indicates that for glucose levels less than 100 mg/dL, 95% of results should be within ±15 mg/dL of laboratory val
-ues, and for levels greater than 100 mg/dL, 95% of results should be within the % bias ±15% compared to the index value. The second
parameter is described as all measurements
reaching 99% of Zone A and Zone B of the
Consensus Error Grid (CEG) [7].
In Korea, the current domestic glucose meter market share is almost 86 million dollars based on production and import/export per product,
with 16.1% growth per year on average within
the last 5 years. There are 16 domestic rations and approximately 13 overseas corpo-rations in the domestic market [8].
In this study, we randomly purchased six glu-cometers currently being sold on the domestic market and evaluated their general functions. Glucometers can be categorized into two types.
The first is the electrochemical type, which
quantitatively measures the electrons being generated by using electrodes when glucose is oxidized into hydrogen peroxide or oxidized medium and then returns to its original oxidized form; the second is the spectrometric type,
which quantitatively measures reflectance and
penetrance by using a spectrometer to mea-sure the degree of change in color using a chro-mogen (H2O2) that causes a color change when glucose is oxidized.
Most international glucometers are the electro-chemical type and use glucose oxidase (GOX) as the reaction enzyme. GOX acquires elec-trons by oxidizing glucose, which can be affect-ed by blood oxygen levels; thus, glucose level measurements can only be performed through
capillaries. However, a product that uses glu-cose dehydrogenase (GDH), which is unaffect-ed by blood oxygen levels, has been introducunaffect-ed recently. A large advantage of using GDH is that
it is not influenced by blood oxygen levels, as it
acquires electrons by isolating hydrogen from glucose; therefore, it can measure blood glu-cose in a capillary, vein, or artery. This study did not recruit subjects and instead used remain-ing venous blood scheduled to be discarded after regular checkups, and all six types of test-ed glucometers ustest-ed the glucose
dehydroge-nase flavin adenine dinucleotide (GDH-FAD)
enzyme.
Materials and methods
Products and samples
In this study, we evaluated the precision, accu-racy, and interference effect of hematocrit of six glucometers being sold domestically. The products were labeled as A, B, C, D, E, and F companies. All six types of glucometers were products that measure blood glucose levels using venous blood samples, as they use the GDH-FAD enzyme.
Precision was evaluated by two methods, rep- eatability and intermediate precision, accord-ing to the ISO 15197:2013 guideline.
All experiments necessary for the study used remaining blood that was to be discarded after HbA1c tests were performed for patients who had visited the endocrinology department of a general hospital in Anyang, Korea. All concen-tration measurements and number of samples were evaluated by calculation according to the ISO 15197:2013 guideline.
Because we used remaining blood samples that were to be discarded, we may be exempt from informed consent. This study received approval from the Institutional Review Board of the Catholic University of Korea (IRB approval number: MC16OASI0052).
Evaluation
Remnant blood samples slated for disposal were used as specimens for reproducibility evaluation. Three different concentrations of
specimen (51-110, 151-250, 251-400 mg/dL)
were used as per the ISO 15197:2013 guide-line. Glycolysis was performed to produce a
low-glucose specimen, and 20,000 mg/dL
Glucose D-stick solution (Sigma, USA) was used to produce a high-glucose specimen of a desired concentration. Each specimen was measured 20 times per device in order to eval-uate the precision, and interim precision was evaluated by creating three specimens
(51-110, 151-250, 251-400 mg/dL) with PBS (pho-sphate buffer saline) and 40,000 mg/dL
Glucose D-stick solution and taking measure-ments twice daily for 10 d in total.
The accuracy of the six different blood glucose monitors was evaluated using 100 remnant blood samples as per ISO 15197:2013. Six venous blood samples slated for disposal were randomly selected per each blood glucose monitor, and the samples were measured con-tinuously using a pipette. Immediately after the measurement of the blood glucose level, the samples were centrifuged for 10 min at 2,000×
g, and two consecutive measurements of
plas-ma glucose were ob- tained using an automat-ed chemical analyzer (Roche Cobas 600; Ro- che diagnostic GmbH). The automated chemical analyzer used in this eval-uation is a central labora-tory biochemical device that uses hexokinase, a reference method for bl- ood glucose measure-ment, to measure the plasma glucose level. The measured values of each blood glucose moni-tor were compared to the reference blood glucose level and subjected to relativity analysis through simple regression
analy-sis, and 95% confidence
[image:3.612.91.396.85.349.2]intervals were obtained. Furthermore, measure-ment error was obtained
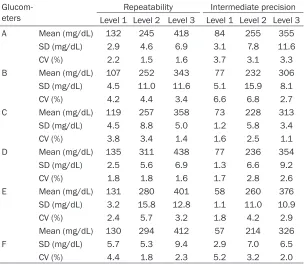
Table 1. Precision results of glucometers
Glucom-eters Level 1 Level 2 Level 3 Level 1 Level 2 Level 3Repeatability Intermediate precision
A Mean (mg/dL) 132 245 418 84 255 355
SD (mg/dL) 2.9 4.6 6.9 3.1 7.8 11.6
CV (%) 2.2 1.5 1.6 3.7 3.1 3.3
B Mean (mg/dL) 107 252 343 77 232 306
SD (mg/dL) 4.5 11.0 11.6 5.1 15.9 8.1
CV (%) 4.2 4.4 3.4 6.6 6.8 2.7
C Mean (mg/dL) 119 257 358 73 228 313
SD (mg/dL) 4.5 8.8 5.0 1.2 5.8 3.4
CV (%) 3.8 3.4 1.4 1.6 2.5 1.1
D Mean (mg/dL) 135 311 438 77 236 354
SD (mg/dL) 2.5 5.6 6.9 1.3 6.6 9.2
CV (%) 1.8 1.8 1.6 1.7 2.8 2.6
E Mean (mg/dL) 131 280 401 58 260 376
SD (mg/dL) 3.2 15.8 12.8 1.1 11.0 10.9
CV (%) 2.4 5.7 3.2 1.8 4.2 2.9
F
Mean (mg/dL) 130 294 412 57 214 326
SD (mg/dL) 5.7 5.3 9.4 2.9 7.0 6.5
CV (%) 4.4 1.8 2.3 5.2 3.2 2.0
Abbreviations: SD, Standard Deviation; CV, Coefficient of Variation.
using the CLSI EPO9-A2:2004 method with
comparison and bias estimating using patient samples [9].
Blood samples were manipulated by adding or
removing plasma to achieve five hematocrit intervals (20±2%, 30±2%, 40±2%, 50±2%, 60±2%), as per ISO 15197:2013. Each sample
was again manipulated by adding or removing glucose to produce three different glucose con-centrations per sample, for a total of 15 samples.
Statistical analysis
Microsoft Excel 2010 (Microsoft, NY, USA) soft-ware was used for all statistical analyses. The measurements from the blood glucose moni-tors were compared and analyzed using the mean of two measurements from the au- tomated chemical analyzer as the reference value, and values outside a measurement error
of ±4 mg/dL for blood glucose levels greater than 100 mg/dL and those outside a measure
-ment error of ±4% for blood glucose levels less than 100 mg/dL were excluded from statistical
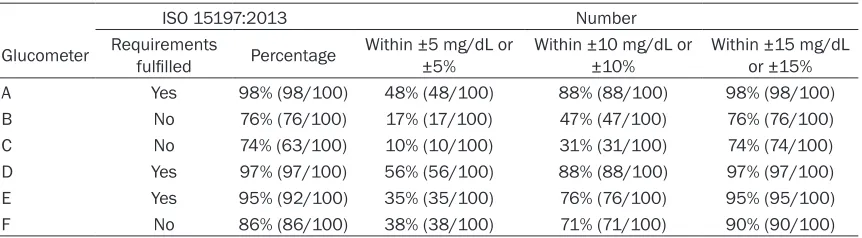
indi-Table 2. Accuracy results of glucometers
ISO 15197:2013 Number
Glucometer Requirements fulfilled Percentage Within ±5 mg/dL or ±5% Within ±10 mg/dL or ±10% Within or ±15%±15 mg/dL
A Yes 98% (98/100) 48% (48/100) 88% (88/100) 98% (98/100)
B No 76% (76/100) 17% (17/100) 47% (47/100) 76% (76/100)
C No 74% (63/100) 10% (10/100) 31% (31/100) 74% (74/100)
D Yes 97% (97/100) 56% (56/100) 88% (88/100) 97% (97/100)
E Yes 95% (92/100) 35% (35/100) 76% (76/100) 95% (95/100)
F No 86% (86/100) 38% (38/100) 71% (71/100) 90% (90/100)
cated by ISO/DIS 15197:2013: ≥95% of mea
-surements falling within ±15 mg/dL of the stan -dard value difference if the stan-dard value of
blood glucose level is <100 mg/dL, ≥95% of measurements falling within ±15% of %Bias if
the standard value to blood glucose level is
≥100 mg/dL, and ≥95% of total standard val -ues satisfying these criteria. Error grid analysis to evaluate clinical accuracy was also
per-formed, and five areas (A, B, C, D, E) of a con -sensus error grid were marked.
The representative value of a sample was
des-ignated as the mean of five measurements per
concentration, and hematocrit interference was evaluated by obtaining the measurement error of each sample with a measured value of
40±2% as the standard hematocrit value.
Results
The distribution of the repetitive coefficient of variation of the six glucometers was 1.8-4.4% at Level 1, 1.5-5.7% at Level 2, and 1.4-3.4% at Level 3. The distributions of the coefficient of
variation of intermediate precision were
1.6-6.6%, 2.5-6.8%, and 1.1-3.3% at Levels 1, 2,
and 3, respectively (Table 1). As there is no
pro-tocol for precision that satisfies the standard in
ISO 15197:2013, we applied the standards set
by the Clinical Laboratory Improvement Amendments of 1988 (CLIA), which is a stan -dard of quality for the accuracy and reliability of testing equipment. All product values met the
coefficient of variation within 10% of the preci
-sion criteria of CLIA’88 [10].
Accuracy was evaluated according to the accepted standards of the ISO 15197:2013 guideline. Of the six glucometers, only the A, D, and E products met the accuracy acceptance criteria of the ISO 15197:2013 guideline, at
val-ues of 98.0%, 96.0%, and 95.0%, respectively
(Table 2). The Diff & %Bias plot of each glucom -eter is as shown in (Figure 1). Most glucome-ters showed a tendency towards a negative error range compared to the standard, possibly because of measurement deviations among the unique standard measurement equipment used by the manufacturers. In our study, we used Cobas equipment with the hexokinase method for evaluation, but many
manufactur-ers use the YSI 2300 STAT (YSI Life Sciences,
Yellow springs, USA) with the glucose oxidase method as the equipment for the standard measurement. According to Freckmann, MD of the Institut für Diabetes-Technologie Forsch- ungs-und Entwicklungsgesellschaft mbH, Ulm in Germany, there is a difference between these two pieces of equipment that affects the results of glucometer evaluation [11].
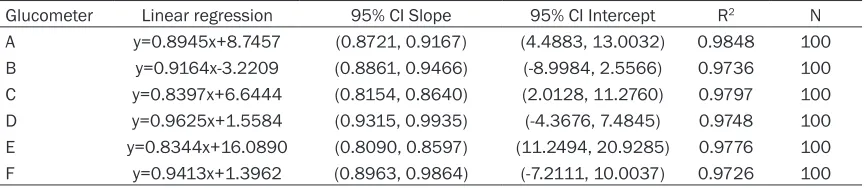
The correlation between the six glucometers and the standard values showed an excellent correlation of more than 0.95 according to lin-ear regression analysis (Table 3).
A consensus error grid analysis was performed on the basis of the measurement results used in the accuracy evaluation (Table 4). Product D showed excellent results, as all measurements
were within the A area and satisfied the permis
-sible standard that more than 99% of the mea -surement values should be in the A or B areas (Figure 2).
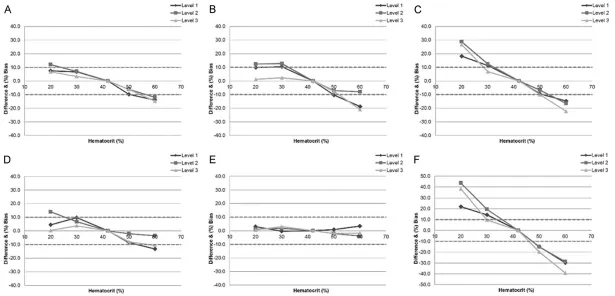
According to the ISO 151597:2013 guideline, the deviation due to hematocrit should be less
than ±0.56 mmol/L (±10 mg/dL) for glucose concentrations less than 5.55 mmol/L (100 mg/dL, and less than ±10% for glucose con -centrations greater than or equal to 5.55
[image:4.612.92.523.83.202.2]-sible range according to hematocrit and glu-cose concentration levels, and the products showed variable deviation ranges depending on the different manufacturers. Manufacturer E had the best function, with a deviation range
of -3.9-3.4%, and manufacturer F was affected
the most by the interference, with a deviation
range of maximum -40-45% (Figure 3).
Discussion
The differences in function between various glucometers from different companies were
clearly defined, and the products did not satis -factorily meet all the performance standards th- at the manufacturers claimed. However, this study was a single institution study, and because of the limitation that the study could not be standardized regarding all conditions for each manufacturer at the time each product
was made, it is difficult to state that they did
not meet the accuracy requirements of ISO 15197:2013. However, these results are valu-able as a reference for the evaluation of the function of glucometers, as blood glucose lev-els for patient checkups are currently
mea-sured using the hexokinase method in most hospitals. Nevertheless, there was a wide gap in function regarding hematocrit and accuracy evaluation (especially hematocrit), which are
not influenced by the standard value.
The glucose levels in the intercellular space between plasma and blood cells are equal, but as one-third of the space in blood cells is taken up by hemoglobin and as hemoglobin uses glu-cose as an energy source, whole blood that includes blood cells has a lower glucose level than plasma. Therefore, as lower hematocrits contain more plasma, the glucose level is per-ceived as higher than actual levels, and higher hematocrits result in glucose levels that are lower than actual levels, as it contains more blood cells. To address this issue, each glucose meter applies a unique algorithm depending on the manufacturer to minimize the effect of hematocrit on the measurements, and most products state that the products guarantee
20-60% or 10-70% of the hematocrit. The
[image:6.612.90.522.135.229.2]importance of the effect of hematocrit on glu-cometers is that their use is not limited to just diabetic patients, as they are also used for neo-Figure 1. Difference and bias (%) plot of glucometers. The relative differences in percentage between an individual result of a glucometer and the corresponding result of the reference method were plotted against the average of the result of the glucometer and the corresponding result of the reference method.
Table 3. Linear regression between glucometers and Cobas 6000
Glucometer Linear regression 95% CI Slope 95% CI Intercept R2 N
[image:6.612.91.524.276.382.2]A y=0.8945x+8.7457 (0.8721, 0.9167) (4.4883, 13.0032) 0.9848 100 B y=0.9164x-3.2209 (0.8861, 0.9466) (-8.9984, 2.5566) 0.9736 100 C y=0.8397x+6.6444 (0.8154, 0.8640) (2.0128, 11.2760) 0.9797 100 D y=0.9625x+1.5584 (0.9315, 0.9935) (-4.3676, 7.4845) 0.9748 100 E y=0.8344x+16.0890 (0.8090, 0.8597) (11.2494, 20.9285) 0.9776 100 F y=0.9413x+1.3962 (0.8963, 0.9864) (-7.2111, 10.0037) 0.9726 100
Table 4. Consensus error grid analysis of glucose levels measured by glucometers against Cobas 6000
Glucometer Consensus Error Grid zone
Zone A Zone B Zone C Zone D Zone E
A 98/100 (98%) 2/100 (2%) 0/100 (0%) 0/100 (0%) 0/100 (0%)
B 95/100 (95%) 5/100 (5%) 0/100 (0%) 0/100 (0%) 0/100 (0%)
C 94/100 (94%) 5/100 (5%) 0/100 (0%) 0/100 (0%) 0/100 (0%)
D 100/100 (100%) 0/100 (0%) 0/100 (0%) 0/100 (0%) 0/100 (0%)
E 95/100 (95%) 5/100 (5%) 0/100 (0%) 0/100 (0%) 0/100 (0%)
Figure 2. Consensus error grid analysis of capillary blood glucose results. Each specimen was measured in dupli-cate by each method. Zone A, clinical accurate (no effect on clinical action); Zone B, clinically acceptable (altered clinical action-little or no effect on clinical outcome); Zone C, altered clinical action-likely to affect clinical outcome; Zone D, altered clinical action having a significant medical risk; and Zone E, altered clinical action having dangerous consequences.
nates with high hematocrits and pregnant women with low hematocrits.
Patients with diabetes often have comorbid conditions such as renal damage and reduced renal function and anemia resulting from differ-ent unexplained pathophysiologies. Moreover, in their study on diabetes patients visiting the Jeonbuk University Hospital, Jin et al. reported that the average hematocrit of 78 patients without peripheral neuropathy was 32.0±4.3, whereas the average hematocrit of 76 patients with peripheral neuropathy was 30.9±3.4 [12]. In addition, a domestic study performed by Kim
et al. on 77 diabetic nephropathy patients with chronic renal disease reported an average hematocrit of 25.2±4.5 [13].
Patients with diabetes have relatively lower hematocrit levels compared to those of healthy individuals, and these patients may either accurately measure their level or obtain a false
positive result that is 45% higher than their
actual blood glucose level depending on the glucose meter product that they use. This dis-crepancy will likely adversely affect glucose level control and prescription of medication by the medical staff.
Of the many physical changes appearing during pregnancy, the plasma volume starts to increase during the 10th week and increases up
to 50% of the levels at the time of fertilization
at around the 34th week. Erythrocytes increase as a result of erythropoiesis, but as the num-bers do not increase relative to the extent of plasma volume expansion, hemoglobin or hematocrit decreases. You et al. performed a cross-sectional study on the biochemical iron
analysis and iron deficiency states of 209
healthy pregnant women without diabetes, heart disease, or renal disease who were receiving prenatal checkups at the Woolsan Community Health Center. The hematocrit dis-tribution was 36.1±2.9 during the early stages of pregnancy, 33.1±2.6 during the middle stag-es, and 34.8±3.5 during the late stagstag-es, with
2% of the pregnant women having a hematocrit
of 25.0-27.5 [14].
Gestational diabetes is diagnosed using a 50 g glucose tolerance test at 24-28 weeks of preg-nancy, and a glucose level exceeding 140 mg/
dL after 1 h is further tested using a 100 g glu -cose tolerance test, in which levels exceeding
180 mg/dL after 1 h, 155 mg/dL after 2 h, and 140 mg/dL after 3 h confirm the diagnosis [15].
Most primary ob-gyn clinics excluding second-ary, tertisecond-ary, and general hospitals use glucom-eters to measure blood glucose levels in preg-nant women as they do not require large biochemical equipment, and the interference effect depending on the hematocrit of the glu-cometers could be a risk factor similar to a misdiagnosis.
Neonates continually receive a steady supply of glucose through the maternal placenta, and very rarely experience transient hypoglycemia due to an intermittent supply of glucose through food after birth. However, persistent or recur-ring hypoglycemia may cause neurological se- quelae; therefore, glucose monitoring is neces-sary. Glucose monitoring should be perfo- rmed within 1-2 h after birth or every time symptoms matching hypoglycemia are obse- rved, and most newborn units use an on-site glucose meter to measure blood glucose lev-els, as it is the fastest method [16, 17]. According to a neonatal hematocrit study per-formed on 41,957 neonates in a U.S. Multih- ospital Health Care System, the change in he-
matocrit from day 1 to 28 after birth was 68%, up to a level of 48% [18]. Because of the inter -ference effect, using glucose meter for moni-toring neonatal blood glucose levels was
con-cluded to pose a significant risk.
Glucometers, which are on-site exam equip-ment, have the advantage of reducing the time needed to make decisions, as they are quick and easy to use, but the results of this study indicate that their function is affected by the actual checkup environment and numerous variation factors.
only products that have been officially con
-firmed regarding accuracy and hematocrit by
undergoing clinical studies are approved and allowed to be sold; moreover, there are also professional clinical testing facilities for glu-cometers. However, in Korea, the regulations for authorizing the sale and approval of glucom-eters are not clearly established, but aware-ness is also low.
The limitations of this study included that we used leftover venous blood sample, whereas most glucometers directly use capillary blood rather than venous blood. Further studies that perform accuracy evaluations using capillary blood and evaluate interference when using capillary hematocrit with recruited subjects are necessary.
More than 80% of the evaluated glucometers did not fulfill the ISO 15197:2013 criteria, and
most were affected by the hematocrit concen-tration. These inaccurate results can increase the risk of uncontrolled blood glucose levels in diabetes patients, who should consider these limiting functions when evaluating their results. As venous blood was used in this study, further
evaluations will be needed to confirm the
results using capillary blood.
Acknowledgements
The authors acknowledge the support provided by the study participants. We would like to thank Editage (www.editage.co.kr) for English language editing.
Disclosure of conflict of interest
None.
Address correspondence to: Kyung-Soo Kim, Department of Family Medicine, Seoul St. Mary’s Hospital, College of Medicine, The Catholic Univer- sity of Korea, 222 Banpo-daero, Seocho-gu, Seoul 06591, Republic of Korea. Tel: 82-2-2258-2895; Fax: 82-2-2258-2907; E-mail: [email protected]
References
[1] International Diabetes Federation. IDF diabe-tes atlas. Brussels, Belgium: International Dia-betes Federation; 2015.
[2] Kim GS and Choi DS. The present state of dia-betes mellitus in Korea. J Korean Med Assoc 2008; 51: 791-798.
[3] American Diabetes Association. Standards of medical care in diabetes--2010. Diabetes Care 2010; 33 Suppl 1: S11-61.
[4] Diabetes Control and Complications Trial Re-search Group, Nathan DM, Genuth S, Lachin J, Cleary P, Crofford O, Davis M, Rand L, Siebert C. The effect of intensive treatment of diabetes on the development and progression of long-term complications in insulin-dependent dia-betes mellitus. N Engl J Med 1993; 329: 977-986.
[5] Intensive blood-glucose control with sulphonyl-ureas or insulin compared with conventional treatment and risk of complications in patients with type 2 diabetes (UKPDS 33). UK Prospec-tive Diabetes Study (UKPDS) Group. Lancet 1998; 352: 837-853.
[6] Virdi NS and Mahoney JJ. Importance of blood glucose meter and carbohydrate estimation accuracy. J Diabetes Sci Technol 2012; 6: 921-926.
[7] International Organization for Standardization. ISO 15197:2013 In vitro diagnostic test sys-tems-Requirements for blood glucose monitor-ing systems for self-testmonitor-ing in managmonitor-ing diabe-tes mellitus. Geneva, Switzerland: International Organization for Standardization; 2013. [8] Ministry of Food and Drug Safety. The medical
device production and export report: ministry of food and drug safety. [cited 2017 Aug 1]. Available from: www.mfds.go.kr.
[9] Clinical and Laboratory Standards Institute. Measurement procedure comparison and bias estimation using patient samples; approved guideline. Wayne, PA: Clinical and Laboratory Standards Institute.
[10] Medicare, Medicaid and CLIA programs; regu -lations implementing the clinical laboratory improvement amendments of 1988--HCFA. Fi-nal rule; correction. Fed Regist 1993; 58: 48323.
[11] Freckmann G, Link M, Schmid C, Pleus S, Baumstark A and Haug C. System accuracy evaluation of different blood glucose monitor-ing systems followmonitor-ing ISO 15197:2013 by us-ing two different comparison methods. Diabe-tes Technol Ther 2015; 17: 635-648.
[12] Jin HY, Jeung SJ, Kim CH, Park JH, Baek HS and Park TS. Erythropoietin levels according to the presence of peripheral neuropathy in diabetic patients with anemia. J Korean Diabetes Assoc 2007; 31: 151-156.
[13] Kim DH, Kim TY, Kim SM, Yoo SJ, Oh DJ and Yu SH. IGF-1 is an independent risk factor for ane-mia in diabetic pre-dialysis patients. Korean J Intern Med 2007; 22: 186-191.
[15] American Diabetes Association. Gestational diabetes mellitus. Diabetes Care 2004; 27 Suppl 1: S88-90.
[16] Harris DL, Battin MR, Weston PJ and Harding JE. Continuous glucose monitoring in newborn babies at risk of hypoglycemia. J Pediatr 2010; 157: 198-202, e191.
[17] Worthen HG, al Ashwal A, Ozand PT, Garawi S, Rahbeeni Z, al Odaib A, Subramanyam SB and Rashed M. Comparative frequency and severi-ty of hypoglycemia in selected organic acide-mias, branched chain amino acidemia, and disorders of fructose metabolism. Brain Dev 1994; 16 Suppl: 81-85.