HPLC METHOD DEVELOPMENT, METHOD DETERMINATION AND
METHOD VALIDATION OF DOSAGE FORM OF EZETIMIBE
N. Suneel Kumar1*, B. Thirupathi Rao2, P. Muralikrishna2 and CH. Narasimha Rao2
1
Dravidian University, Kuppam, Chittoor District, Andhra Pradesh, India.
2
SV University, Tirupathi.
OBJECTIVE
To develop a method determination and method validation of dosage
form of Ezetimibe and stability-indicating liquid chromatographic
analytical method for assay of Ezetimibe and for determination of the
content uniformity of a tablet formulation. Methods: This paper aimed
to develop a simple, sensitive, and rapid chromatographic procedure
for Ezetimibe. The mobile phase of 0.1% ortophosphoric acid and
acetonitrile (50:50) at flow rate of 1 mL/min on reverse phase. The
separation was carried out on a 250-mm × 4.6-mm inside-diameter
reverse-phase column (Zorbax SB-C18, 5 μm), Water: Acetonitrile:
Methanol (40:50:10, v/v) as a diluent. Results:Total analytical run
time for selecting The assays exhibited good linearity (r2 = 0.9999) over the studied range of 2 20 µg/ml to 80 µg/ml. the LOD and LOQ values of the analytical method are 0.1 µg/ml and
0.2 µg/ml respectively which correspond to 0.2% and 0.4% of working concentration Overall
%RSD of replicate sets of method and intermediate precision study is 0.67, the difference
between mean % assay values of method precision and Intermediate precision is 0.4. The
performance of the method was validated according to the present ICH guidelines.
KEYWORDS: Ezetimibe, HPLC, Method validation, stability.
INTRODUCTION
Ezetimibe is a drug that lowers plasma cholesterol levels. It acts by decreasing cholesterol
absorption in the small intestine. It may be used alone (marketed as Zetia or Ezetrol), when
other cholesterol-lowering medications are not tolerated or together with statins
(e.g., ezetimibe/simvastatin, marketed as Vytorin or Inegy) when statins alone do not control
cholesterol.
Volume 7, Issue 3, 570-577. Research Article ISSN 2277– 7105
*Corresponding Author
N. Suneel Kumar
Dravidian University,
Kuppam, Chittoor
District, Andhra
Pradesh, India. Article Received on 06 December 2017,
Revised on 27 Dec. 2017, Accepted on 17 Jan. 2018
DOI: 10.20959/wjpr20183-10632
Ezetimibe is chemically
1-(4-flurophenyl)-3(R)-[3-(4-flourophenyl)-3(S)-hydroxypropyl]-4(S)-(4-hydroxyphenyl)-2-azetidinone. Its molecular formula is C24H21F2NO3 and it has a
molecular weight of 409.43 g mol-1. Ezetimibe is a white crystalline powder that is practically insoluble in water and freely to very soluble in ethanol, methanol, and acetone.
From the literature survey conducted, it was found that there are analytical methods reported
for ezetimibe.[1-8]
MATERIALS AND METHODS
An HPLC system Waters 2695 fitted with a Photodiode Array Detector (PDA) and an
Empower Software was used. The mobile phase of 0.1% ortophosphoric acid and acetonitrile
(50:50) at flow rate of 1 mL/min on reverse phase The separation was carried out on a
250-mm×4.6-mm inside-diameter reverse-phase column (Zorbax SB-C18, 5μm),
Water:Acetonitrile:Methanol (40:50:10, v/v) as a diluents.
Chemicals and reagents
Ezetimibe working standard, Acetonitrile HPLC grade, Water HPLC grade,Orthophosphoric
acid –Merck.
METHODOLOGY
Chromatographic conditions
Mobile phase: - 0.1% Orthophosphoric acid (v/v): Acetonitrile (50:50, v/v)
Column: - Zorbax SB-C18, 250 × 4.6-mm, 5 μm
Flow rate: - 1.0 ml/min
Detection: - 232 nm
Injection volume: - 20 µl
Diluent: - Water: Acetonitrile: Methanol (40:50:10, v/v)
Standard preparation
Stock solution: Weigh accurately about 50 mg Ezetimibe reference standard and transfer into
100 ml volumetric flask. Add 70 ml of diluent to dissolve the substance by sonication for one
minute and then dilute to volume with diluent. The concentration obtained is 500 µg/ml of
Ezetimibe. Pipette out 5 ml of above standard stock solution and transfer into 50 ml
volumetric flask and dilute to volume with diluent. The concentration obtained is 50 µg/ml of
Mobile phase
The mobile phase of 0.1% ortophosphoric acid and acetonitrile (50:50) at flow rate of
1 mL/min on reverse phase.
Test Preparation
Weigh accurately 1 tablet and transfer into 200 ml volumetric flask. Add 140 ml of diluent
into the flask and sonicate of 30 minutes with normal hand-shaking. Cool the flask to room
temperature and dilute to volume with diluent. Filter 10 ml of this solution through 0.45 µm
nylon syringe filter. The concentration obtained is 50 µg/ml of Ezetimibe.
System suitability
% RSD for replicate standard preparation should be less than 2.0 % for analyte peak.
Asymmetry of the analyte peak should be less than 2.0 in standard preparation. Theoretical
plates of the analyte peak should be more than 5000 in standard preparation.
Procedure
Inject the blank preparation and record the chromatogram, Inject five replicate of standard
preparation and check for the system suitability and record the chromatograms, Inject test
preparations in single and record the chromatograms, Calculate the % content uniformity of
the sample and also calculate % RSD for the same.
RESULT AND DISCUSSION
The determination of ezetimibe in pharmaceutical products using RP-HPLC method. Several
trials were done to obtain good separation using different ratios of mobile phase and flow
rates. The mobile phase used was 0.1% Orthophosphoric acid (v/v): Acetonitrile (50:50, v/v)
and the flow rate was found to be 1.0ml/min on Zorbax SB-C18, 250 × 4.6-mm, 5 μm.
Estimation
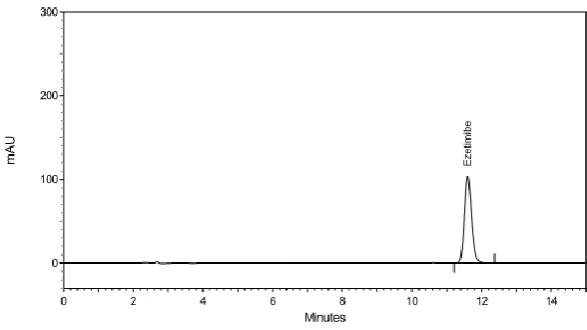
A RP-HPLC method was developed for the estimation of ezetimibe, which can be
conveniently employed for routine quality control in pharmaceutical dosage forms. The
chromatographic conditions were optimized in order to provide a good performance of the
assay. The standard and sample solutions were prepared and chromatograms were recorded.
Fig 1: HPLC Chromatogram for Ezetimibe.
Validation procedure for content uniformity determination of Ezetimibe
Precision study was established by evaluating method precision and intermediate precision
study. Method precision of the analytical method was determined by analyzing test
preparations. Content of all test preparations was determined and mean % content uniformity
value, standard deviation, % relative standard deviation and 95% confidence interval for the
same was calculated.
Intermediate precision of the analytical method was determined by performing method
precision on another day by another analyst using different make of raw materials under same
experimental condition. Content of all test preparations was determined and mean % content
uniformity value, standard deviation, % relative standard deviation and 95% confidence
interval for the same was calculated. Overall content value of method precision and
intermediate precision was compared and % difference and overall % relative standard
deviation was calculated.
System suitability
A system suitability test for the chromatographic system was performed before each
validation parameter. Five replicate injections of standard preparation were injected and
asymmetry, theoretical plate and % RSD of peak area were determined for same as shown in
Table 1: System suitability.
System suitability parameters (In-house limit)
% RSDa
(NMTb 2.0)
Theoretical plates (NLTc 5000)
Asymmetry (NMT 2.0)
Method precision 0.20 15846 1.17
Intermediate precision 0.10 15548 1.12
ª =Relative standard deviation
b
= Not more than
c
= Not less than
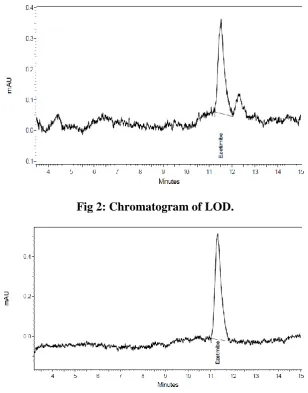
LOD and LOQ
The observation and result obtained for each validation parameter including specificity,
linearity, LOD (Fig 2) and LOQ (Fig 3), precision, accuracy, robustness, solution stability
and system suitability lies well in the acceptance criteria. Since, all the results are
with-in the limit, the developed analytical method is considered as validated and suitable for
intended use.
Fig 2: Chromatogram of LOD.
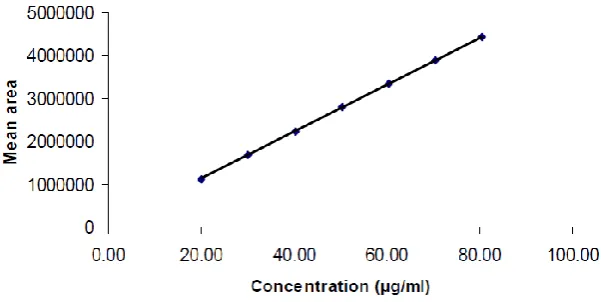
[image:5.595.142.451.347.741.2]Linearity and range study
The linearity plot in Fig 4 was prepared with 7 concentration levels (20, 30, 40, 50, 60, 70,
and 80 μg/ml of Ezetimibe). These concentration levels were respectively corresponding to
40, 60, 80, 100, 120, 140, and 160% of test solution concentration. The correlation coefficient
value should not be less than 0.995 over the working range. The correlation coefficient value
[image:6.595.145.446.218.369.2]of the analytical method is 0.9999 over the working range of 20 μg/ml to 80 μg/ml.
Fig 4: Evaluation of linearity.
Forced Degradation
Stress study was carried out by application of chemical and physical forced degradation. To
perform forced degradation study, the drug content equivalent to 50 mg was employed for
acidic, alkaline and oxidant media and also for thermal and photolytic conditions. After the
degradation treatments were completed, the stress content were allowed to equilibrate to
room temperature and diluted with diluent to attain 50 μg/ml concentrations.
Acidic Condition
Acidic degradation study was performed by refluxing the drug content in 1 N HCl at 80° C
for 1 hour and then the mixture was neutralized.
Alkaline Condition
Alkaline degradation study was performed by keeping the drug content in 0.1 N NaOH at
room temperature for 90 minutes and then the mixture was neutralized.
Oxidative Condition
Oxidative degradation study was performed by refluxing the drug content in 3% v/v H2O2 at
Thermal Condition
Thermal degradation study was performed by keeping the powdered drug content at 70° C for
72 hours.
Photolytic Condition
Photolytic degradation study was performed by exposing the powdered drug content in
sun-light for 72 hour.
There is no any interference of blank peaks, placebo peaks and impurity peaks with the
analyte peak in test preparation and stress test preparations. The peak purity of the analyte
peak in standard preparation, test preparation and stress test preparations is well with-in the
acceptance criteria. All the results are well with-in the acceptance criteria. Hence, the
analytical method is found specific summary as given Table 2.
Table 2: Summary of forced degradation profile in specificity study.
Degradation condition
Peak purity
Total Degradation, %
Major impurity, %
RRT of major impurity
Acidic 1.0000 73.89 36.58 1.6
Alkali 1.0000 23.87 20.74 1.6
Oxidative 1.0000 8.75 2.05 1.6
Thermal 1.0000 0.94 0.32 0.3
Photolytic 1.0000 3.90 2.31 0.3
CONCLUSION
The entire validation activity was performed in accordance with the acceptance criteria and
no deviation was observed. The observation and result obtained for each validation parameter
including specificity, linearity, LOD and LOQ, precision, accuracy, robustness, solution
stability and system suitability lies well with-in the acceptance criteria. Since, all the results
are with-in the limit, the developed analytical method is considered as validated and suitable
for intended use.
ACKNOWLEDGEMENT
We are greatfull to the Dravidian University, Kuppam, Chittoor district, Andhra
REFERENCES
1. J.V.L.N. Seshagiri Rao, et al, Simultaneous Determination of Simvastatin and Ezetimibe
in Tablets by HPLC, E-Journal of Chemistry; 2009; 6(2): 514-544.
2. Mujeeb UR Rahman, Gazala parreb N.K.Nyola Shaharoz Khan, Sushma Teleganokai,
M.Shahar yar and R.K.Khar, Simultaneous estimation of simvastatin and ezetimibe in
Pharmaceutical Tablet Dosage forms by RP – HPLC: A Review International journal of
pharma Research of Development, 2008; 2(9): 56-62.
3. Nilesh Jain, Ruchi Jain, Hemant Swami and Deepak Kumar Jain, RP-HPLC Method for
Simultaneous Estimation of Simvastatin and Ezetimibe in Bulk Drug and its combined
dosage form, Asian Journal of Research Chem July. Sept, 2008; 1(1).
4. Oliveria, Paulo Rento, Barth, Thiago, Simultaneous liquid chromatographic determination
of Ezetimibe and Simvastatin in pharmaceutical products. Journal of AOAC, 2007.
5. Ismail Murat Pal Abiyik, Feyyaz Onur, Ceren Yardimci, Nuram ozaltin, Simultaneous
Spectrophotometric determination of ezetimibe and simvastatin in pharmaceutical
preparations using chemometric techniques, Quimica Nova, 2008; 31(5).
6. Maha Farouk, Omar Abdel – Aziz Reham Nagi, Laila Abdel-Fattah, Validated
Spectrophotometric Methods for determination of some Anti – Hyperlipidemic used
Drugs, Journal of Biomed Sci and Research., 2010; 2(3): 202-211.
7. Metreyi Sharma, Deepak V. Mahaske, M. Mahadi K. SS Kada, SR.Dhameshwar, UV and
three derivative spectrophotometric methods for determination of ezetimibe in tablet
formulation, Indian Journal of pharmaceutical science, 2008; 70: 258-260.
8. Chirag B. Pandya, K. P. Chanwabasavaraj, Shridhara H. S., Simultaneous Estimation of
Rosuvastatin Calcium and Ezetimibe in Bulk and Tablet Dosage From by Simultaneous