SOUND AND VIBRATION
www.elsevier.com/locate/jsvi Journal of Sound and Vibration 267 (2003) 879–892
Passive vibration control of a satellite boom structure by
geometric optimization using genetic algorithm
M. Moshrefi-Torbati*, A.J. Keane, S.J. Elliott, M.J. Brennan, E. Rogers
School of Engineering Sciences (SES), University of Southampton, Southampton SO17 1BJ, UK Institute of Sound and Vibration Research (ISVR), UK
Electronics and Computer Science Department, UK
Received 24 May 2002; accepted 22 October 2002
Abstract
In this paper, the superior mid-frequency vibration isolation of a geometrically optimized lightweight structure is demonstrated. The initial structure under test here was a 4.5 m longsatellite boom consistingof 10 identical bays with equilateral triangular cross-sections. An unusual geometric variant of this, with inherent isolation characteristics, has been designed by the use of genetic algorithm (GA) methods. In order to obtain the best design, the joints in the boom were allowed to move around by 20% of the length of each bay (i.e., 79 cm in all three translational directions). This work is based on results from a Fortran code (which was derived from receptance analysis) that are fully validated against detailed finite element (FE) models of the structure. The experimental forced response of the regular boom structure has been measured and compared with predicted curves. Finally, havingobtained the geometrically optimized boom structure, its experimental response is compared with the theoretical results predicted by the receptance method. It is shown that the average of 30 dB isolation in the vibration energy transfer between the ends of the network of beams, over a 100 Hz bandwidth predicted in the design process, is achieved experimentally in an essentially undamped structure.
r2003 Elsevier Science Ltd. All rights reserved.
1. Introduction
A great number of modern engineering structures are fabricated from beam elements, often arranged in some kind of regular lattice type structure. When these structures are subjected to vibrations, it is useful to be able to prevent vibration energy from travelling along them. Perhaps
*Correspondingauthor. Tel.: +44-23-8059-2350; fax: +44-23-8059-3230.
E-mail addresses: [email protected] (M. Moshrefi-Torbati), [email protected] (A.J. Keane), [email protected]. ac.uk (S.J. Elliott), [email protected] (M.J. Brennan), [email protected] (E. Rogers).
the most challenging vibration control issues arise in space missions that involve satellites with highly sensitive instrumentation packages. To function correctly, these packages must be supported on structures where the vibration levels have been reduced to extremely low levels (micro-vibrations). This need becomes more severe when the instrument concerned forms one of the individual sensors of a multi-sensor interferometric telescope or synthetic aperture radar [1]. In such cases, there is a need to support instruments spaced tens of meters apart usingstructural booms, with the relative motions between their ends beingrestricted to microns over wide ranges of excitation frequency [2]. A number of design approaches have been proposed to try to meet these demandingrequirements but it is still not clear how best to proceed in this field[3]. The most common treatment for such problems is to use anti-vibration mountings or to coat the structural elements with heavy viscoelastic dampingmaterials with consequent weight and cost penalties. Moreover, the effectiveness of such treatments diminishes with the vibration levels, which makes continuously improvingnoise and vibration targets difficult to meet. Clearly, if the vibrational energy could be contained near the points of excitation there would be a reduced need for dampingtreatments and, additionally, they could be concentrated in regions where they were most effective. This is precisely the aim of the vibration isolators used between most pieces of equipment and their supportingstructure. However, such isolators cannot deliver the desired behavior in all situations, particularly for sensitive equipment. The upshot of this problem is the need for some kind of widely applicable, generic structural filter design capability that can be used to build desirable characteristics into a structure, retainingits ability to carry static loads while blocking higher frequency motions. This paper reflects part of a research program currently being undertaken into the development of a medium frequency vibration control approach for such systems.
A great deal of work has been reported in the literature on controlling the low-frequency vibrational response of space truss structures. However, as such problems are brought under control other performance issues become of relevance. The program that this research forms part of is examining the higher frequency behaviour of space structures because the designers and manufacturers collaboratingin the work consider these to be issues that will need tacklingnext. Although the structures considered here are geometrically unusual, they are not considered by the industrial manufacturingteam to be overly difficult or expensive for use in space applications where the potential benefits outweigh any increased construction costs. This is particularly true given modern five-axis numerically controlled machining facilities where it is straightforward to manufacture the range and variety of structural elements involved.
satellite structures, the overall results may be of interest in all fields where reduced vibration transmission is important, such as aircraft and car design.
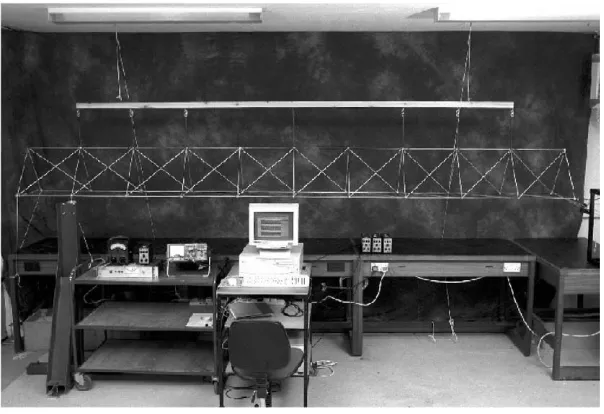
2. The structure
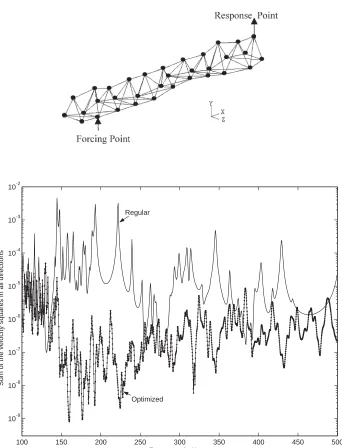
Fig. 1 shows the geometry of the boom structure before optimization. All the 93 Euler– Bernoulli beams in the structure have the same basic properties: all the rods have a flexural rigidityEIof 2.184 MN, a bendingrigidity of 5.503 N m2and mass per unit length of 0.085 kg/m. Based on initial trial experiments, the value of the structural viscous dampingcoefficient has been taken to be 0.005. The beams were all initially either 0.450 or 0.636 m longand they were joined together by 33 aluminium spheres of 25 mm diameter. The beams are produced in practice using a numerically controlled lathe and the spheres usinga five-axis numerically controlled machining centre. The design for connecting the elements of the boom structure is based on the fact that at any stage of the assembly, there is only ever one element that may require exertion of bending force to fit in place. More specifically, each sphere contains six holes that accommodate the six rods coming from various angles. In constructing each bay, the three non-diagonal elements will easily slide into the correspondingholes and another two elements belongingto the following adjacent bay will also fit in with ease. In order to place the sixth (i.e., a diagonal element), a hole is drilled all the way through the sphere. This design proved to be very efficient both in terms of accuracy and practicality. Moreover, it is capable of dealingwith arbitrary geometries without any additional machiningcosts. The model was excited by a point transverse force on the fourth joint (0.45, 0.0, 0.0) m and duringoptimization, the aim was to minimize the vibrational energy level in the right-hand three joints (which in practice might be attached to an instrumentation package) between 150 and 250 Hz.
[image:3.544.122.424.435.642.2]3. Theory
The forced response of the above structure may be readily computed by usingfinite element methods but this is rather cumbersome when the force is broadband and especially when many different configurations need to be considered during optimization. Instead, the well-known characteristics of the Euler–Bernoulli beams together with receptance methods are used. Such methods have been studied for many years and may be set up for solvingdirectly for the energetic quantities of interest[4,7]. Usingthis approach leads to the problem beingdefined in terms of the unknown displacements and forces at the joints. The displacements at the ends of each member meetingat a joint are equated and the joint couplingforces and moments summed to zero. The effects of the external drivingand the joint forces on any beam are specified in terms of the Green functions of the elements in isolation. This approach needs some care to ensure convergence of the Green functions but allows the selection of various models for the elements to be made with great ease. The references show that energy flows calculated in this way agree very well with those based on finite elements. Furthermore, the calculation of a frequency band average is faster than can be achieved by usinga finite element approach with the same level of accuracy.
4. The regular boom experiment
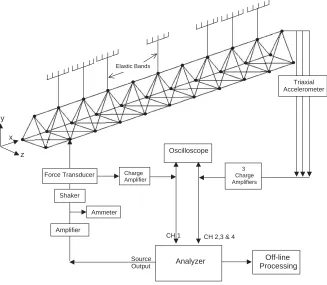
The experimental set-up for the boom structure is shown inFig. 1 and schematically inFig. 2. The structure is connected to a wooden panel via several elastic strings and the wooden panel is subsequently suspended from the ceiling by two equal length strings. Free–free boundary conditions were chosen here as they are simple to achieve in practice. A force transducer (B&K 8200) was used in conjunction with a shaker (LDS V201) that was screwed to the structure. The joint with co-ordinates (0.45, 0.0, 0.0) m was chosen as the input force location. The response was measured at the location of one of the end joints with co-ordinates (4.5, 0.3897, 0.225) m, as shown inFig. 2. A random input force from 1 to 500 Hz, generated by the analyzer was supplied to the shaker via an amplifier (type TPA100-D). An ammeter was then used in series with the amplifier to avoid burningthe shaker’s coil. The force transducer’s output was fed back to the analyzer’s first acquisition channel via a charge amplifier (B&K 2635) whose gain was recorded for later data calibrations. The output of the B&K 4374 miniature accelerometer (attached to a sphere by a small dab of wax) was also fed back to the analyzer’s second acquisition channel via a charge amplifier. In order to monitor the quality of input and output signals, they were both displayed on an oscilloscope before reachingthe analyzer.
5. Results
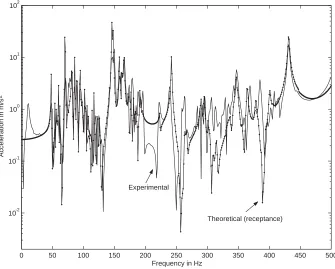
these frequencies. The bigdiscrepancy at very low frequencies is mainly due to the fact that the miniature accelerometer does not start pickingup the structural vibration accurately before around 30 Hz. This problem could be overcome by using a bigger accelerometer to measure very low frequencies. In order to maximize the quality of the data around the peaks and troughs within each frequency band, the number of frequency lines and the input gain were increased, respectively. As can clearly be seen from the results shown in Fig. 3 there is a convincing agreement between the experimental results and the theoretical curve. This agreement implies that the theoretical model is capable of predictingthe vibrational behaviour of the structure. This gives the confidence to go ahead and search for a geometrically optimized structure with reduced vibration transmission levels.
6. Passive optimization
Havingdemonstrated the reliability of the receptance method, the code was then interfaced with an optimization package that has been developed by one of the authors[8]. The aim here was to produce a new boom geometry with an improved frequency response curve. More specifically, the aim was to reduce the frequency-averaged response of the boom in the range 150–250 Hz by
z
CH 1 CH 2,3 & 4
Source Output x
y
Elastic Bands
Force Transducer
Shaker
Ammeter
Amplifier
Charge Amplifier
3 Charge Amplifiers Oscilloscope
Analyzer Off-line
[image:5.544.109.436.95.380.2]Processing Triaxial Accelerometer
the use of optimization, i.e.,
Objective functionðJÞ ¼
Z 250 Hz
150 Hz
X33
j¼31
ffiffiffiffiffiffiffiffiffiffiffiffiffiffiffiffiffiffiffiffiffiffiffiffiffiffiffi v2
xj þv2yjþv2zj q
; j ¼joint:
In practice, such a requirement would reflect known sensitivities of the payload or known excitation frequencies. To meet other design requirements the optimization is constrained to keep the three end beams unchanged in length and position with respect to the fixed points. Further, to meet structural requirements, all of the joints within the structure have been kept within fixed distances from their original positions. This ensures that no beam is too long or too short and also restricts the overall envelope of the structure. The free variables in the problem are thus set as the
x; y and z co-ordinates of the 27 mid-span joints, i.e., 81 variables in all. To achieve the above objectives, a GA optimizer was selected from the optimization package [8] to produce the improved design. For this particular run of the GA, the number of generations was set as 30 and the population size as 300. This means that during the first generation, the optimizer generates 300 random new geometries. In the creation of a new geometry, the co-ordinates of all joints in the structure were varied within 720% maximum deviation from their original positions. After analyzing the frequency response of each of these new boom designs, the GA outputs the design
0 50 100 150 200 250 300 350 400 450 500 10 -2
10 -1 100 101 102
Frequency in Hz
Acceleration in m/s
2
[image:6.544.101.436.95.364.2]Theoretical (receptance) Experimental
Fig. 3. Comparison of the experimental and theoretical responses of the boom structure at joint 32 and in the y
with the best performance and then continues on to the second generation. The designs carried over to the second generation and the creation of subsequent new designs are governed by the specific natural selection algorithm employed by the GA. The geometry producing the best frequency response curve from the 300 random geometries created after the 30th generation is illustrated in Fig. 5a.
As can be seen, the locations of all the ‘interior’ joints have been significantly changed (note that for clarity of the picture, all the diagonal elements are omitted). In order to confirm that the optimizer has indeed produced a geometry with an improved frequency response curve, the response of the new structure may be compared with the original regular boom structure. This is shown in Fig. 5b, where the frequency response of the optimized structure is plotted along with that produced using the regular geometry. From this figure, it is evident that the new design has greatly improved frequency response within the frequency range of 150– 250 Hz. To present a value for the reduction in the vibration transmission, the frequency-averaged performance (the attenuation of the mean of the squares of the velocities) in decibels may be defined by a,
a¼10 log10Jnom
Jopt ;
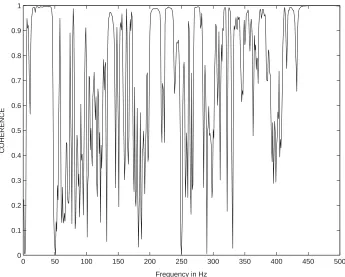
0 50 100 150 200 250 300 350 400 450 500 0
0.1 0.2 0.3 0.4 0.5 0.6 0.7 0.8 0.9 1
Frequency in Hz
[image:7.544.100.445.93.370.2]COHERENCE
Fig. 4. Coherence function for the experimental response of the regular boom structure to joint 32 and in the y
where the numerator and the denominator refer to the objective functions of the regular and optimized structures, respectively. The theoretical attenuation for the above-optimized structure within the frequency range of 150–250 Hz was found to be 30.95 dB. To verify these results, it was decided to manufacture the optimized design and repeat the forced response tests on it. The results are presented in the followingsection.
100 150 200 250 300 350 400 450 500 10 -9
10 -8 10 -7 10 -6 10 -5 10 -4 10 -3 10 -2
Sum of the velocity squares in all directions
Frequency in Hz Regular
Optimized
[image:8.544.102.444.83.531.2]It should be noted that although an optimizer is used here to produce the improved designs, it is not suggested that these are optimal in any sense. In fact, without carrying out an exhaustive search it would not be possible to guarantee such an outcome. Given the number of real valued variables involved and the cost of analysis, this would not be feasible within realistic time scales. Such a situation is quite common in practical engineering design problems and the use of optimization in these circumstances is best termed ‘‘design search’’: the goal is merely to improve the design as much as possible within a given computing budget. A key part of the study presented here is to demonstrate the magnitudes of the improvements that might be expected from this essentially practical standpoint. It is of little practical relevance to know that a further 10 dB of isolation should be achievable accordingto theoretical analysis if only such a design could be found if the computing budget needed to find such a design is wildly unreasonable. Design teams need to know if design modifications will produce worthwhile benefits at affordable cost; happily this turns out to be the case for the designs considered here.
7. The optimizer
Design search optimization of the type posed here is characterized by having many variables with highly non-linear relationships between them and the objective function, which in turn has many peaks and troughs. Since, any one configuration is time consuming to evaluate, they are very difficult to deal with. The search for methods that can cope with such problems has led to the subject of evolutionary computation. Techniques in this area are characterized by a stochastic approach to the search for improved solutions, guided by some kind of evolutionary control strategy. There are three main methods that are currently in use: (1) simulated annealing [9], where the control strategy is based on an understanding of the kinetics of solidifying crystals; (2) genetic algorithm[10], where the methods of Darwinian evolution are applied to the selection of ‘‘fitter’’ design; (3) evolutionary programming [11], which is a more heuristic approach to the problem but which has an increasingnumber of adherents.
One of the authors[4]has applied all of these methods to structural problems and found that, for the current case, the GA work best. The GA used here is fairly typical of those discussed in the well-known book by Goldberg[10]but encompasses a number of new ideas that are particularly suited to engineering design problems [12,13]. Such methods work by maintaininga pool or population of competingdesigns which are combined to find improved solution. In their basic form, each number of the population is presented by a binary stringthat encodes the variables characterizing the design. The search progresses by manipulating the strings in the pool to provide new generations of designs, hopefully with on average better properties than their predecessors. The processes that are used to seek these improved designs are set up to mimic those of natural selection, hence the method’s name.
their size must be chosen, as must a method for dealingwith constraints (usually by application of a penalty function). The algorithm used here works with 12-bit binary encoding. It uses an elitist survival strategy which ensures that the best of each generation always enters the next generation and has optional niche formingto prevent a few moderately successful designs dominatingand so preventingwide rangingsearches. Two penalty functions are available to deal with constraints. The main parameters used to control the method may be summarized as follows:Ngen; the number of
generations allowed (default 10); Npop;the population size or number of trials used per generation
which is therefore inversely related to the number of generations given a fixed number of trials in total (default 250); P[best], the proportion of the population that survive to the next generation (default 0.8);P[cross], the proportion of the survivingpopulation that are allowed to breed (default 0.8);P[invert], the proportion of this population that have their genetic material re-ordered (default 0.5);P[mutation], the proportion of the new generation’s genetic material that is randomly changed (default 0.01); a proportionality flag, which selects whether the new generation is biased in favour of the most successful members of the previous generation or alternatively if allP[best] survivors are propagated equally (default TRUE); the penalty function choice.
When using the GA to explore large design spaces with many variables, it has also been found that the method must be prevented from being dominated by a few moderately good designs which prevent further innovation. A number of methods have been proposed to deal with this problem and the one used here is based on MacQueen’s Adaptive KMEAN algorithm[14]which has recently been applied with some success to multi-peak problems [15]. This algorithm subdivides the population into clusters that have similar properties. The members of each cluster are then penalized accordingto how many members the cluster has and how far it lies from the cluster centre. It also, optionally, restricts the crossover process that forms the heart of the GA, so that large successful clusters mix solely with themselves. This aids convergence of the method, since radical new ideas are prevented from contaminatingsuch sub-pools.
The version of the clustering algorithm used here is controlled by the following;Dmin;minimum
non-dimensional Euclidean distance between cluster centres, with clusters closer than this being collapsed (default 0.1); Dmax; maximum non-dimensional Euclidean radius of a cluster, beyond
which clusters subdivide (default 0.2); Nclust; the initial number of clusters before exclusive
inbreedingwithin the cluster takes place (default 25);Nbreed;the minimum number of members in
a cluster before exclusive in breedingwithin the cluster takes place (default 5) and a is the penalizingindex for cluster members which determines how severely members sharingan over crowded niche will suffer, with small numbers giving greater penalty (default 0.5), i.e., the objective functions of members of a cluster ofmsolutions are scaled by:mminða;1Þ½1 ðE=D
maxÞa þ ðE=DmaxÞa; where E is the Euclidean distance of the member from its cluster centre (which is
always less than Dmax; moreover, when E ¼Dmax no penalty is applied). In addition, the
implementation of the GA used here allows the solution of individual members of the population to be run in parallel if a multiple processor computer is available.
8. The optimized boom experiment
Fig. 6. The optimized boom structure.
100 150 200 250 300 350 400 450 500 10 -7
10 -6 10-5 10-4 10 -3 10-2
Sum of the velocity squares
Frequency in Hz
Experimental
[image:11.544.103.441.399.665.2]Theoretical
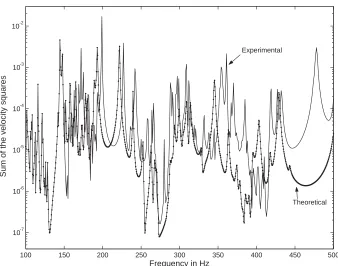
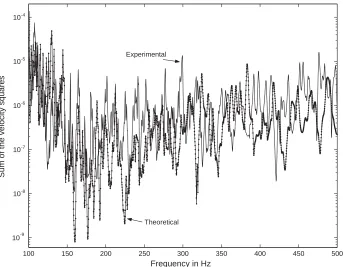
excited by a unit random input force from 1 to 500 Hz, generated by the analyzer and supplied to the shaker via the amplifier. For the purpose of comparingthe objective functions for both boom structures as the criteria for design improvement, the velocities at the three end joints with co-ordinates (4.5, 0.0, 0.0), (4.5, 0.3897,0.225) and (4.5, 0.0, 0.45) were measured. This experiment was also repeated for the regular boom structure. For this test, the translational response of the structure in the x; y and z directions at these joints were measured with a Bruel & Kjaer triaxial accelerometer (type 4326 A). As this accelerometer weighs around 13 g, at any joint measurement, the other two end joints had masses of equal weights attached to them. The squares of all these velocities were then summed and the results compared with their equivalent theoretical curves (Figs. 7 and 8). Despite the fact that all the quantities are squared and added for nine different measurements, the differences between the curves are acceptable, particularly for the frequency range of 150–250 Hz that is of interest here. A point worth notingis that after the final optimized design was submitted to the workshop, it was realized that two of the rods on the 7th bay intersected each other and therefore the structure could not be assembled. To overcome this problem, the optimization run was repeated but this time startingfrom the optimized design and with the positions of all the joints kept fixed except the single joint that affected the position of both the problematic rods (i.e., only three optimization variables). After each generation, the position of the rods were monitored until there was sufficient gap between them and the boom in the above figure is the resulting design. This process had only minor impact on the predicted noise isolation.
Note also that the unusual irregular geometry of the optimized structure implies that at some joints, where the ends of six rods meet, the rods may partially block each other’s path to the joint. To overcome
100 150 200 250 300 350 400 450 500 10 -9
10 -8
10 -7
10 -6 10 -5 10 -4
Sum of the velocity squares
Frequency in Hz Experimental
[image:12.544.102.445.91.358.2]Theoretical
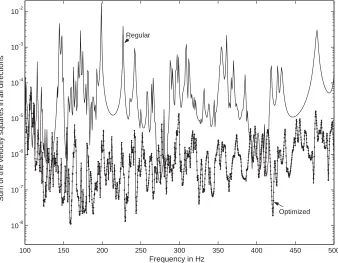
this problem, it was decided to shave off the overlappingparts of the rods involved. This will have slightly changed the material properties of the elements involved and these are not accounted for in the theoretical model. The match between the results in Fig. 8is very satisfactory, despite the inevitable errors arisingfrom manufacturingand modellinginaccuracies. To demonstrate the improvement achieved in practice by the design, the experimental objective functions for the regular and optimized structures are shown inFig. 9. It can clearly be seen that the optimized design displays much improved vibration characteristics at most frequencies and in particular within the band of interest.
9. Conclusions
This paper illustrates that significant improvements in noise isolation performance can be achieved in practice by modifyinga regular structure in a controlled manner. The results of the experiments on a 4.5 m boom structure show that it is possible to build lightweight, lightly damped aluminium truss structures that have up to three decades, or 30 dB of energy transmission isolation between their ends without usingadditional dampingmaterials or active control methods. Moreover, the structure produced is not unworkable and does not suffer from degraded performance at frequencies away from the band that has been the subject of optimization. It should be noted that the improved vibration isolation characteristics gained arise from the constructive reflections of travellingwaves caused by the geometrical discontinuities introduced. It
100 150 200 250 300 350 400 450 500 10 -8
10 -7 10 -6 10 -5 10 -4 10 -3 10 -2
Frequency in Hz
Sum of the velocity squares in all directions
[image:13.544.104.442.109.372.2]Optimized Regular
should also be noted that, even using10 dual-processor workstations, the above optimization run took more than 10 days of computer time to carry out. Clearly, larger structures would be even more expensive to deal with. However, when consideringthe cost of satellite or aircraft design and the penalties associated with redundant weight, such calculations should be well worthwhile. Finally, it is worth mentioningthat the optimized boom structure possesses less resistance to torsion and thus twists (and buckles) slightly more readily than its regular version.
Acknowledgements
This work was supported by the EPSRC under grant reference GR/M33624 and by Astrium Space.
References
[1] J.W. Melody, H.C. Briggs, Analysis of structural and optical interactions of the precision optical interferometer, Proceedings of the SPIE 1947 (1993) 44–57.
[2] S.W. Sirlin, R.A. Laskin, Sizingof active piezoelectric struts for vibration suppression on a space-based interferometer, Proceedings of the 1st US/Japan Conference on Adaptive Structures, 1990, pp. 47–63.
[3] J.W. Melody et al., Integrated modeling methodology validation using the micro-precision interferometer testbed, Proceedings of the IEEE CDC Conference, Kobe, 1996.
[4] A.J. Keane, Passive vibration control via unusual geometries: the application of genetic algorithm optimisation to structural design, Journal of Sound and Vibration 185 (3) (1995) 441–453.
[5] A.J. Keane, A.P. Bright, Passive vibration control via unusual geometries: experiments on model aerospace structures, Journal of Sound and Vibration 190 (4) (1996) 713–719.
[6] A.J. Keane, S.M. Brown, The design of a satellite boom with enhanced vibration performance using genetic algorithm techniques, in: I.C. Parmee (Ed.), Proceedings of the Conference on Adaptive Computing in Engineering Design and Control 96, PEDC, Plymouth, 1996, pp. 107–113, ISBN 0 905227 61 1.
[7] K. Shankar, A.J. Keane, Energy flow predictions in a structure of rigidly joined beams using receptance theory, Journal of Sound and Vibration 185 (1995) 867–890.
[8] A.J. Keane, 1994, The OPTIONS Design Exploration System User Guide and Reference Manual, http:// www.eng.ox.ac.uk/people/Andy.Keane/options.ps.
[9] S. Kipkpatrick, C.D. Gelatt, M.P. Vecchi, Optimization by simulated annealing, Science 220 (4598) (1983) 671–680.
[10] D.E. Goldberg, Genetic Algorithm in Search Optimization and Machine Learning, Addison-Wesley, Cambridge, MA, 1989.
[11] D.B. Fogel, Applying evolutionary programming to selected travelling salesman problems, Cybernetics and systems 24 (1) (1993) 27–36.
[12] A.J. Keane, Structural design for enhanced noise performance using Genetic Algorithm and other optimisation techniques, in: R.F. Albrecht, C.R. Reeves, N.C. Steele (Eds.), Proceedings of the International Conference on Artificial Neural Nets and Genetic Algorithms, Springer, Innsbruck, 1993, pp. 536–543.
[13] A.J. Keane, Genetic algorithm optimisation of multi-peak problems: studies in convergence and robustness, Artificial Intelligence in Engineering 9 (2) (1995) 75–83.
[14] M.R. Anderberg, Cluser Analysis for Applications, Academic Press, New York, 1975.