APPLICATION OF THE FULLPROF PROGRAM TO THE STRUCTURAL CHARACTERISTICS OF
β
Physics Department, Faculty of
ARTICLE INFO ABSTRACT
The slow evaporation technique of an aqueous solution was used to grow single crystal of β Then, the FullProf
(phase II) by two methods (Le Bail and Rietveld). The structural parameters of β obtained by the two methods were compared with each oth
the agreements and differences were discussed. The crystal structure of β
FullProf program in accordance with atomic positions, and it was compared with that drew previously by other programs. The average crystallite size of β
equations (Debye
Copyright © A. M.Abdulwahab. This is an open access article distributed under the Creative Commons Attribution License, which permits unrestricted use, distribution, and reproduction in any medium, provided the original work is properly cited.
INTRODUCTION
Lithium ammonium sulfate (LiNH4SO4), which known as LAS, is a
member in the family of ionic crystals. This family has the general formula MIMIIBX4, where MI represents the Li atom, M
Na, K, Rb, Cs atoms, or NH4, N2H5 molecules, and BX
SO4, SeO4, BF4 molecules. This family has attracted great interest and
an increasing number of studies have reported on its ph properties. Each member of this family exhibits its own sequences of structural phase transitions. In the literature, the observed difference between the physical properties of members of the M structure is always attributed to the position and character of detected phase transitions and to the symmetry of some phases. The origin of these differences may be related to the dynamics and orientation of the sulfate tetrahedral group in the structure of the compound [6, 41]. Single crystals of LiNH4SO4 (LAS) have two possible α
forms. Both modifications are grown from aqueous solutions of
LiNH4SO4 by slow evaporation of water at the following
temperatures: α-LiNH4SO4 at Tgr. = 283 K and β
305 K [35]. α- and β- modifications have different crystal structures. α-LiNH4SO4 crystal has space group Pca21 with
parameters a = 10.196 Å, b = 4.991 Å and c = 17.100 Å [20, 26]. LiNH4SO4 crystal has two structural phase transitions at about 459 K
and 283 K respectively. Therefore, three phases can be distinguished; phase I for T > 459 K; phase II for 283 < T < 459 K; and phase III for T <283 K. The crystal structure at 459 K transforms from an orthorhombic high temperature phase (phase I) to another orthorhombic phase (phase II) or (room temperature phase). Phase I
has a space group 16
2h
D -Pmcn, lattice parameters a
Å, c = 8.74 Å and Z = 4.
*Corresponding author: A.M. Abdulwahab,
Physics Department, Faculty of Applied Science, Thamar University, Thamar 87246, Yemen
ISSN: 0975-833X
Article History: Received 05thJuly, 2013
Received in revised form 28th August, 2013
Accepted 24th August, 2013
Published online 14th September, 2013
Key words: β-LAS, Crystal structure, FullProf program, Crystallite size.
RESEARCH ARTICLE
APPLICATION OF THE FULLPROF PROGRAM TO THE STRUCTURAL CHARACTERISTICS OF
β-LiNH
4SO
4CRYSTAL (PHASE II)
* A. M. Abdulwahab
Physics Department, Faculty of Applied Science, Thamar University, Thamar 87246, Yemen
ABSTRACT
The slow evaporation technique of an aqueous solution was used to grow single crystal of β
Then, the FullProf program was used to evaluate the structural parameters for this crystal at room temperature (phase II) by two methods (Le Bail and Rietveld). The structural parameters of β
obtained by the two methods were compared with each other and with those obtained in some earlier studies, then the agreements and differences were discussed. The crystal structure of β
FullProf program in accordance with atomic positions, and it was compared with that drew previously by other programs. The average crystallite size of β-LiNH4SO
equations (Debye–Scherrer and Williamson–Hall), and by using the two methods (Le Bail and Rietveld).
This is an open access article distributed under the Creative Commons Attribution License, which permits unrestricted use, distribution, and reproduction in any medium, provided the original work is properly cited.
), which known as LAS, is a member in the family of ionic crystals. This family has the general represents the Li atom, MII represents molecules, and BX4 represents
molecules. This family has attracted great interest and an increasing number of studies have reported on its physical properties. Each member of this family exhibits its own sequences of structural phase transitions. In the literature, the observed difference between the physical properties of members of the MIMIIBX4
nd character of detected phase transitions and to the symmetry of some phases. The origin of these differences may be related to the dynamics and orientation of the sulfate tetrahedral group in the structure of the compound [6, 41]. (LAS) have two possible α- and β- forms. Both modifications are grown from aqueous solutions of by slow evaporation of water at the following = 283 K and β-LiNH4SO4 at Tgr. =
ns have different crystal structures. with Z = 8 and lattice = 17.100 Å [20, 26]. β-crystal has two structural phase transitions at about 459 K K respectively. Therefore, three phases can be distinguished; 459 K; and phase III 283 K. The crystal structure at 459 K transforms from an orthorhombic high temperature phase (phase I) to another hombic phase (phase II) or (room temperature phase). Phase I
a = 5.13 Å, b = 5.16
Science, Thamar University, Thamar
Phase II has a space group 9
2v
C -P2
b = 9.14 Å, c = 8.786 Å and Z = 4. At 283 K, the structure transforms
to a monoclinic phase (phase III) of space group P2 parameters a = 5.283 Å, b = 9.121 Å,
16, 23]. In β-LiNH4SO4 (β-LAS) single crystals, the phase transition
from phase II to phase III is of the first order, while the phase transition from phase I to phase II is of the second order [2]. The high-temperature phase transition is ferroelectric or ferroelectric paraelectric [4, 28, 40]. The phase transition at 283 K is antiferroelectric–ferroelectric or ferroelastic
and 36]. Phase III is ferroelastic, and LAS is the first example of a new family of a ferroelastic crystal that is not simultaneously ferroelectric [8].
Many investigations have been pe
dielectric [43], optical [1, 2], thermal [33, 38, 39], NMR [1, 2, 32], elastic constants [3], Brillouin scattering [9], and pressure studies [4, 24]. Recently, many studies on LAS crystal had been performed in terms of various properties and applications. As examples for these studies, there are the nuclear magnetic resonance (NMR) study [19], study the effects of doped cesium (
transition of LAS system [7], Raman spectra [27], thermo study [21], mechanical and dielectric study [14], EPR study [13], and thermodynamic study [31]. The studies on LAS, as my knowledge, are little in terms of crystal structure. For example, Mashiyama and Kasano [22] is study in which one can see the crystal structure refinement of LAS (phases II and III) by using single crystal X diffraction with including hydrogen atoms. Smirnov et al. [34] is another study in which one can find the values of atomic positions, thermal parameters, and bond lengths of LAS crystal cal
using single crystal neutron diffraction. The FullProf program, which is modern program and can give important information, more accuracy, and more details about the structure, is not used in these studies. In addition, the crystallite size of L
International Journal of Current Research Vol. 5, Issue, 09, pp.2547-2553, September,2013
INTERNATIONAL
APPLICATION OF THE FULLPROF PROGRAM TO THE STRUCTURAL CHARACTERISTICS OF
Applied Science, Thamar University, Thamar 87246, Yemen
The slow evaporation technique of an aqueous solution was used to grow single crystal of β-LiNH4SO4 at 309 K.
program was used to evaluate the structural parameters for this crystal at room temperature (phase II) by two methods (Le Bail and Rietveld). The structural parameters of β-LiNH4SO4 crystal (phase II)
er and with those obtained in some earlier studies, then the agreements and differences were discussed. The crystal structure of β-LiNH4SO4 (phase II) was drew by the
FullProf program in accordance with atomic positions, and it was compared with that drew and described SO4 crystal was calculated by using two
Hall), and by using the two methods (Le Bail and Rietveld).
This is an open access article distributed under the Creative Commons Attribution License, which permits unrestricted use,
P21cn, lattice parameters a = 5.28 Å,
= 4. At 283 K, the structure transforms to a monoclinic phase (phase III) of space group P21/a with lattice
= 9.121 Å, c = 17.444 Å and Z = 8 [10, 15, LAS) single crystals, the phase transition e II to phase III is of the first order, while the phase transition from phase I to phase II is of the second order [2]. The temperature phase transition is ferroelectric or ferroelectric– paraelectric [4, 28, 40]. The phase transition at 283 K is
c or ferroelastic–ferroelectric [3, 11, 25 and 36]. Phase III is ferroelastic, and LAS is the first example of a new family of a ferroelastic crystal that is not simultaneously
Many investigations have been performed on LAS including dielectric [43], optical [1, 2], thermal [33, 38, 39], NMR [1, 2, 32], elastic constants [3], Brillouin scattering [9], and pressure studies [4, 24]. Recently, many studies on LAS crystal had been performed in erties and applications. As examples for these studies, there are the nuclear magnetic resonance (NMR) study [19], study the effects of doped cesium (Cs+) metal ions on the phase transition of LAS system [7], Raman spectra [27], thermo-electric mechanical and dielectric study [14], EPR study [13], and The studies on LAS, as my knowledge, are little in terms of crystal structure. For example, Mashiyama and Kasano [22] is study in which one can see the crystal structure efinement of LAS (phases II and III) by using single crystal X-ray diffraction with including hydrogen atoms. Smirnov et al. [34] is another study in which one can find the values of atomic positions, thermal parameters, and bond lengths of LAS crystal calculated by using single crystal neutron diffraction. The FullProf program, which is modern program and can give important information, more accuracy, and more details about the structure, is not used in these studies. In addition, the crystallite size of LAS crystal is not
calculated in these studies. Therefore, the first aim of the present work is to study the structure of β-LiNH4SO4 (β-LAS) single crystal
at room temperature (phase II) by two methods (Le Bail and Rietveld) using the FullProf program. The second aim is to evaluate the average crystallite size of this crystal from the peaks data of the two methods by using two equations (Debye–Scherrer and Williamson–Hall).
EXPERIMENTAL DETAILS
Synthesis and crystal growth
A solution of lithium ammonium sulfate LiNH4SO4 (LAS) compound
was synthesized by dissolving Li2SO4.H2O and (NH4)2SO4 in the
stoichiometric ratio in double distilled water according to the equation:
Li2SO4.H2O + (NH4)2SO4 → 2LiNH4SO4 + H2O (1)
The solution was left for evaporation to seeding at room temperature (298 K). A good seed was chosen, and then it was employed for the growth of single crystal. Single crystal of LAS was grown by the slow evaporation technique of an aqueous solution at constant temperature (309 K) by using an indigenous crystal growth apparatus
fabricated in the laboratory. The apparatus, as shown
photographically in Fig.1, consists of a glass box 40 cm length, 40 cm width and 20 cm height. Its cover has 4 identical holes in each there fitted inside a Pyrex glass jar. All jars having the same diameter (6 cm) and same height (15 cm). The stirrations of the solutions as well as the water bath are achieved through 5 stirrers; each one directly connected to a 6 V dc motor. The dc motors are non-synchronized having a variable speed, up to 20 r p m, which can be adjusted through the given potential. Each motor is mounted on four brass rods, which are fixed on the Perspex cover of the glass box. Two coil heater each of 1000 watts are connected to a direct reading contact thermometer via an electric circuit. The high thermal capacity of the water bath and the homogenous distribution of the stirrers as well as the heaters enable good thermal stability in the growth jars. The solution was saturated at the growth temperature (309 K) by slow evaporation. Small seed (~5 mm) was suspended in the saturated solution using a nylon thread from a stirrer, which was rotated with speed of 20 r p m. As shown in the photograph in Fig.2, the grown single crystal after about 25 days was colorless and optically transparent with dimensions up to 1.2 × 1.0 × 0.8 cm3. The grown
single crystal was β-LiNH4SO4 (β-LAS) because the growth
temperature (309 K) is high and leads to growth of β-modification of LiNH4SO4 as in literature [35], and because the structure of the
[image:2.595.314.554.52.249.2]obtained crystal relates to phase II (room temperature phase) for β-modification of LiNH4SO4 as it will be come later.
[image:2.595.43.285.557.753.2]Fig. 1. Photograph of the crystal growth apparatus
Fig. 2. Photograph of LAS crystal
Powder X-ray diffraction measurements
For powder X-ray diffraction measurements, a sample was taken from the crystal and it was grated very well until it became soft powder. Then, small amount from this powder was taken to use in these measurements. The measurements were performed at room temperature using a Philips (PW1710) diffractometer, which is equipped with a curved graphite crystal monochromator, an automatic divergence slit, a vertical goniometer (PW1050) with automatic sample changer and Xenon proportional detector. The measurements were swapped from 2=4˚ to 2=80˚ with step of 0.04˚, copper target with nickel filter at 40 kV, 30 mA, a scanning speed of 0.06˚/min and incident wavelength was 1.541838 Å.
Treatment of powder X-ray diffraction data
application of powder pattern profile refinement. However the constraints applied to the refinement are far less severe than for Rietveld refinement and profile matching is thereby more prone to instabilities if profile shape parameters or microstructural parameters are refined. In some cases, in particular when the structural model is very crude, it is advisable to analyze first the pattern with the Le Bail method in order to determine accurately the profile shape function, background and cell parameters before running the Rietveld method. The obtained data from powder X-ray diffraction measurements for β-LAS crystal were treated using the two methods (Le Bail and Rietveld). Le Bail and Rietveld refinements were performed using the same refinement program, FullProf [30]. The experimental profiles in the two methods were fitted by modified Thompson-Cox-Hastings pseudo-Voigt functions [37]:
2 / 1 2 2
)
cos
/
tan
tan
(
U
V
W
Z
H
G
(2)And
/
cos
tan
Y
X
H
L
(3)where HG is the Gaussian component of the peak width, HL is the
Lorentzian component of the peak width, U is the Gussian isotropic microstrain parameter, Z is the Gussian isotropic crystallite size parameter, X is the Lorentzian isotropic microstrain parameter, and Y is the Lorentzian isotropic crystallite size parameter. Le Bail fitting was initially performed because of the capability of the method for the fast observation of lattice dynamics. Subsequently, Rietveld fitting was performed. The instrument zero, the lattice parameters, asymmetry parameters and the peak shape parameters were refined in the first by Le Bail method. Then, the same parameters were refined again by Rietveld method beside other parameters like atomic coordination, temperature factors, occupation, multiplicity, bond lengths, and angles. In Le Bail method, the global parameters (profile asymmetry, background, and specimen displacement) were refined in the first step. Lattice parameters, preferred orientation, asymmetry parameters, and the peak shape parameters were refined in the second step. In the last cycle, when the discrepancy factor Rwp reached a
minimum value, all the parameters were refined simultaneously
looking for a minimum goodness of fit index χ2. In Rietveld method,
the global parameters (profile asymmetry, background, and specimen displacement) were refined in the first step of the refinement. In the next step, the structural parameters (atomic coordination, parameters of specimen profile breadth, lattice parameters, temperature factors, preferred orientation, site occupancy factors, bond lengths, and angles) were refined in sequence modes. In the last cycle, when the discrepancy factor Rwp reached a minimum value, all the parameters
(global and structural) were refined simultaneously looking for a minimum goodness of fit index χ2.
RESULTS AND DISCUSSION
The parameters calculated by the two methods (Le Bail and Rietveld)
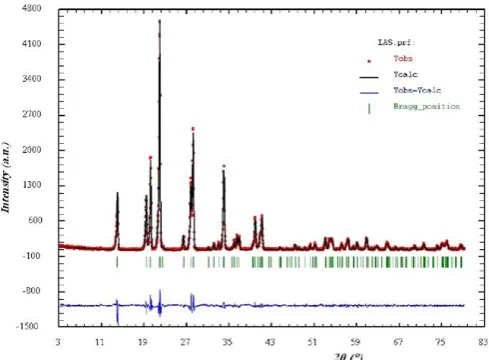
The outcomes of refinements by Le Bail and Rietveld methods were plotted in Fig. 3 and Fig. 4. The observed peaks, the calculated ones, and their difference in profiles of β-LAS sample are presented in the two Figures. Crystal data and data collection parameters calculated by the two methods were tabulated in Table 1. The crystal data and data collection parameters given in a file of the International Center for Diffraction Data (ICDD) [PDF No. 82-0020] were listed in the same table for the comparison. In addition, the discrepancy factors Rp,
Rwp and Rexp and the goodness of fit index χ 2
obtained from the two methods (Le Bail and Rietveld) were listed in the same Table. Comparing the values of crystal data and data collection parameters calculated by the two methods with the literature [10, 15, 16, 23] and with the ICDD file (PDF No. 82-0020) confirmed that the structure of
the grown crystal relates to phase II (room temperature phase) for β-LiNH4SO4 (β-LAS) crystal. This result is very sensible for two
reasons. The first reason is the growth temperature of this crystal (309
K) which leads to growth of β-modification of LiNH4SO4 (β-LAS) as
in the literature [35]. The second reason is the X-ray diffraction measurements of this crystal that was performed at room temperature (298 K), and the phase II (room temperature phase) lies in the range 283 K < T < 459 K as in the literature [10, 15, 16, 23]. It is clear from Fig. 3, Fig. 4 and table 1 that there are very good agreements between the model and the data for all data set calculated by the two methods. Although the goodness of fit index (χ2) was the same in the two methods, the discrepancy factors (Rp, Rwp and Rexp) were in Le Bail
[image:3.595.309.554.335.515.2]method less than those in Rietveld method. This means that the refinement by Le Bail method was more accuracy than that by Rietveld method. This is reasonable result because Rietveld method refines parameters more than Le Bail method does, and the existence of errors has probability in Rietveld method larger than that in Le Bail method. The percentages of the errors in the unit cell parameters calculated by the two methods (Le Bail and Rietveld) were listed in Table 2. These errors equal to the differences between the values in the PDF No. 82-0020 and those calculated in this work. Table 2 showed that the values of unit cell parameters calculated by the two methods are very close to those in the PDF No. 82-0020. Table 2 showed, also, that the difference in the parameter a between the PDF file and Le Bail method was greater than the same difference between the PDF file and Rietveld method.
[image:3.595.310.556.556.740.2]Fig. 3. The FullProf refined pattern of β-LAS single crystal (phase II) by using Le Bail method.
Table 2. The percentages for differences between the unit cell parameters in the PDF No. 82-0020 and those calculated by the FullProf program (Le
Bail and Rietveld methods) for β-LAS single crystal (phase II).
(∆a/a), % (∆b/b), % (∆c/c), % Le Bail method 0.079 0.059 0.089 Rietveld method 0.072 0.089 0.099
Nevertheless, for the parameters b and c, the differences between the PDF file and Le Bail method were smaller than the same differences between the PDF file and Rietveld method. This means that the values of unit cell parameters calculated by Le Bail method were more accuracy than that calculated by Rietveld method as it was mentioned at once. However, all differences were very small (less than 0.01%) and therefore the refinements by the two methods were, in general, very accurate.
The parameters calculated by Rietveld method only
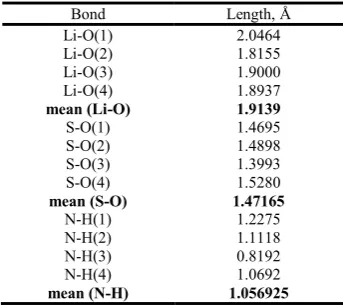
[image:4.595.105.489.82.302.2]The Rietveld method was used to calculate other parameters that cannot be calculated by Le Bail method like atomic coordinates, isotropic temperature factors, occupation, multiplicity, bond lengths, and angles. The refined values of atomic coordinates, isotropic temperature factors, occupation, and multiplicity were presented in Table 3. By comparing the values in table 3 with literature [22, 34], one can find that, in general, all values in the present work were very close to that in the two references. This except the atomic coordinate (x) for the atom O3 which is different in the two references (-0.0096 in [22] and -0.082 in [34]) and it was (-0.0116) in the present work. This last value was closer to that in [22]. This difference may be explained by type of the diffraction, which was X-ray diffraction in the present work and in [22], while it was neutron diffraction in [34]). Another explanation may give the reason for this difference. It is the accuracy in the refinements, which may differs from a work to another. Also, it can be found from table 3 that the atoms positions were reasonable for this structure and gave the possibility to determine bond lengths for Li-Oi, S-Oi and N-Hi where i = 1, 2, 3, 4. These calculated bond lengths were presented in Table 4. One can see that the obtained mean bond lengths for Li-O and S-O in the present work (Table 4) were, approximately, similar to that in the references [22, 34]. Nevertheless, the obtained mean bond length for N-H has different values in the two references (0.93 in [22] and 0.99 in [34]) while in the present work, it was (1.056925). This difference was explained in [34] by the type of diffraction which was X-ray diffraction in [22] and neutron diffraction in [34].
Table 3. Atomic parameters (atomic coordinates, isotropic temperature factors, occupation, and multiplicity) calculated by the FullProf program
(Rietveld method) for β-LAS single crystal (phase II)
Atom
Atomic coordinates Isotropic temperature
factors
Occupation Multiplicity
x y z
[image:4.595.306.561.360.494.2]Li 0.2492 0.0892 0.3073 0.0231 1.0000 4 S 0.2323 0.4162 0.2052 0.0151 1.0000 4 O(1) 0.2617 0.3956 0.0399 0.0423 1.0000 4 O(2) 0.3374 0.2783 0.2708 0.0309 1.0000 4 O(3) -0.0116 0.4471 0.2587 0.0185 1.0000 4 O(4) 0.4148 0.5385 0.2507 0.0321 1.0000 4 N 0.7681 0.2858 0.4984 0.0291 1.0000 4 H(1) 0.7054 0.1619 0.5377 0.1680 1.0000 4 H(2) 0.5766 0.3105 0.4522 0.0510 1.0000 4 H(3) 0.8291 0.3303 0.4260 0.9560 1.0000 4 H(4) 0.8526 0.3386 0.5947 0.0840 1.0000 4
Table 4. Bond lengths calculated by the FullProf program (Rietveld method) for β-LAS single crystal (phase II)
Bond Length, Å
Li-O(1) 2.0464
Li-O(2) 1.8155
Li-O(3) 1.9000
Li-O(4) 1.8937
mean (Li-O) 1.9139
S-O(1) 1.4695
S-O(2) 1.4898
S-O(3) 1.3993
S-O(4) 1.5280
mean (S-O) 1.47165
N-H(1) 1.2275
N-H(2) 1.1118
N-H(3) 0.8192
N-H(4) 1.0692
mean (N-H) 1.056925
But, in the present work, the value of this bond length was closer to the value in [34] in spite of the diffraction in [34] was neutron diffraction while in the present work it is X-ray diffraction as it was in [22]. This inconsistence may be explained with two reasons; the first is the instrument type, which was single X-ray diffractometer in [22], while it is powder X-ray diffractometer in the present work. The second reason is the accuracy in the refinements, which may differs from a work to another. The calculated bond angles for Oi-Li-Oi,
Table 1. Comparison between crystal data and data collection parameters calculated in the present work and those given in the ICDD file (PDF No. 82-0020) beside the discrepancy factors and the goodness of fit index in the two methods for β-LAS single crystal (phase II).
PDF No. 82-0020 Calculated by FullProf program (Le Bail method)
Calculated by FullProf program (Rietveld method)
Chemical formula LiNH4SO4 LiNH4SO4 LiNH4SO4
Color - Colorless Colorless
Mr, g mol-1 121.04 121.04 121.04
2 range, ˚ - 4-80 4-80
2 step, ˚ - 0.04 0.04
Scanning speed, ˚/min - 0.06 0.06
Range of d(hkl), Å - 22.1-1.2 22.1-1.2
, Å 1.54060 1.541838 1.541838
Measurement temperature, K - 298 298
Crystal system Orthorhombic Orthorhombic Orthorhombic
Space group P21cn P21cn P21cn
a, Å 5.282(2) 5.27779 5.27818
b, Å 9.131(3) 9.12562 9.12291
c, Å 8.78(1) 8.77220 8.77129
V, Å3 423.46 422.497 422.358
Z 4 4 4
No. of reflections - 148 154
Rp - 12.9 15.0
Rwp - 17.1 18.1
Rexp - 10.57 11.19
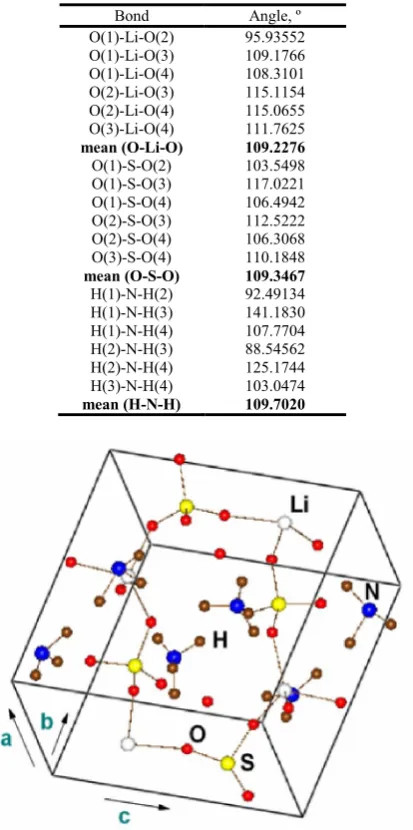
[image:4.595.346.518.529.682.2]Oi-S-Oi and Hi-N-Hi where i = 1, 2, 3, 4 in β-LAS single crystal were presented in table 5. It is clear from the table that, although the range of the bond angles differs from one group to another, all obtained mean bond angles for O-Li-O, O-S-O, and H-N-H were, approximately, the same (~ 109 º). By comparing this value with the references, one can see that the mean bond angles calculated in the present work by using the FullProf program (table 5) were, approximately, similar to that calculated by using other programs in Mashiyama and Kasano [22] and in Smirnov et al. [34]. From the obtained values of unit cells, atomic positions, bond lengths and angles, the FullProf program drew the structure visualization for β-LAS single crystal as it is clear in fig. 5, which displays the crystal structure of β-LAS (phase II) in accordance with atomic positions. Fig. 5 showed that this structure agrees well with that drew and described previously by other programs [18, 19, 34].
Table 5. Bond angles calculated by the FullProf program (Rietveld method) for β-LAS single crystal (phase II)
Bond Angle, º
[image:5.595.309.555.543.730.2]O(1)-Li-O(2) 95.93552 O(1)-Li-O(3) 109.1766 O(1)-Li-O(4) 108.3101 O(2)-Li-O(3) 115.1154 O(2)-Li-O(4) 115.0655 O(3)-Li-O(4) 111.7625 mean (O-Li-O) 109.2276 O(1)-S-O(2) 103.5498 O(1)-S-O(3) 117.0221 O(1)-S-O(4) 106.4942 O(2)-S-O(3) 112.5222 O(2)-S-O(4) 106.3068 O(3)-S-O(4) 110.1848 mean (O-S-O) 109.3467 H(1)-N-H(2) 92.49134 H(1)-N-H(3) 141.1830 H(1)-N-H(4) 107.7704 H(2)-N-H(3) 88.54562 H(2)-N-H(4) 125.1744 H(3)-N-H(4) 103.0474 mean (H-N-H) 109.7020
Fig. 5. The structure of β-LAS single crystal (phase II) in accordance with atomic positions.as it was obtained from the FullProf program (Rietveld
method)
Average crystallite size
The sample produces appreciable diffraction broadening and it is reasonably assumed that this arises from the crystallite size and internal stresses. Diffraction theory predicts that the breadth due to crystallite size varies with angle as secθ and that due to elastic strain
as tanθ [42]. The additional broadening in diffraction peaks beyond the inherent peak widths due to instrumental effects can be used to measure crystallite size as low as 1.0 nm. The average crystallite size (t) of the sample can be calculated from the full width at half maximum (FWHM) of the peaks using the Debye–Scherrer equation [12]:
cos
9
.
0
t
(4)where λ is the X-ray wavelength, δ is the full width at half maximum (FWHM) of the peak (in radians) and θ is the Bragg angle for the corresponding plane. The equation (4) can be rewritten in the form:
cos
1
.
9
.
0
t
(5)In order to use δ and θ of all peaks, δ is plotted on the y-axis against (1/cos θ) on the x-axis. This relation should be a straight line with slope equals to (0.9λ/t) from which the average crystallite size (t) can be calculated. The values of δ and θ extracted from the refinements of X-ray diffraction for β-LAS crystal by the two methods (Le Bail and Rietveld) were used to plot two relations in Fig. 6 by using Debye– Scherrer equation and to calculate the average crystallite size (t) from the slopes of the two relations. It is clear from Fig. 6 that the data were well fitted by straight lines for the two relations according to the Debye–Scherrer equation. The slopes of these two lines obtained from the peaks data of Le Bail and Rietveld methods outputs were (0.00486) and (0.00472) respectively. By using equation (5), the slope = 0.9λ/t. By substituting λ with its value (0.1541838 nm), the average crystallite size (t) was calculated from the two slopes of the two methods. The two obtained values were listed in Table 6. The average crystallite size (t) can be calculated by another equation too. It is the Williamson–Hall equation [5]:
cos
2
sin
t
k
(6)
where k is Scherrer constant, which was taken equal to (0.9) in Debye–Scherrer formula (4), and ε is the lattice strain. Here, (δ cosθ) is plotted on the y-axis against (2sinθ) on the x-axis. This relation will be, also, a straight line. The intercept of this straight line with y-axis gives (kλ/t) from which the average crystallite size (t) can be calculated after putting Scherrer
Fig. 6. The relations between (δ) and (1/cos θ) obtained from the peaks data of Le Bail and Rietveld methods according to the Debye–Scherrer
Fig. 7. The relations between (δ cos θ) and (2sin θ) obtained from the peaks data of Le Bail and Rietveld methods according to the Williamson–
Hall equation for β-LAS single crystal (phase II).
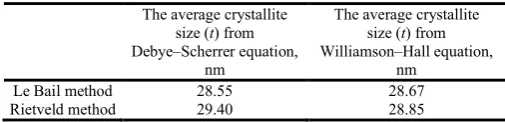
constant (k) equals to (0.9). The slope of the straight line equals to the lattice strain (ε). The values of δ and θ extracted from the refinements of X-ray diffraction for β-LAS crystal by the two methods (Le Bail and Rietveld) were used, also, to plot two relations in Fig. 7 by using Williamson–Hall equation and to calculate the average crystallite size (t) from the intercepts of the two relations. It is clear from Fig. 7 that the data were well fitted by straight lines for the two relations according to the Williamson–Hall equation. The intercepts with y-axis of these two lines obtained from the peaks data of Le Bail and Rietveld methods outputs were (0.00484) and (0.00481) respectively. By using equation (6), the intercept = kλ/t. By putting Scherrer constant (k) equals to (0.9) and substituting λ with its value (0.1541838 nm), the average crystallite size (t) was calculated from the two intercepts of the two lines. The two obtained values were listed, also, in Table 6. Table 6 summarizes the average crystallite size values calculated from the peaks data of the two methods (Le Bail and Rietveld) by using the two equations (Debye–Scherrer and Williamson–Hall). Table 6 shows that the average crystallite sizes (t) calculated from the peaks data of Rietveld method were greater than those calculated from the peaks data of Le Bail method by using the two equations (Debye–Scherrer and Williamson–Hall). Therefore, the best value of the average crystallite size (t) was that calculated by Debye–Scherrer equation using the peaks data of Le Bail method (28.55 nm). One can explain this result by two reasons. The first is the accuracy of Le Bail method, which was more than that of Rietveld method as it was shown in last part. The second reason is the accuracy of using Debye–Scherrer equation, which was more than that of using Williamson–Hall equation. This because the previous equation uses the slope to calculate the average crystallite size while the later equation uses the line intercept and therefore the error has less probability to take place with the slope than that with the intercept. In general, the four values of the average crystallite size (two treatment methods and two equations) were close to each other and the differences between them were small. The mean value of the average crystallite size (t) from these four values was (28.87 nm). The difference between the best value and the mean value of average crystallite size was very small (0.32 nm) and approximately = 1 % only from any of the two values. The important deducing from this
Table 6. The average crystallite size calculated from the peaks data of Le Bail and Rietveld methods using Debye–Scherrer and Williamson–Hall
equations for β-LAS single crystal
The average crystallite size (t) from Debye–Scherrer equation,
nm
The average crystallite size (t) from Williamson–Hall equation,
nm
Le Bail method 28.55 28.67
Rietveld method 29.40 28.85
result was that, the two treatment methods and the two equations gave very close values of the average crystallite size (t), and therefore one can use any method with any equation. Nevertheless, for more accuracy, the best method of treatment is Le Bail method and the best equation is Debye–Scherrer equation.
Conclusions
The grown single crystal of LiNH4SO4 by the slow evaporation
technique of aqueous solution at the constant temperature 309 K has the β-modification (β-LiNH4SO4). The crystal structure of
β-LiNH4SO4, measured at room temperature, relates to phase II (room
temperature phase) for this crystal. The values of the unit cell parameters of β-LiNH4SO4 crystal (phase II) calculated by the two
methods (Le Bail and Rietveld) are very close to the values in the ICDD file (PDF No. 82-0020), but Le Bail method gives values closer to the ICDD file. For the parameters calculated by the two methods, the refinement by Le Bail method has accuracy more than that by Rietveld method because Rietveld method refines more parameters. The values of atomic parameters, bond lengths, and angles of β-LiNH4SO4 crystal (phase II), calculated in the present study by the
FullProf program, have very good agreements with those obtained in some earlier studies. This except some small differences in very little parameters because of type of the used diffraction (X-ray or neutron), type of the instrument (single X-ray diffractometer or powder X-ray diffractometer) and the refinements accuracy which may differs from one work to another. The crystal structure of β-LiNH4SO4 (phase II),
which is drew by the FullProf program in accordance with atomic positions, has very good agreement with that drew and described previously by other programs. The average crystallite size (t) of β-LAS crystal, which calculated from the peaks data of two treatment methods (Le Bail and Rietveld) by using two equations (Debye– Scherrer and Williamson–Hall), have very close values. Therefore, one can use any method with any equation but, for more accuracy, the best method of treatment is Le Bail method and the best equation is Debye–Scherrer equation. The average crystallite size (t) of β-LAS crystal is 28.87 nm (the mean value of four obtained values from the two treatment methods and two equations), or 28.55 nm (the value obtained from the best method and the best equation).
Acknowledgement
The author is thankful to Prof. Dr. M. A. Gaffar and Prof.
Dr. A. M. Abu EL-Fadl.Physics Department, Faculty of Science,
Assiut University, Egypt, for providing with the crystal growth apparatuses, facilitating the department labs for the measurements, and supporting with the principles of the FullProf program.
REFERENCES
[1] Aleksandrova. I.P, Kabanov. I.S, Melnikova. S.V, Chekmasova.
T.I, Yuzvak. V.I, (1977) Sov. Phys. Solid State 19, 605.
[2] Aleksandrov. K.S, Aleksandrova. I.P, Anistratov. A.T,
Shabanov. V.E, (1977) Izv. Akad. Nauk SSSr ser. Fiz. 41, 599.
[3] Aleksandrov. K.S, Aleksandrova. I.P, Zherebtsova. L.I, Kruglik.
A.I, Krupnyi. A.I, Melnikova. S.V, Shneider. V.I, Shuvalov. L.A, (1975) Izv. Akad. Nauk SSSr ser. Fiz. 39, 943.
[4] Chekmasova. T.I, Kabanov. I.S, Yuzvak. V.I, (1977) Phys. Stat.
Sol. (a) 44, k155.
[5] Cullity. B.D, (1978) Elements of X-ray Diffraction, Addison-Wesley Publishing Company, Inc., Philippines.
[6] Desert. A, Gibaud. A, Righi. A, Leitao. U.A, Moreira. R.L, (1995) J. Phys.: Condens. Matter 7, 8445.
[7] Gaafar. M, Kassem. M.E, Kandil. S.H, (2000) Solid State
Communications 115, 509.
[8] Hildmann. O, Mahn. Th, Cross. L.E, Newnahn. R.E, (1975)
Appl. Phys. Lett. 27, 103.
[image:6.595.35.288.708.769.2][10] Itoh. K, Ishikawa. H, Nakamura. E, (1981) Acta Crystallogr. B 37, 664.
[11] Jayaram. B, Sobhanadri. J, (1984) Cryst. Lattice Defects Amorph. Mater. 10, 201.
[12] Kameli. P, Salamati. H, Aezami. A, (2006) J. Appl. Phys. 100, 053914.
[13] Kripal. R, Govind. H, (2008) Physica B 403, 3345.
[14] Krishnan. S, Justin Raj. C, Robert. R, Ramanand. A, Jerome Das. S, (2008) Solid-State Electronics 52, 1157.
[15] Kruglik. A.I, Simonov. M.A, Aleksandrov. K.S, (1978) Soy. Phys. Crystallogr. 23, 274.
[16] Kruglik. A.I, (1978) Kristallografiya 23, 494.
[17] Le Bail. A, Duroy. H, Fourquet. J.L, (1988) Mater. Res. Bull. 23, 447.
[18] Lim. Ae Ran, Jung. Jae Kap, Jeong. Se-Young, (2002) Journal of Physics and Chemistry of Solids 63, 625.
[19] Lim. A.R, Park. S.-E, Jeong. S.-Y, (2000) Solid State Communications 113, 389.
[20] Lukaszewicz. K, Pietraszko. A, (1992) Pol. J. Chem. 66, 2057. [21] Madhu Mohan. M.L.N, (2005) Materials Research Bulletin 40,
850.
[22] Mashiyama. H, Kasano. H, (1993) J. Phys. Soc. Japan. 62, 155. [23] Mitsui. T, Oka. T, Shiroishi. Y, Takashige. M, Iio. K, Sawada.
S, (1975) J. Phys. Soc. Jpn 39, 845.
[24] Nakamura. T, Kojima. S, Takashige. M, Mitsui. T, Asaumi. K, Itoh. S, Minomura. S, (1979) Jpn. J. Appl. Phys. 18, 711. [25] Pepinsky. R, Vedam. K, Hoshino. S, (1958) Phys. Rev. 111,
1467.
[26] Polomska. M, Hilczer. B, Baran. J, (1994) J. Molec. Struc. 325, 105.
[27] Połomska. M, Pawłowski. T, Pietraszko. A, Kirpichnikova. L, (2004) Journal of Molecular Structure 704, 95.
[28] Pura. B, Przedmojski. J, (1981) Acta Phys. Polonica A59, 785. [29] Rietveld. H.M, (1969) J. Appl. Crystallogr. 2, 65.
[30] Rodríguez-Carvajal. J, (1997) Short Reference Guide of the Full Prof Program, Version 3.5, Laboratoire Léon Brillouin (CEA-CNRS), Paris, France.
[31] Shamshin. A.P, (2010) Ferroelectrics 397, 9.
[32] Shenoy. R.K, Ramakrishna. J, (1980) J. Phys. C: Solid State Phys. 13, 5429.
[33] Shimizu. H, Oguri. A, Yasuda. N, Fujimoto. S, (1978) J. Phys. Soc. Jpn 45, 565.
[34] Smirnov. L.S, Loose. A, Dolbinina. V.V, Yakovleva. L.M, Grebenev. V.V, (2008) Journal of Surface Investigation. X-ray, Synchrotron and Neutron Techniques 2, 20.
[35] Sosnowska. I, Hilczer. B, Piskunowicz. P, (1990) Solid State Commun. 74, 1249.
[36] Tsai. S.F, Yu. J.T, (1988) J. Phys. Soc. Jpn 57, 2540.
[37] Thompson. P, Cox. D.E, Hasting. J.M, (1987) J. Appl. Cryst. 20, 79.
[38] Tomaszewski. I.M, Flerov. I.N, (1977) Sov. Phys. Solid State 9, 605.
[39] Tomaszewski. P.E, Pietrasko. A, (1979) Phys. Stat. Sol. (a) 56, 467.
[40] Vogtsberger. B, Rosenberger. H, Aleksandrova. I.P, (1979) Sov. Phys. Solid State 21, 1302.
[41] Willis. F, Leisure. R.G, Kanashiro. T, (1996) Phys. Rev. B 54, 9077.
[42] Wilson. A.C.J, (1962) X-ray Optics, Methuen, London.
[43] Yuzvak. V.I, Zherebtsova. I, Shkuryaeva. V.B, Aleksandrova. I.P, (1975) Sov. Phys. Crystallogr. 19, 480.