Cloud Computing: An Empirical Study of the Correlation
between Scalability and Throughput of Cloud-based
Applications
Stephen M. Ciirah
School of Computing and
Informatics
University of Nairobi
Kenya
Andrew M. Kahonge
School of Computing and
Informatics
University of Nairobi
Kenya
Elisha O. Abade
School of Computing and
Informatics
University of Nairobi
Kenya
ABSTRACT
The goal of this research was to investigate how application architecture impacts the performance of cloud-based applications. One specific area of examination was to determine the correlation between throughput and scalability of applications in a cloud computing environment.
The experimental methodology was adopted for the study. Microsoft Azure cloud platform and Microsoft Visual Studio Team Services were used to conduct graduated load performance tests. A convenience sample for the experiment consisted of seventeen web applications. Advanced statistical analysis of the results was conducted using Pearson Correlation Coefficient analysis.
The results revealed that there was a strong positive correlation between throughput and scalability of cloud based applications, which was statistically significant. Therefore, through the experimental methodology, the null hypothesis was rejected and the alternative hypothesis was accepted.
General Terms
Cloud Computing, Application Architecture, Application Performance, Empirical Study, Experimental Research.
Keywords
Scalability, Throughput, Cloud-based Applications, Cloud Migration, Web Applications, Graduated Load Test.
1.
INTRODUCTION
Cloud computing is a type of Internet-based computing that provides shared computer processing resources and data to computers and other devices on demand. It is a model for enabling ubiquitous, on-demand access to a shared pool of configurable computing resources (e.g. computer networks, servers, storage, applications and services) which can be rapidly provisioned and released with minimal management effort [1].
Cloud computing has very quickly become one of the hottest topics – if not the hottest one – for practicing engineers and academics in domains related to engineering, science, and art for building large-scale networks and Internet applications [2]. Based on the defined benefits and the risks of cloud computing [3], enterprises are considering migrating their existing applications to the cloud or implementing new cloud-based applications.
Migration to cloud computing is a strategic business decision that can affect performance, productivity, growth, as well as
increase competitiveness. The decision to migrate is usually complicated and dynamic due to the immaturity and the still evolving nature of the cloud computing environment [4]. By understanding how architecture relates to the performance of applications in the cloud, businesses can make well informed decisions on the adoption of a cloud computing strategy. It would then be possible to identify application architecture patterns that satisfy the performance expectations when enterprises are considering migrating existing applications to the cloud or developing new cloud-based applications.
The results of the study provide a basis for recommending application architecture considerations for migrating existing applications to the cloud and for developing new cloud based applications. The results also form a good foundation for further research into this relatively new area of academic study in cloud computing.
2.
LITERATURE REVIEW
2.1
Previous Efforts in Understanding
Throughput and Scalability
In his book, [5], seeks to clarify the difference between performance and scalability by asserting that the terms “performance” and “scalability” are commonly used interchangeably, but the two are distinct: performance measures the speed with which a single request can be executed, while scalability measures the ability of a request to maintain its performance under increasing load.
He illustrates this definition with an example that the performance of a request may be reported as generating a valid response within three seconds, but the scalability of the request measures the request’s ability to maintain that three-second response time as the user load increases.
In his blog, [6], proposes that a service is said to be scalable if when there is an increase in the resources in a system, it results in increased performance in a manner proportional to resources added. He further explains that increasing performance in general means serving more units of work, but it can also be to handle larger units of work, such as when datasets grow.
system but if no resource is maxed out before adding new resources, it is unlikely that to see any performance improvement.
From his point of view, [7], postulates the definition of scalability as a constant ratio between workload and throughput. By this definition, he explains that if workload increases proportionally to the resources added, then the throughput should increase in that same proportion.
In yet another effort to define scalability, [8] posits that scalability for a given application A on a platform P is: S(A,P) = R(A,P) / C(A,P)
where
R = Maximum number of requests processed per second by application A on platform P
C = Cost of hardware and software to develop and support application A on platform P
2.2
Conceptual Framework
2.2.1
Variables
For the conceptual framework, the definition by [8] was adopted as follows:
Scalability for a given application A on a platform P is
Scalability S(A,P) = Throughput T(A,P) Cost C(A,P)
Using this definition, the variables to be measured in the conceptual framework are:
Independent variable: Load L(A,P), measured by number of concurrent users using application A on platform P
Dependent variable: Throughput, T(A,P) measured by the maximum number of requests processed per second by application A on platform P
2.2.2
Hypothesis
For the conceptual framework, the definition by [8] was adopted as follows:
The following thesis statement was postulated: As throughput increases, scalability increases. Therefore, there is a positive relationship between throughput and scalability, such that high values of throughput are associated with high values of scalability.
The null hypothesis for this test was:
H0: ρ = 0; the correlation coefficient for the population is zero. There is no statistically significant relationship between throughput and scalability of applications.
The alternative hypothesis for this test was:
H1: ρ ≠ 0; the correlation coefficient for the population is not equal to zero. There is a statistically significant relationship between throughput and scalability of applications.
3.
METHODOLOGY
3.1
Experimental Research
Experimental research method [9] was used in this study. The study sought to find answers to the following questions:
How does changing work load affect the response time of an application request?
How does changing work load affect the throughput of an application?
3.2
Experimental Group
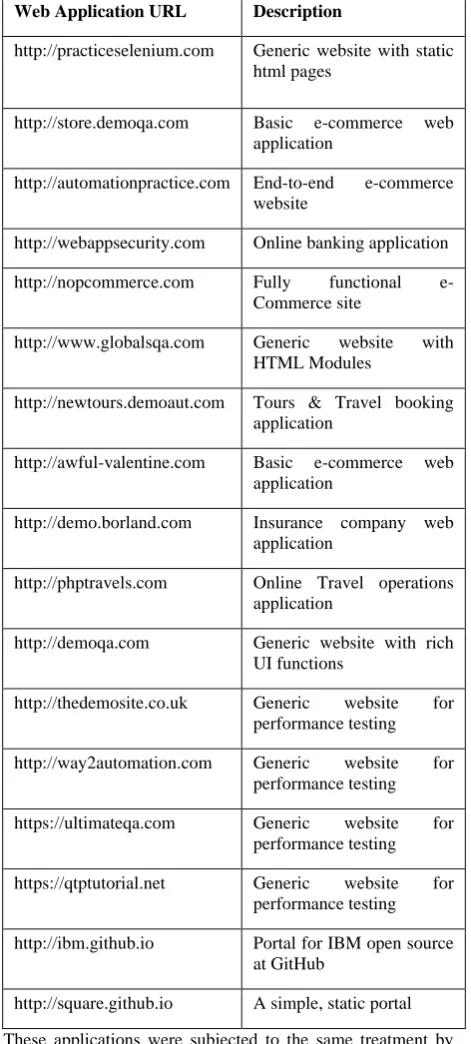
[image:2.595.314.550.189.712.2]For this experiment, convenience sampling technique [10] was used. Using this technique, 17 web applications were identified as available and accessible for performing graduated load tests, forming the experimental group listed in the table below:
Table 1. List of web applications used in the experiment
Web Application URL Description
http://practiceselenium.com Generic website with static html pages
http://store.demoqa.com Basic e-commerce web application
http://automationpractice.com End-to-end e-commerce website
http://webappsecurity.com Online banking application http://nopcommerce.com Fully functional
e-Commerce site
http://www.globalsqa.com Generic website with HTML Modules
http://newtours.demoaut.com Tours & Travel booking application
http://awful-valentine.com Basic e-commerce web application
http://demo.borland.com Insurance company web application
http://phptravels.com Online Travel operations application
http://demoqa.com Generic website with rich UI functions
http://thedemosite.co.uk Generic website for performance testing http://way2automation.com Generic website for
performance testing https://ultimateqa.com Generic website for
performance testing https://qtptutorial.net Generic website for
performance testing http://ibm.github.io Portal for IBM open source
at GitHub
3.3
Laboratory Environment
A cloud computing simulator platform was used to test the performance of different applications.
The cloud simulator was based on Microsoft Visual Studio Teams Service (www.visualstudio.com) on Microsoft Azure portal (https://azure.microsoft.com), a cloud-based load testing environment leveraging Microsoft Azure cloud computing resources and services.
3.4
Test and Data Collection Procedure
[image:3.595.315.560.71.229.2]For each application, the graduated load test was conducted and the performance data recorded. This test procedure was repeated for each application in the sample population using the test parameters shown in the table below:
Table 2. Test parameters used in the graduated load tests
Test Parameter Value
Run duration (minutes) 5
Load pattern Step
Max v-users 200
Start user count 10 Step duration (seconds) 10 Step user count (users/step) 10 Warmup duration (seconds) 0
Browser mix IE – 60%, Chrome – 40% Geo-location West US (California) Throughout the experiment, values of the independent variable were recorded and the effects on the dependent variable observed and recorded using the tools available in the laboratory cloud computing environment.
3.5
Data Analysis
Data analysis was conducted using the Pearson correlation coefficient, which is a measure of the strength of a linear association between two variables and is denoted by r [12].
4.
RESULTS AND DISCUSSIONS
A set of results from the experiments conducted have been selected for discussion in the paper.
4.1
Graduated Load Test Pattern
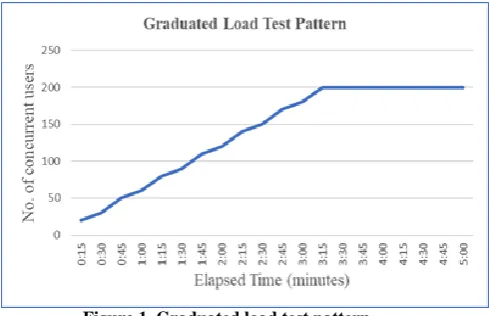
The graph below, figure 1, shows the graduated load test pattern achieved with the test parameters above.
Figure 1. Graduated load test pattern
From the graph, in figure 1 above, it was observed that the number of concurrent users increased steadily by 10 users every 10 seconds from the initial 10 users to the set maximum of 200 concurrent users. The maximum number of concurrent users was achieved after 3 minutes and 10 seconds. The test continued up to the set period of 5 minutes.
4.2
Results for Selected Test Applications
For each test application, the results captured 4 attributes: performance, throughput, errors and the tests conducted. The results for two test applications are presented here. One application represents the attributes of applications considered to have a good architectural design while the other application represents the attributes of applications considered to have a constrained architectural design.
4.2.1
Test Application 1
The graduated load test results for the first test application, www.practiceselenium.com, are shown in table 3 below. Table 3. Results for test application 1
Elapsed Time
No. of users
Pages/ Sec
Avg. Page Time
Errors/ Sec
% Processor Time
0:00
[image:3.595.53.279.247.446.2]4:00 200 155.00 0.43 - 84.69 4:15 200 151.80 0.46 - 83.65 4:30 200 152.13 0.44 - 85.31 4:45 200 155.00 0.45 - 84.90 5:00 200 148.00 0.42 - 83.44
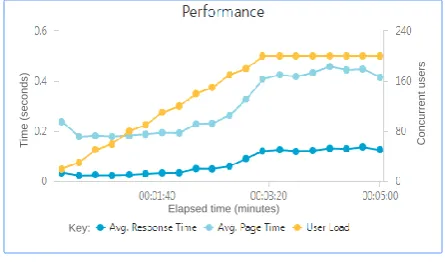
Performance
From the performance graph below, figure 2, it was notable that both the average response time and the average page load time remained consistently low throughout the test period, as depicted by the y-axis scale of between 0 and 0.6 seconds. The average page load time increased consistently with the increase in user load in a similar pattern like the average response time. T im e ( s e c o n d s )
[image:4.595.53.288.71.157.2]Elapsed time (minutes) Key: C o n c u rr e n t u s e rs
Figure 2. “Performance” data for test application 1
Throughput
From the throughput graph below, figure 3, it was notable that the number of requests processed per second increased consistently with the increase in the number of concurrent users. It can be argued that throughput increased with increase in user load. At the same time, the number of pages per second increased marginally throughout the test period.
P a g e s /R e q u e s ts p e r S e c
[image:4.595.316.540.73.206.2]Elapsed time (minutes) Key: C o n c u rr e n t u s e rs
Figure 3. “Throughput” data for test application 1
Errors
From the errors graph below, figure 4, it was notable that no failed requests were recorded throughout the test period.
F a ile d R e q u e s ts p e r S e c C o n c u rr e n t u s e rs
Elapsed time (minutes) Key:
Figure 4. “Errors” data for test application 1
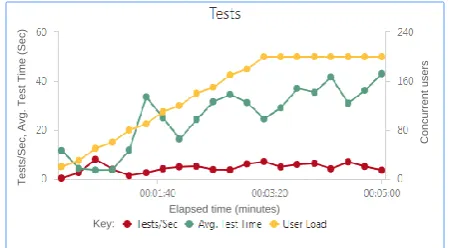
Tests
From the graph below, figure 5, it was notable that the number of tests processed per second was consistent with the increasing user load throughout the test period. At the same time, the average test time remained consistently low throughout the test period.
T e s ts /S e c , A v g . T e s t T im e ( S e c ) C o n c u rr e n t u s e rs
[image:4.595.55.278.259.390.2]Elapsed time (minutes) Key:
Figure 5. “Tests” data for test application 1
Discussion
The graduated load test results showed that test application 1, www.practiceselenium.com, which is a static HTML website, has a good architectural design and was able to provide a consistent user experience at all levels of user load used during the test, up to the peak level of 200 concurrent users. The application design also exhibited high scalability as throughput increased with increasing user load and no page load errors were recorded during the test.
4.2.2
Test Application 2
The graduated load test results for the second test application, www.store.demoqa.com, are shown in table 4 below.
Table 4. Results for test application 2
Elapsed Time No. of users Pages/ Sec Avg. Page Time Errors/ Sec % Processor Time 0:00
[image:4.595.317.539.289.421.2] [image:4.595.56.279.492.624.2]1:45 110 4.27 23.50 7.33 17.81 2:00 120 4.93 15.51 10.27 9.79 2:15 140 4.93 24.64 7.73 2.29 2:30 150 3.93 29.75 7.60 1.15 2:45 170 3.60 34.33 6.00 4.79 3:00 180 6.20 30.11 9.27 5.00 3:15 200 7.00 23.87 10.47 1.04 3:30 200 5.47 30.27 7.67 1.46 3:45 200 5.27 35.51 7.73 1.25 4:00 200 6.33 34.48 7.27 0.83 4:15 200 4.13 40.97 7.33 0.73 4:30 200 7.07 29.54 8.60 1.35 4:45 200 5.60 36.99 7.33 1.67 5:00 200 3.53 42.26 5.00 0.83
Performance
From the performance graph below, figure 6, it was notable that both the average response time and the average page load time increased in an irregular pattern as the user load increased. At the same time, the values for the two metrics remained relatively high throughout the test period, as depicted by the y-axis scale of between 0 and 45 seconds.
T im e ( s e c o n d s ) C o n c u rr e n t u s e rs
[image:5.595.317.540.120.252.2]Elapsed time (minutes) Key:
Figure 6. “Performance” data for test application 2
Throughput
From the throughput graph below, figure 7, it was notable that the number of requests and number of pages processed per second reduced consistently with the increase in the number of concurrent users. It can therefore be argued that throughput decreased with increase in user load.
P a g e s /R e q u e s ts p e r S e c C o n c u rr e n t u s e rs
[image:5.595.316.541.342.466.2]Elapsed time (minutes) Key:
Figure 7. “Throughput” data for test application 2
Errors
From the errors graph below, figure 8, it was notable that rate of failed requests per second increased with the increase in user load and remained high throughout the test period.
F a ile d R e q u e s ts p e r S e c
Elapsed time (minutes)
C o n c u rr e n t u s e rs Key:
Figure 8. "Errors" data for test application 2
Tests
From the tests graph below, figure 9, it was notable that the number of tests processed per second remained low throughout the test period in spite of the increase in user load. On the other hand, the average test time increased with increase in user load.
T e s ts /S e c , A v g . T e s t T im e ( S e c ) C o n c u rr e n t u s e rs
Elapsed time (minutes) Key:
Figure 9. “Tests” data for test application 2
Discussion
The graduated load test results showed that test application 2, www.store.demoqa.com, which is an e-commerce application, has a constrained architectural design that affected user experience depending on the number of concurrent users used during the test, up to the peak level of 200 concurrent users. With increasing user load, the number of failed requests increased as well as the average page load time, lending the application to provide an inconsistent user experience with changes in user load.
Compared to applications examined in previous tests, this application showed that throughput decreased with increase in user load as opposed to throughput increasing with user load.
4.3
Classification of Test Applications
[image:5.595.55.278.399.520.2] [image:5.595.58.279.619.735.2]Table 5. Classification of test applications
Good architectural design applications
Constrained architectural design applications
http://practiceselenium.com http://store.demoqa.com http://zero.webappsecurity.com http://newtours.demoaut.com http://demo.nopcommerce.com http://automationpractice.com http://www.globalsqa.com http://awful-valentine.com http://demo.borland.com http://phptravels.com http://thedemosite.co.uk http://demoqa.com http://way2automation.com https://ultimateqa.com http://ibm.github.io https://qtptutorial.net
http://square.github.io
4.4
Pearson
Correlation
Coefficient
Analysis
The analysis of these graphical results provided a good basis for conducting a high level evaluation of the performance of the test applications. However, this level of analysis was not adequate for testing the research hypothesis. In order to test the hypothesis, inferential statistical analysis was required. Inferential statistical analysis was conducted using Pearson Correlation Coefficient analysis to determine “r”, the correlation coefficient which shows the direction and strength of the relationship between throughput and scalability.
4.4.1
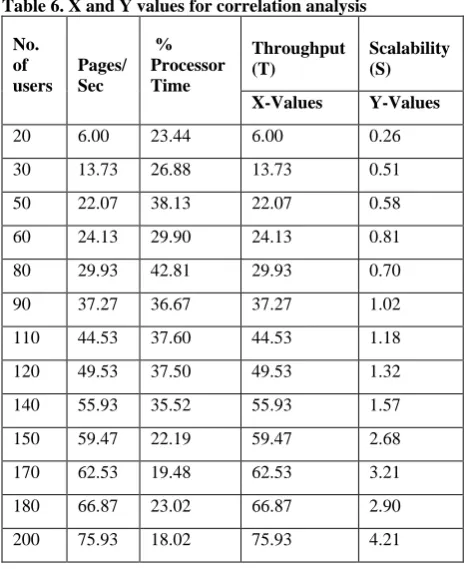
Consolidated data
The consolidated data below was used for the analysis: Table 6. X and Y values for correlation analysis
No. of users
Pages/ Sec
% Processor Time
Throughput (T)
Scalability (S)
X-Values Y-Values
20 6.00 23.44 6.00 0.26
30 13.73 26.88 13.73 0.51
50 22.07 38.13 22.07 0.58
60 24.13 29.90 24.13 0.81
80 29.93 42.81 29.93 0.70
90 37.27 36.67 37.27 1.02
110 44.53 37.60 44.53 1.18
120 49.53 37.50 49.53 1.32
140 55.93 35.52 55.93 1.57
150 59.47 22.19 59.47 2.68
170 62.53 19.48 62.53 3.21
180 66.87 23.02 66.87 2.90
200 75.93 18.02 75.93 4.21
SPSS Statistics software was used for correlation coefficient analysis, producing results shown below.
4.4.2
Correlation coefficient values
[image:6.595.53.289.432.717.2]From the SPSS analysis shown in table 7 below, it was determined that the Pearson correlation coefficient, r, was .675. Since the sign of the Pearson correlation coefficient is positive and |r| > 0.5, there was a strong positive correlation between throughput and scalability. Therefore, Pearson correlation analysis showed there was a strong positive correlation between throughput and scalability, r = .675. Table 7. Correlation analysis showing coefficient values
Throughput Scalability
Throughput
Pearson
Correlation 1 .675
*
Sig. (2-tailed) 0.011
N 13 13
Scalability
Pearson
Correlation .675* 1 Sig. (2-tailed) 0.011
N 13 13
*. Correlation is significant at the 0.05 level (2-tailed).
4.4.3
Determining statistical significance
A test for statistical significance was conducted to test the hypothesis about the linear relationship between the variables in the population the sample was selected from.
From the output table 8 below, the statistical significance (p-value) of the correlation coefficient in this analysis was .011. Since p < .05, in this case (p = .011), it was determined that the correlation coefficient was statistically significantly different from zero. The analysis therefore showed there was a statistically significant strong positive correlation between throughput and scalability, r = .0.675, p = 0.011.
Table 8. Output showing statistical significance
Throughput Scalability
Throughput
Pearson
Correlation 1 .675*
Sig. (2-tailed) 0.011
N 13 13
Scalability
Pearson
Correlation .675* 1 Sig. (2-tailed) 0.011
N 13 13
*. Correlation is significant at the 0.05 level (2-tailed).
4.4.4
Discussion
Pearson Correlation Coefficient analysis was conducted to assess the relationship between throughput and scalability for the graduated load test results for all test applications used in the experiment.
[image:6.595.313.549.477.625.2]It was also determined that strong positive correlation between throughput and scalability was statistically significant. Therefore, the null hypothesis was rejected and the alternative hypothesis was accepted.
5.
CONCLUSION AND
RECOMMENDATIONS
Through a detailed literature search and review, development of a conceptual framework, using a quasi-experimental methodology for testing and data collection; and using inferential statistical analysis tools, the research objectives were achieved.
Using Microsoft Visual Studio Team Services (VSTS) on Microsoft Azure cloud platform, graduated load tests were conducted and performance data recorded for all applications in the sample population.
From the empirical data and Pearson Correlation Coefficient statistical analysis, it was determined that there was a strong positive correlation between throughput and scalability, which was statistically significant. This means that there is a linear relationship between scalability and throughput, such that high values of scalability are associated with high values of throughput and vice versa. Therefore, the null hypothesis was rejected, and the alternative hypothesis was accepted.
5.1
Recommendations for Further
Research
This was a very foundation study in the area of application architecture and performance management of cloud-based applications. According to the literature search and review conducted, limited academic research has been conducted in this area.
Future research is therefore encouraged, particularly to improve on the conceptual framework and the experimental design so as to increase the internal and external validity of the research findings on how architecture impacts the performance of cloud-based applications.
The scope of further research should address some of the limitations in the current study such as adopting a true experiment design with random sampling method and having a control group.
In addition, the range of tests should be diversified to include online business transactions such as e-commerce, financial and data base query processing transactions.
5.2
Implications to Practitioners
The subject of cloud computing, application architecture and application performance are very important to cloud computing practitioners, who include cloud computing consultants, cloud services design professionals, solution architects, application performance management solution providers and professionals, business leaders among others. This study has brought out very important factors that should be considered when businesses are developing a cloud computing strategy for business applications:
Applications should be designed for high scalability, which translates to high throughput and therefore the ability to process more transactions for more users without impacting performance.
It is important to check the performance of an application before it is launched or before deploying updates to production.
Through such performance tests, key decisions regarding the application readiness to meet the performance expectations for the targeted user base can be determined, avoiding frustration from users and potential loss of business due to failure of services at peak loads.
With test performance data available, businesses can make well informed decisions regarding whether to migrate existing applications to the cloud or to develop new cloud based applications, or even, to maintain their existing on premise applications.
6.
ACKNOWLEDGMENTS
The authors wish to thank the members of the faculty at the School of Computing and Informatics, University of Nairobi, for all the support provided during the time of conducting this research.
7.
REFERENCES
[1] Yu, W. and Chen, J. (2011). Semantic Service in Cloud Computing. In: Advances in Information Technology and Education. Communications in Computer and Information Science, vol 201. [online] Berlin, Heidelberg: Springer, Berlin, Heidelberg, p.156.
Available at:
https://link.springer.com/chapter/10.1007/978-3-642-22418-8_23 [Accessed 9 May 2017].
[2] Pallis, G. (2010). Cloud Computing: The New Frontier of Internet Computing. IEEE Internet Computing, 14(5), pp.70-73.
[3] Linthcum, D. (2016). The Benefits of Cloud Computing for the Enterprise. [Blog] CloudAcademy Blog. Available at: http://cloudacademy.com/blog/the-benefits-of-cloud-computing-for-the-enterprise/ [Accessed 14 May 2017] [4] Alkhalil, A., Sahandi, R. and John, D. (2016). A decision
process model to support migration to cloud computing. International Journal of Business Information Systems, [online] 24(1), pp.102-126. Available at: https://dl.acm.org/citation.cfm?id=3031057 [Accessed 22 Oct. 2017].
[5] Haines, S. (2006). Pro Java EE 5 performance management and optimization. Berkeley, Calif: Apress, p.224.
[6] Vogels, W. (2006). A Word on Scalability. [Blog] All
Things Distributed. Available at:
http://www.allthingsdistributed.com/2006/03/a_word_on _scalability.html [Accessed 22 Nov. 2017].
[7] Cecchet, E. (2006). A Word on Scalability. [Blog] All
Things Distributed. Available at:
http://www.allthingsdistributed.com/2006/03/a_word_on _scalability.html [Accessed 22 Nov. 2017].
[8] Kersey, M. (2000). Scalability vs OOD. [Blog] Google
Groups. Available at:
https://groups.google.com/forum/?hl=en#!msg/microsoft. public.inetserver.asp.components/c4G5Ehcr86c/FY9nj5 BrhNkJ [Accessed 21 Nov. 2017].
[9] Explorable (2008). Experimental Research. [Blog]
Explorable. Available at:
https://explorable.com/experimental-research [Accessed 30 Nov. 2017].
17 [11] Haines, S. (2006). Pro Java EE 5 performance
management and optimization. Berkeley, Calif: Apress, p.224.
[12] Statistics.laerd.com. (2013). Pearson Product-Moment Correlation. [online] Available at: