Power Quality Improvement of Grid Connected Renewable System
using STATCOM Controller at Distribution Level
P. Krishna Prasad
1, Dr. K. Padma
21
Post graduate scholar, Dept. of Electrical Engineering, Andhra University, Visakhapatnam, Andhrapradesh, India
2Assistant Professor, Dept. of Electrical Engineering, Andhra University, Visakhapatnam, Andhra Pradesh, India
---***---Abstract -
The main aim of this paper is to enhance thepower quality of grid interconnected system with photovoltaic cell under balanced condition with non-linear load. The photovoltaic system plays a key role in the present scenario as compared with other Renewable energy systems. And STATCOM controller one of the device in FACTS family is proposed in this paper for improving the power quality and reduce the current harmonics. The STATCOM control technique is designed using model control theory to contribute the effective damping characteristics. The system performance is verified under four cases i.e. with statcom PV and wind, with only statcom, with only wind, without statcom PV and wind. These setup is simulated using Matlab/Simulink.
Key Words: Renewable source, Statcom Controller, Power
Quality, FACTS, MPPT
1. INTRODUCTION
With increase in quality and quantity of loads, as a result of increase in population, power system operation is subjected to a number of challenges. The high utilization of non-conventional energy source [1], as one of the resource for distribution of energy, given rise to problems like low-frequency oscillations, poor voltage regulation and other related power quality problems. Therefore, the power electronic based forced commutated converters are preferred in distribution systems for maintenance of system stability, reliability and quality of power as the point of common coupling.
[image:1.595.307.555.219.447.2]The non-linear load current harmonics may result in voltage harmonics and can create a serious PQ problem in the powersystem network.The causes of power quality problems are generally complex and difficult to detect when we integrate a photovoltaic system to the grid. Technically speaking, the ideal AC line supply by the utility system should be a pure sine wave of fundamental frequency. Therefore conclude that the lack of quality power can cause loss of production, damage of equipment or can even be detrimental to human health. It is therefore imperative that a high standard of power quality is maintained [2]. This paper demonstrates that the power electronic based power conditioning using custom power devices like STATCOM can be effectively utilized to improve the quality of power supplied to the customers. Here, the main idea is the maximum utilization of inverter rating which is most of the time underutilized due to intermittent nature of RES [3].
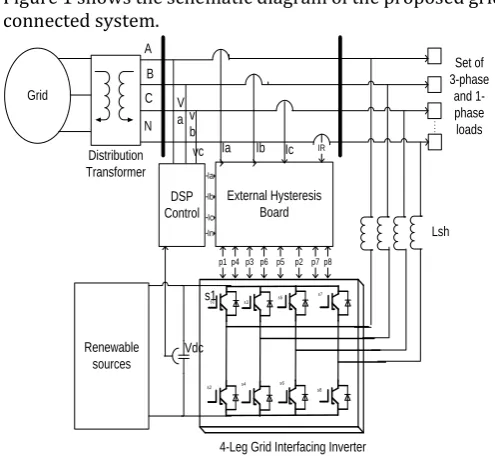
Figure 1 shows the schematic diagram of the proposed grid connected system. Grid External Hysteresis Board DSP Control V a v b Ia Ib Ic In A B C N Renewable sources s3 s1 s5 s7 s2 s4 s6 s8
4-Leg Grid Interfacing Inverter p1 p4 p3p6 p5 p2 p7 p8
Vdc IR s1 Lsh Set of 3-phase and 1-phase loads Ia Ib Ic
vc Distribution Transformer
Fig -1: Schematic diagram of the proposed grid connected photovoltaic system.
FACTS family is proposed in this paper for improving the power quality and reduce the current harmonics. The STATCOM control technique is designed using model control theory to contribute the effective damping characteristics. Under the analysis of facts devices using renewable energy sources generation.
1.1 Grid Interconnection of Photo Voltaic System
the ripple components due to switching problems. The problem associated with the grid connected system is that the dc link voltage that must be oscillates between the two levels which depends on the operating climatic conditions (ambient temperature & irradiance) in which inverter which acts us a power controller between the dc link and the utility [5]. Dc link is generally used to isolate between the grid side and the inverter side so that we can control both PV system and grid separately.
1.2 Solar Panel
A solar cell is the most fundamental component of a photovoltaic system. The PV array is constructed by many series or parallel connected solar cells to obtain required current, voltage and high power. Each Solar cell is similar to a diode with a p-n junction formed by semiconductor material [6]. When the junction absorbs light, it can produce currents by the photovoltaic effect. The equivalent circuit of a solar cell is the current source in parallel with a diode of a forward bias which represents dark current. The output terminals of the circuit are connected to the load. The equivalent circuit of the solar system is as shown in figure 2. The current equation of the solar cell is given by [7]:
Fig -2: Equivalent Circuit of a Solar Cell
1.3 Wind Energy System
The generation of electrical power is obtained mainly in two ways i.e one is conventional source and other is non- conventional energy sources. The generation of electricity using non-renewable resources such as coal, natural gas, oil and so on, shows great impact on the environment by production of pollution from their general gases. Hence, by considering all these conditions the generation of electricity is obtained from the renewable energy sources.
Basically, out of all renewable energy sources the wind turbine plays an important role for generating electricity. And also from economical point of view the wind turbine has low maintainece cost because it needs no fuel so that it is pollution free. Mostly, in present world 50-60 percent [13] of energy is generated from wind turbine as compared with all other renewable energy sources.
The typical layout of wind power generation as shown below.
Fig -3: Basic schematic diagram of wind turbine
The wind turbine converters wind energy to electrical energy and the generator mechanical shaft power is obtained by the following expression:
[image:2.595.329.507.135.269.2]And the coefficient of power also plays a key role for wind system and the basic minimum value of power coefficient is 0.5. The power coefficient is obtained by the ratio of tip speed ratio to pitch angle. The pitch angle is the angle to which the blades of turbine is arranged based on their longitude axis and changing of wind direction. The tip speed ration is defined as ratio of linear speed of the rotor to the wind speed.
Figure 4 shows a typical waveform for coefficient of power with respect to the tip speed ratio. The maximum achievable range of TSR is from 0.4 to 0.5 for turbine with high speed and from 0.2 t0 0.4 for turbine with low speed [14].
Fig -4: Power coefficient Vs Tip Speed Ratio
2. STATCOM AND ITS CONTROL TECHNIQUES
[image:2.595.74.252.375.506.2] [image:2.595.337.527.550.668.2]for grid connected photo voltaic energy generation for power quality improvement has following objectives.
• Unity power factor at the source side.
• Reactive power support only from STATCOM to wind Generator and Load.
• The Dc voltage is obtained for STATCOM is generated from Solar Cells.
A STATCOM is a controlled reactive-power source. The STATCOM is connected to the power system at a PCC (point of common coupling), through a step-up coupling transformer, where the voltage-quality problem is a concern [10].It provides voltage support by generating or absorbing reactive power at the point of common coupling without the need of large external reactors or capacitor banks. Using the controller, the VSC and the coupling transformer, the STATCOM operation is illustrated in Figure 6.
Vdc Cdc Controller Firing angle DC voltage Uref Voltage source converter
3-phase AC voltage U UT Phase Load Reactive current injection PCC Coupling X TransformerT Transmission Line UT
Generation
Power flow
Iq
F ig -5: Basic Block Diagram for Static Compensator
The utilization of different types of electrical loads in three phase system, produces an unbalances in current, which causes the unreliable power. Thereby for maintaining the electrical reliability the statcom controller plays a key role. In this statcom control technique, the reference voltage and dc link capacitor voltages are compared and the result obtained from this is converted to two phase coordinators called as orthogonal vectors.
The STATCOM acts either as a source or a sink of reactive power. It provides voltage support by injecting or by absorbing reactive power at the point of common coupling without any large external reactors or capacitor banks. Here we use a PID controller with STATCOM for damping enhancement. The PID controller is designed using the Model Control Theory. The mathematical modelling of the controller is given in [10]. The control scheme used here is shown in the Figure 7.
Vsm={2/3(V2sa+V2sb+V2sc)1/2}
The in-phase unit vectors are obtained from AC source phase voltage and the RMS value of unit vector Usa, Usb, Usc as shown in (2)
STATCO M CONTRO LLER Unit vector Usa, Usb, Usc
X limiter iSabc Vdcref From source GATE PULSE
Fig -6: Control Diagram
3. SIMULATION RESULTS
Generally this simulation process is done under four cases:
Case-I Grid connected system with wind and STATCOM PV
Case-II Grid connected system with only STATCOM PV
Case-III Grid connected system only with wind
Case-IV Grid connected system without wind and STATCOM PV
Case-I Grid connected system with wind and STATCOM PV
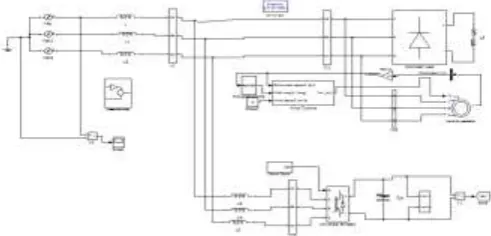
[image:3.595.315.560.141.295.2]The proposed control scheme is simulated using SIMULINK in power system block set. The main block diagram of the system operational scheme is shown in Figure 1. The simulation diagram of the proposed PV cell based grid interfaced system using STATCOM and wind is
as shown in figure 6.
[image:3.595.59.270.335.495.2] [image:3.595.315.561.593.711.2]Fig -8: simulation result for current.
Fig -9: Simulation results of power factor for nonlinear balanced load
Total Harmonic Distortions
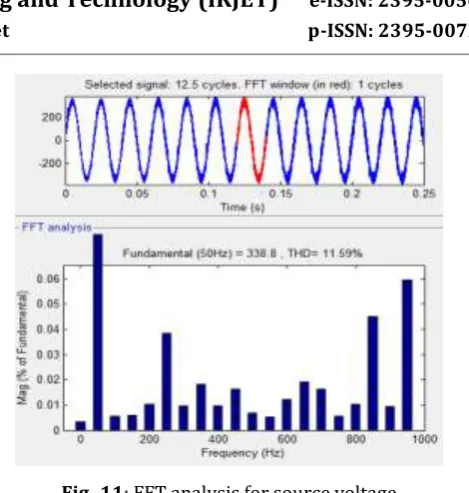
[image:4.595.319.554.56.303.2]The following plot shows the Total harmonic distortion of the source current and source voltage with Wind and statcom PV the Total harmonic distortion of the source current is 0.57% and source voltage is 11.59% for Nonlinear balanced load.
Fig -10: FFT analysis for source current.
Figure 10 shows the total harmonic distortion of current 0.57% in proposed system with Statcom PV and wind.
Fig -11: FFT analysis for source voltage
Figure 11 shows the total harmonic distortion of voltage 1159% in proposed system with Statcom PV and wind.
Case-II Grid connected system with only STATCOM PV
[image:4.595.38.291.293.392.2]The implemented scheme is developed in MATLAB/Simulink. The control circuit and Renewable energy system is developed in a subsystem. The following Simulink block diagram is the implemented scheme considering Non linear balanced load with statcom PV. The simulation diagram of the proposed PV cell based grid interfaced system using Statcom is as shown in figure 13.
Fig -12: Grid connected with only statcom PV
Total harmonic distortions:
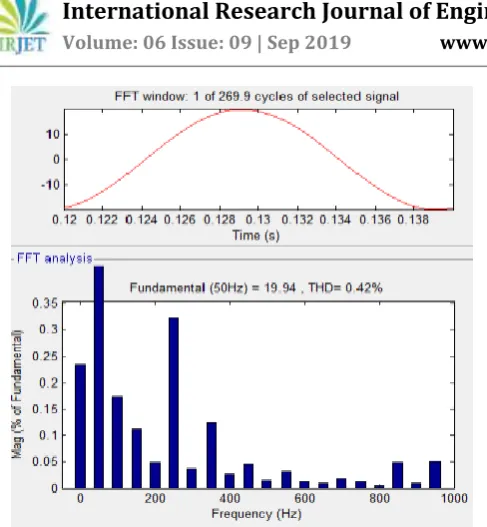
[image:4.595.309.562.463.580.2] [image:4.595.56.267.525.726.2]Fig -13: FFT analysis for source current.
[image:5.595.309.562.344.538.2]Figure 13 shows the total harmonic distortion of current 0.42% in proposed system with Statcom PV.
Fig -14: FFT analysis for source voltage
Figure 14 Shows the total harmonic distortions of voltage 11.30% load only with statcom PV
Case-III Grid connected system only with wind
The implemented scheme is developed in MATLAB/Simulink. The control circuit and Renewable energy system is developed in a subsystem. The following Simulink block diagram is the implemented scheme considering Non linear balanced load only with wind.The simulation diagram of the proposed PV cell based grid interfaced system using only wind is as shown in figure 16.
Fig -15: Grid connected with wind
Total harmonic distortions:
The following plot shows the Total harmonic distortion of the source current and source voltage with only wind the Total harmonic distortion of the source current is 4.47% and source voltage is 2.13% for Non linear balanced load.
Fig -16: FFT analysis for source current.
Figure 16 shows the total harmonic distortion of current 4.47% in proposed system with only wind.
[image:5.595.35.266.378.572.2] [image:5.595.321.545.595.761.2]Figure 17 shows the total harmonic distortions of voltage 2.13% load only with only wind.
Case-IV Grid connected system without wind and STATCOM PV
[image:6.595.324.552.64.287.2]The implemented scheme is developed in MATLAB/Simulink. The control circuit and Renewable energy system is developed in a subsystem. The following Simulink block diagram is the implemented scheme considering Nonlinear balanced load without wind and statcom PV.The simulation diagram of the proposed PV cell based grid interfaced system using only wind is as shown in figure 18.
Fig -18: Grid connected without wind statcom PV
Total harmonic distortions:
[image:6.595.29.288.265.378.2]The following plot shows the Total harmonic distortion of the source current and source voltage without wind and statcom PV the Total harmonic distortion of the source current is 4.81% and source voltage is 2.58% for Nonlinear balanced load.
Fig -19: FFT analysis for source current.
Figure 19 shows the total harmonic distortion of current 4.81% in proposed system without wind and statcom PV.
Fig -20: FFT analysis for source voltage
Figure 20 shows the total harmonic distortions of voltage 2.58% load only without wind and statcom PV.
Table -1: THD% of current and voltage performances in four cases
DIFFERENT TYPES OF
PERFORMANCES THD% OF CURRENT THD% OF VOLTAGE Only grid system without wind
and statcom PV 4.81% 2.58% Grid system only with wind 4.47% 2.13%
Grid system with wind and statcom PV
0.57% 11.59%
Grid system without wind 0.42% 11.30%
4. CONCLUSION
[image:6.595.57.266.517.686.2]REFERENCES
[1] Qing-Chang Zhong, Senior Member, Cascaded Current– Voltage Control to Improve the Power Quality for a Grid-Connected Inverter With a Local Load” in IEEE TRANSACTIONS ON INDUSTRIAL ELECTRONICS, VOL. 60, NO. 4, APRIL 2013.
[2] K. S. Hook, Y. Liu, and S. Atcitty, “Mitigation of the wind generation integration related power quality issues by energy storage,” EPQU J., vol. XII, no. 2, 2006.
[3] R. Billinton and Y. Gao, “Energy conversion system models for adequacy assessment of generating systems incorporating wind energy,” IEEE Trans. on E. Conv., vol. 23, no. 1, pp. 163–169, 2008, Multistate.
[4] Wind Turbine Generating System—Part 21, International standard-IEC 61400-21, 2001.
[5] J. Manel, “Power electronic system for grid integration of renewable energy source: A survey,” IEEE Trans. Ind. Electron., vol. 53, no. 4, pp. 1002–1014, 2006, Carrasco. [6] M. Tsili and S. Papathanassiou, “A review of grid code technology requirements for wind turbine,” Proc. IET Renew.power gen., vol. 3, pp. 308–332, 2009.
[7] S. Heier, Grid Integration of Wind Energy Conversions. Hoboken, NJ: Wiley, 2007, pp. 256–259.
[8] J. J. Gutierrez, J. Ruiz, L. Leturiondo, and A. Lazkano, “Flicker measurement system for wind turbine certification,” IEEE Trans. Instrum. Meas., vol. 58, no. 2, pp. 375–382, Feb. 2009.
[9] Indian Wind Grid Code Draft report on, Jul. 2009, pp. 15– 18, C-NET.
[10] D.V.S.J. Poojitha, “Power quality improvement of SRM by using DSTATCOM and grid interconnection of non-fossil fuels at distribution level”, IJATIR Trans., vol.08, pp.0582-0588. Mar 2016.